Gold at Support: the Upcoming Move / Commodities / Gold & Silver 2019

 Goldand gold stocks declined yesterday, but silver hesitated. Does this, plus thefact that gold is up so far in today’s pre-market trading indicate a short-termbottom? Or is the picture even on the verge of turning bullish?
Notat all. Let’s take a look at the chart below for details.
Yesterdayin the PMs
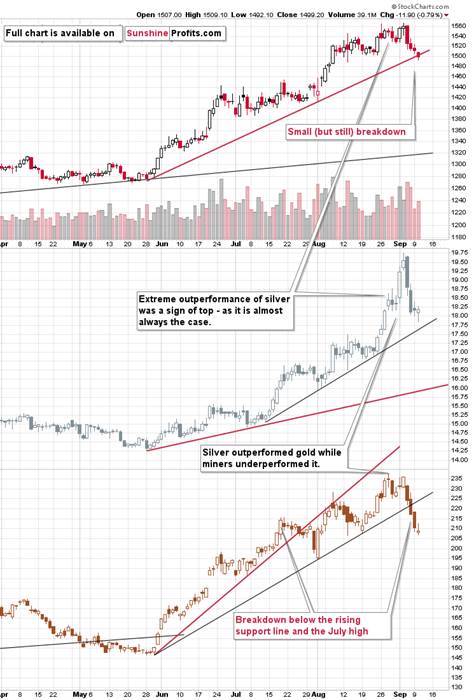
Goldclose – and thus broke – below the $1,500 level yesterday. The breakdown wassmall – less than $1, so the move is definitely not confirmed. At the sametime, gold moved to the rising support line but failed to close below it. Thissupport is likely to trigger a rebound and that’s what we’re seeing in today’strading. So far gold is up by about $7 and we don’t expect the rally to be muchbigger than that. Gold’sseasonals don’t point to strength at this time and there are multiple other factors thatinstead point to the decline’s continuation.
Forinstance, gold miners just confirmed thebreakdown below their rising support line. They also managed to closeyesterday’s session below July highs. This is bearish on its own and alsothrough the relationship with gold. Gold miners’ weakness relative to goldtends to herald weakness in the entire precious metals sector.
Doessilver’s pause indicate any strength here? No. It declined sharply, so a dailybreather is very natural, and it doesn’t imply anything.
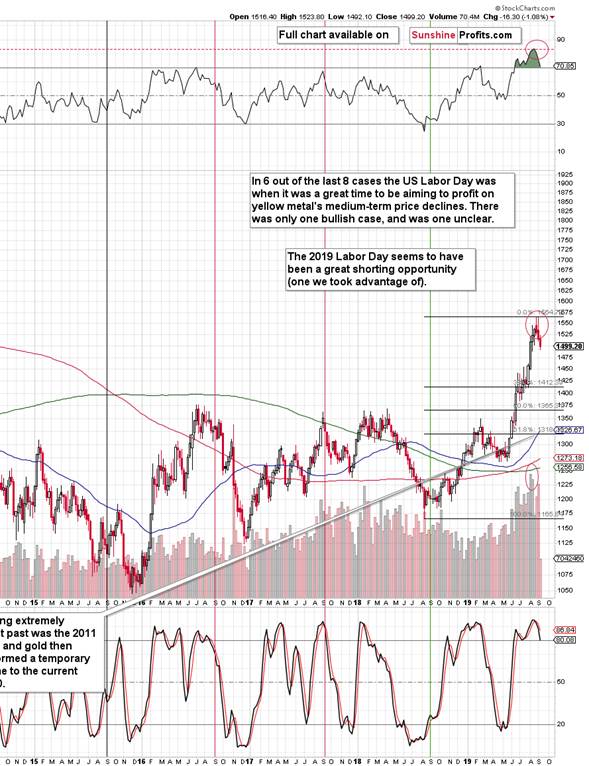
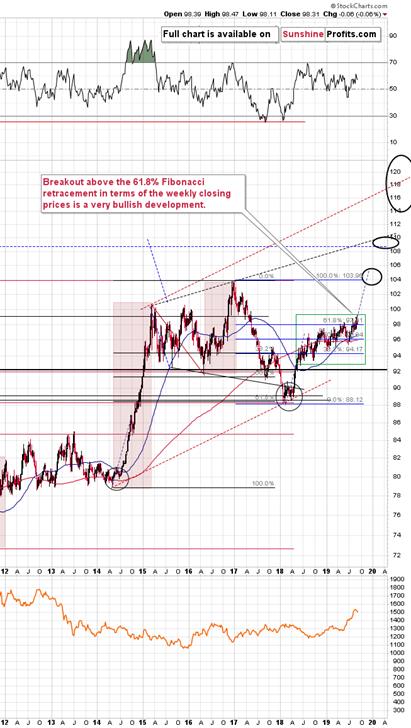
Takinga bigger perspective, we see how gold declined after two big-volume weeklyreversals. Gold declined shortly after the U.S. Labor Day – just like weexpected it to, and just like it was the case in 2011 and in mostyears between 2011 and now.
Theweekly RSI is still above 70suggesting that even the very initial part of the decline is not yet over. Thisis another reason to think that the current bounce in gold is going to beshort-lived.
TheUSD Index, Correlation Matrix and Gold
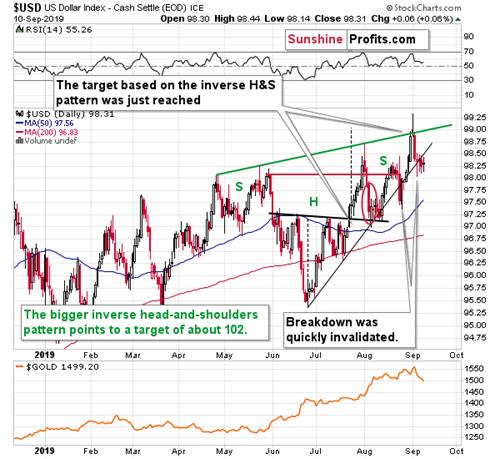
Meanwhile,the USD Index hasn’t done much yesterday, and it was the second daily closebelow the rising support line. This means that the breakdown below it might beconfirmed and USD could decline some more before rallying again.
However,since gold hasn’t moved in tune with the USD Index recently – gold declined onits own – a small move lower in the USDX might not trigger any importantupswings in gold. Let’s take a look at our Correlation Matrix for details.
The correlationcoefficient between gold and the USD Index for the past30 days is 0.25 which is close to 0. This means that there has been barely anycorrelation between the two. In the short run.
Interestingly,in case the very long-term (1500 trading days – about 6 years), the correlationvalues are negative in case of all parts of the precious metals market – gold,silver, HUI Index, and juniormining stocks (as represented by the TSX Venture Index). Thesevalues become more negative on average in case of even more long-term values.What does this imply? That while the short-term moves might be unrelated, goldand the rest of the PM market is very unlikely to ignore a massive long-termmove in the currencymarket.
Andyou know what? Such a move – up – is just around the corner. In fact, it’salready underway, but it’s not clear for everyone that it is indeed the case.
Theabove chart shows that in general, when the USD Index was moving down (between2001 and 2011), gold was moving up, and when it moved up (between 2011 andnow), gold moved down.
Zoomingout allows us to see two more things:
TheUSD Index is after an enormous breakout and the entire 2017-2018 decline wasjust a post-breakout correctionTherewere two major rallies in the USDX – in early 80s and in late 90s.Basedon point 1, we can infer that yet another major long-term rally in the USD isunfolding, and based on point 2, we can infer what gold is likely to do in suchenvironment.
Theellipses mark moments when the USD Index was starting its rally. What happenedin gold? Despite its previous strength, it turned around and declined. And itdidn’t decline for just a week or month – it continued to decline until itsprice was severely lower.
Consequently,while a quick move lower in the USD might not change much, the long-term rallythat is likely to unfold in the following months is very likely to contributeto much lower gold prices.
Beforesummarizing, we would like to once again quote the section with links to mostimportant bearish factors that are currently in play:
Key Factors to Keep in Mind
Criticalfactors:
TheUSD Index broke above the very long-term resistance line and verified thebreakout above it. Its huge upswing is already underway.TheUSD’s long-term upswing is an extremely important and bearish factor for gold. Therewere only two similar cases in the past few decades, when USD Index wasstarting profound, long-term bull markets, and they were both accompanied byhuge declines in gold and the rest of the precious metals marketOutof these two similar cases, only one is very similar - the case when goldtopped in February 1996. Thesimilarity extends beyond gold’s about a yearly delay in reaction to the USD’srally. Also the shape of gold price moves prior to the 1996 high and what we saw inthe last couple of years is very similar, which confirm the analysis of thegold-USD link and the above-mentioned implications of USD Index’s long-termbreakout.Thesimilarity between now and 1996 extends tosilver and mining stocks – in other words, it goes beyond USD, gold-USDlink, and gold itself. The white metal and its miners appear to be in a similarposition as well, and the implications are particularly bearish for the miners.After their 1996 top, they erased more than 2/3rds of their prices.Manyinvestors got excited by the gold-is-soaring theme in the last few months, butlooking beyond the short-term moves, reveals that mostof the precious metals sector didn’t show substantial strength that would be reallyvisible from the long-term perspective. Gold doesn’t appear to be starting anew bull market here, but rather to be an exception from the rule.Gold’sTrue Seasonality around the US Labor Day points to a big decline shortly.Veryimportant, but not as critical factors:
Long-termtechnical signs for silver, i.a. the analogyin terms of price to what we saw in 2008, shows that silvercould slide even below $10.Silver’svery long-term cycles point to a major reversal taking place right now and since the mostrecent move was up, the implications are bearish (this is also silver’stechnical sign, but it’s so important that it deserves its own point)Long-termtechnical signs for gold stocks point to this not being a new gold bull marketbeginning. Among others, it’s their long-term underperformancerelative to gold that hint this is rather a corrective upswing within a bearmarket that is not over yet.Record-breakingweekly volume in gold is a strong sign pointing tolower gold pricesImportantfactors:
Extremevolume reading in the SIL ETF (proxy for silver stocks) is aneffective indication that lower values of silver miners are to be expectedSilver’sshort-term outperformance of gold, and gold stocks’ short-term underperformanceof gold both confirm that the precious metals sector istopping hereGoldtopped almost right at its cyclical turning point, which makes thetrend reversal more likelyCopperbroke below its head-and-shoulders pattern and confirmed the breakdown. The last time we sawsomething similar was in April 2013, when the entire precious metals sector wason the verge of plunging lower.Moreover,please note that while there may be a recession threat, itdoesn’t mean that gold has to rally immediately. Both: recession andgold’s multi-year rally could be many months away – comparingwhat happened to bond yields in the 90s confirms that.
Inparticular, it’s worth keeping in mind the enormous potential of the USD Index.It’s after a major breakout in 2014/2015 and three verifications thereof. The2017-2018 decline which seems huge on its own, was just a verification of amuch bigger (and thus more important) pattern.
Summary
Summingup, the big decline in the precious metals sector appears to be finallyunderway as gold and silver are plunging even without a rallying USD Index. Andthe PMs’ decline started right after the U.S. Labor Day, as we have described.Once the USDX takes off, it will likely serve as fuel to the fire-like declinethat’s already underway. The similarity to mid-90s continues to support muchlower gold prices in the following months, and the True Seasonal patternscontinues to favor lower gold prices in the following weeks. All in all, itseems that what we see right now is the beginning of the final stage of theprolonged decline in the precious metals sector that started in 2011. On ashort-term basis, it seems that we might get some temporary strength once goldmoves to about $1,330 – perhaps within the next few weeks.
Today's article is asmall sample of what our subscribers enjoy on a daily basis. Check more of our free articles on our website, including this one – justdrop by and have a look. Weencourage you to sign up for our daily newsletter, too - it's free and if youdon't like it, you can unsubscribe with just 2 clicks. You'll also get 7 daysof free access to our premium daily Gold & Silver Trading Alerts to get ataste of all our care. On top, you’ll also get 7 days of instant email notifications the momenta new Signal is posted, bringing our Day Trading Signals at your fingertips. Sign up for the free newsletter today!
Thank you.
Przemyslaw Radomski, CFA
Founder, Editor-in-chief
Toolsfor Effective Gold & Silver Investments - SunshineProfits.com
Tools für EffektivesGold- und Silber-Investment - SunshineProfits.DE
* * * * *
About Sunshine Profits
SunshineProfits enables anyone to forecast market changes with a level of accuracy thatwas once only available to closed-door institutions. It provides free trialaccess to its best investment tools (including lists of best gold stocks and best silver stocks),proprietary gold & silver indicators, buy & sell signals, weekly newsletter, and more. Seeing is believing.
Disclaimer
All essays, research and information found aboverepresent analyses and opinions of Przemyslaw Radomski, CFA and SunshineProfits' associates only. As such, it may prove wrong and be a subject tochange without notice. Opinions and analyses were based on data available toauthors of respective essays at the time of writing. Although the informationprovided above is based on careful research and sources that are believed to beaccurate, Przemyslaw Radomski, CFA and his associates do not guarantee theaccuracy or thoroughness of the data or information reported. The opinionspublished above are neither an offer nor a recommendation to purchase or sell anysecurities. Mr. Radomski is not a Registered Securities Advisor. By readingPrzemyslaw Radomski's, CFA reports you fully agree that he will not be heldresponsible or liable for any decisions you make regarding any informationprovided in these reports. Investing, trading and speculation in any financialmarkets may involve high risk of loss. Przemyslaw Radomski, CFA, SunshineProfits' employees and affiliates as well as members of their families may havea short or long position in any securities, including those mentioned in any ofthe reports or essays, and may make additional purchases and/or sales of thosesecurities without notice.
Przemyslaw Radomski Archive |
© 2005-2019 http://www.MarketOracle.co.uk - The Market Oracle is a FREE Daily Financial Markets Analysis & Forecasting online publication.