Gold Begins to Wobble. Is It a Sign of a Greater Fall? / Commodities / Gold and Silver 2022
Gold is still running on thewar-fumes, but its last moves bring to mind only bearish associations. Worseyet, a rising dollar appeared on the horizon.
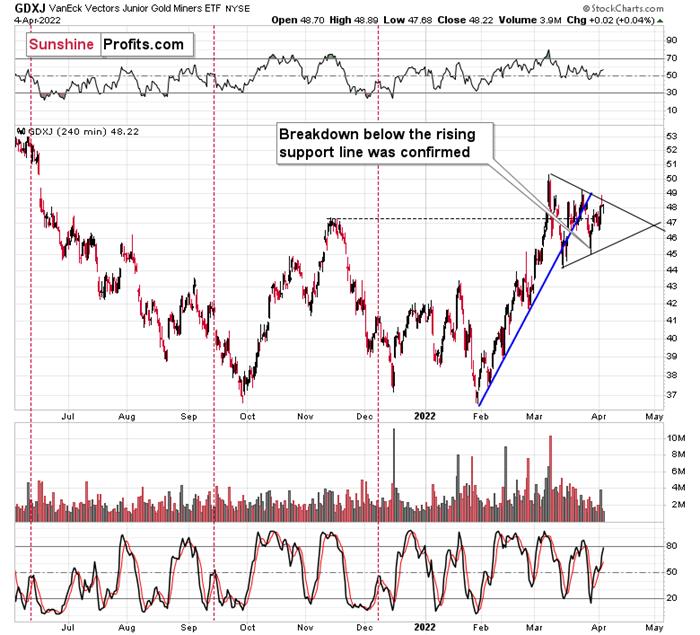
On the technical front, we saw that the juniormining stocks moved higher in the first part of the session, butthen declined and ended the day practically unchanged.

Why did junior miners rally initially?Perhaps for technical reasons. They were moving higher in their immediate-termtrend, and thus, it might have been necessary for them to reach a resistancelevel before they could return to their downtrend.
Junior miners just found the resistancein the form of the declining line based on the previous March highs. After atiny attempt to break above this line, the GDXJ declined and the breakoutwas invalidated, suggesting that the rally is over.
Now, the above-mentioned resistance lineappears to be the upper border of the triangle pattern, which might concern youbecause triangles are usually a “continuation pattern”. In other words, themove that preceded the triangle is usually the type of move that follows it.The preceding move higher was up, so the following move could be to the upsideas well.
However, for this to happen, juniorminers would first need to confirm the breakout above the line, and we saw theopposite taking place yesterday – the breakoutabove the line was invalidated.
If – instead – we see a decline below thelower border of the triangle, the pattern would likely be followed by adecline. Please note that I wrote “usually” and now “always” with regard to thebullish implications of triangles.
If we look beyond the above chart, thebearish case is more justified than the bullish one.
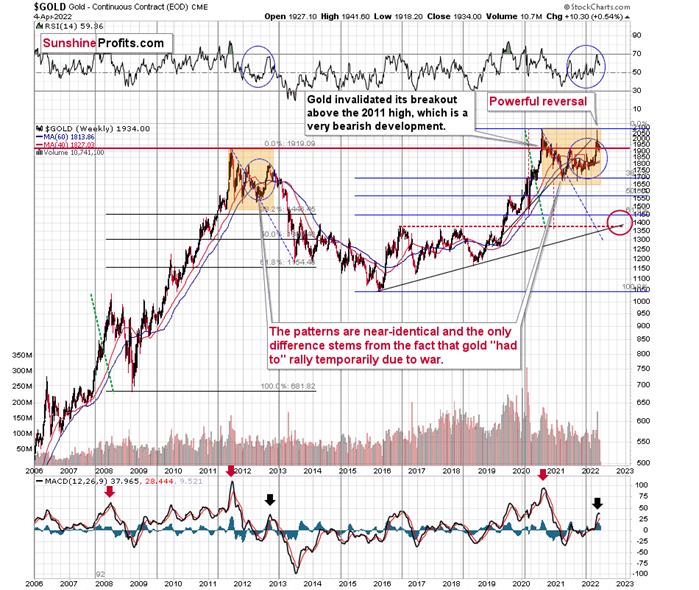
I don’t mean just the extremelybearish situation ingold’s long-term chart, where it’s clear that gold is repeating its2011-2013 performance, with the recent top being analogous to what we saw in2012.

If it wasn’t for theUkraine-war-tension-based rally, gold would have likely topped close to itscurrent levels, which would be a perfect analogy to where it topped in 2012 –close to its preceding medium-term highs.
The fact that theRSI indicator moved lower recently after being close to 70 indicatesthat the top is already behind us.
If history is about to rhyme (and that’svery probable in my view), gold is likely to decline in a back-and-forth mannerbefore it truly slides without looking back. Basically, that’s what we’ve beenseeing recently. The recentconsolidation is not a bullish development, but something in perfect tune withthe extremely bearish pattern from 2012.
I don’t mean “just” the above, because wesee similar analogies insilver and gold stocks (the HUIIndex), and we get other indications (of more short-term nature)from the USD Index and the general stock market.
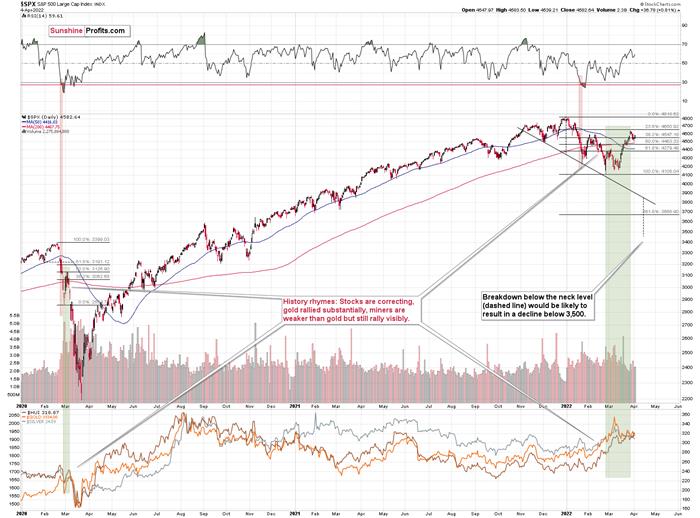
Thetechnical picture of the S&P 500 index suggests that the final top and theinitial corrective upswing are over.

Thegeneral stock market closed the week below its February highs, which means thatthe small breakout above them was invalidated. This is a very bearishindication for the following weeks. Many more investors are likely to becomeaware of the new interest-rate-hike-driven medium-term bear market once the S&P500 breaks to new 2022lows. That’s when the decline is likely to accelerate, quite likely also insilver and mining stocks that are usually most vulnerable to stock marketmoves.
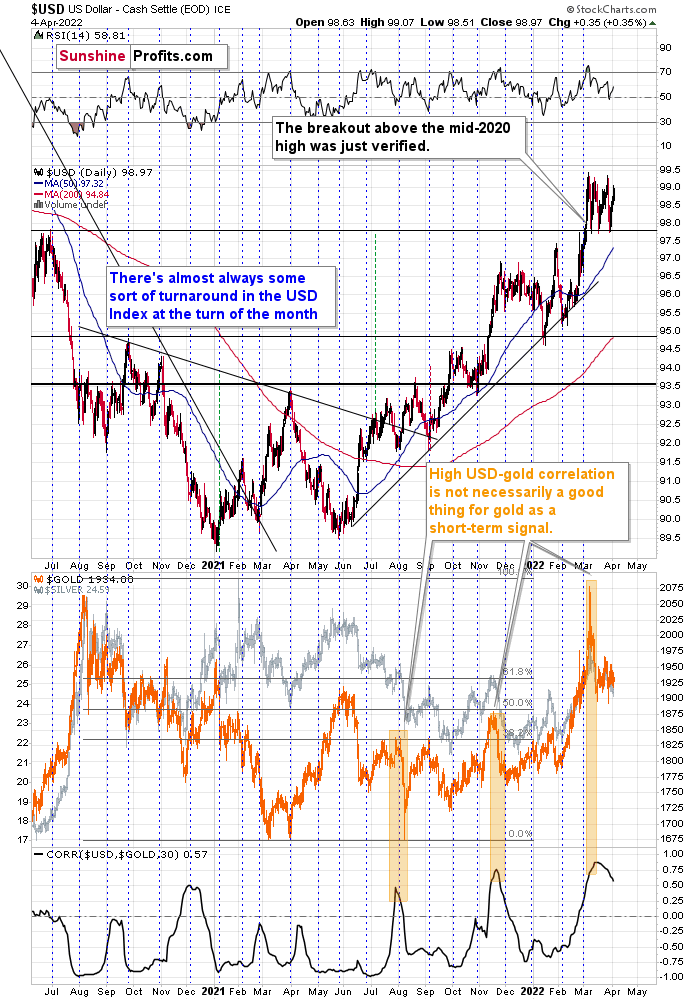
Moreover,let’s keep in mind that the USD Index is likely to soar once again soon, triggeringdeclines in the precious metals market.

Inmy previous analyses, I commented on the USD Index in the following way:
Ifwe focus on the USD Index alone, we’ll see that yesterday’s decline wasabsolutely inconsequential with regard to changing the outlook for the USDX. Itsimply continues to consolidate after a breakout above the mid-2020 highs.Breakout + consolidation = increasing chances of rallies’ continuation. A bigwave up in the USD Index is likely just around the corner, and the preciousmetal sector is likely to decline when it materializes.
Asthe war-based premiums in gold and the USD appear to be waning, ahigh-interest-rate-driven rally in the USD is likely to trigger declines ingold. The correlation between these two assets has started to decline. Whenthat happened during the last two cases (marked with orange), gold plummetedprofoundly shortly thereafter.
The USD Index rallied recently, onceagain clearly verifying the breakout above its mid-2020 high. This means thatthe USD Index is now likely ready to rally once again. Naturally, this hasbearish implications for the precious metals sector.
Allin all, technicals favor a decline in the precious metals sector sooner ratherthan later.
Thank you for reading our free analysistoday. Please note that the above is just a small fraction of today’sall-encompassing Gold & Silver Trading Alert. The latter includes multiplepremium details such as the targets for gold and mining stocks that could be reached in the next few weeks. If you’dlike to read those premium details, we have good news for you. As soon as yousign up for our free gold newsletter, you’ll get a free 7-day no-obligationtrial access to our premium Gold & Silver Trading Alerts. It’s really free– sign up today.
Thank you.
Przemyslaw Radomski, CFA
Founder, Editor-in-chief
Toolsfor Effective Gold & Silver Investments - SunshineProfits.com
Tools für EffektivesGold- und Silber-Investment - SunshineProfits.DE
* * * * *
About Sunshine Profits
SunshineProfits enables anyone to forecast market changes with a level of accuracy thatwas once only available to closed-door institutions. It provides free trialaccess to its best investment tools (including lists of best gold stocks and best silver stocks),proprietary gold & silver indicators, buy & sell signals, weekly newsletter, and more. Seeing is believing.
Disclaimer
All essays, research and information found aboverepresent analyses and opinions of Przemyslaw Radomski, CFA and SunshineProfits' associates only. As such, it may prove wrong and be a subject tochange without notice. Opinions and analyses were based on data available toauthors of respective essays at the time of writing. Although the informationprovided above is based on careful research and sources that are believed to beaccurate, Przemyslaw Radomski, CFA and his associates do not guarantee theaccuracy or thoroughness of the data or information reported. The opinionspublished above are neither an offer nor a recommendation to purchase or sell anysecurities. Mr. Radomski is not a Registered Securities Advisor. By readingPrzemyslaw Radomski's, CFA reports you fully agree that he will not be heldresponsible or liable for any decisions you make regarding any informationprovided in these reports. Investing, trading and speculation in any financialmarkets may involve high risk of loss. Przemyslaw Radomski, CFA, SunshineProfits' employees and affiliates as well as members of their families may havea short or long position in any securities, including those mentioned in any ofthe reports or essays, and may make additional purchases and/or sales of thosesecurities without notice.
Przemyslaw Radomski Archive |
© 2005-2019 http://www.MarketOracle.co.uk - The Market Oracle is a FREE Daily Financial Markets Analysis & Forecasting online publication.
