Gold Bulls: Inside The Bear's Jaw
The high in gold of $1,362.20 completed the pattern into the weekly sell 1 level.
The market closing above the average price means that the market is coming into next week with a neutral to bullish trend momentum.
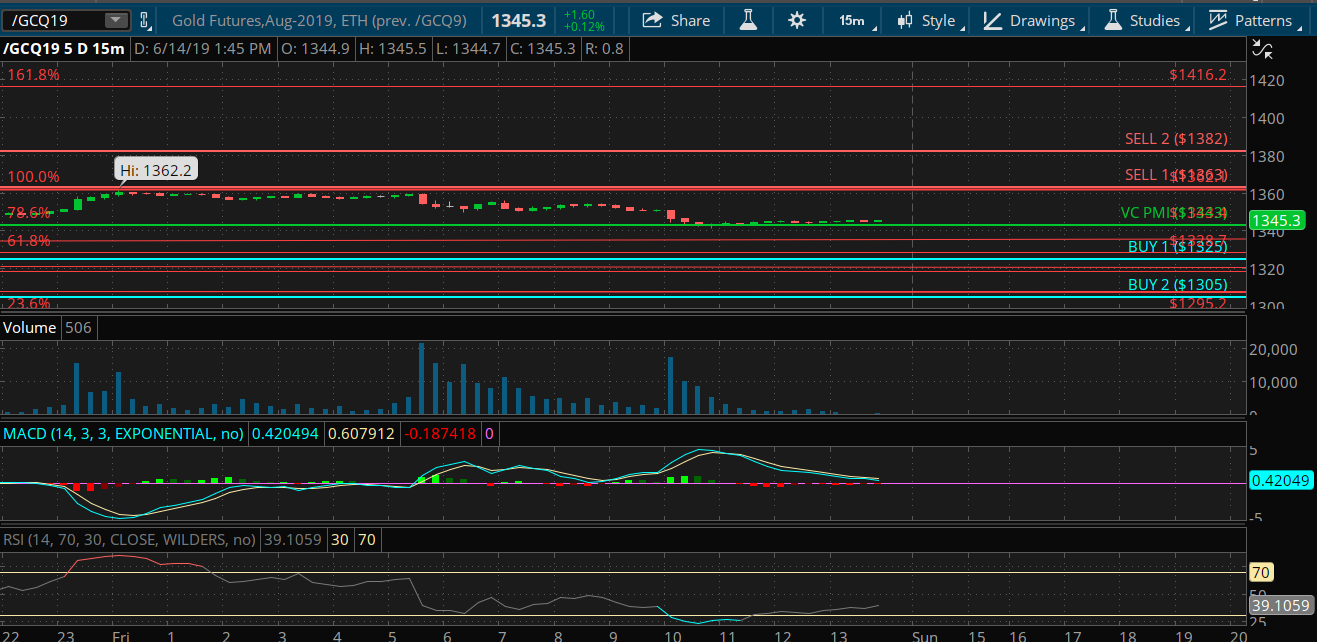
If the market closes below $1,343, it negates the bullishness and activates the buy 1 (B1) level of $1,325 to the buy 2 (B2) level of $1,305.
We used the proprietary Variable Changing Price Momentum Indicator (VC PMI) automated algorithm to analyze the weekly gold market.
Gold
Gold made a new high last week of $1,362.20, which was a 14-month high. It closed Friday at $1,345.30, up about $1.60 for the day. In taking a look at the VC PMI artificial intelligence for the coming week, the average price for gold was identified as $1,343. The sell 1 (S1) level is $1,363. If gold reaches that level, there is a 90% chance that gold will then again revert back to the mean of $1,343.
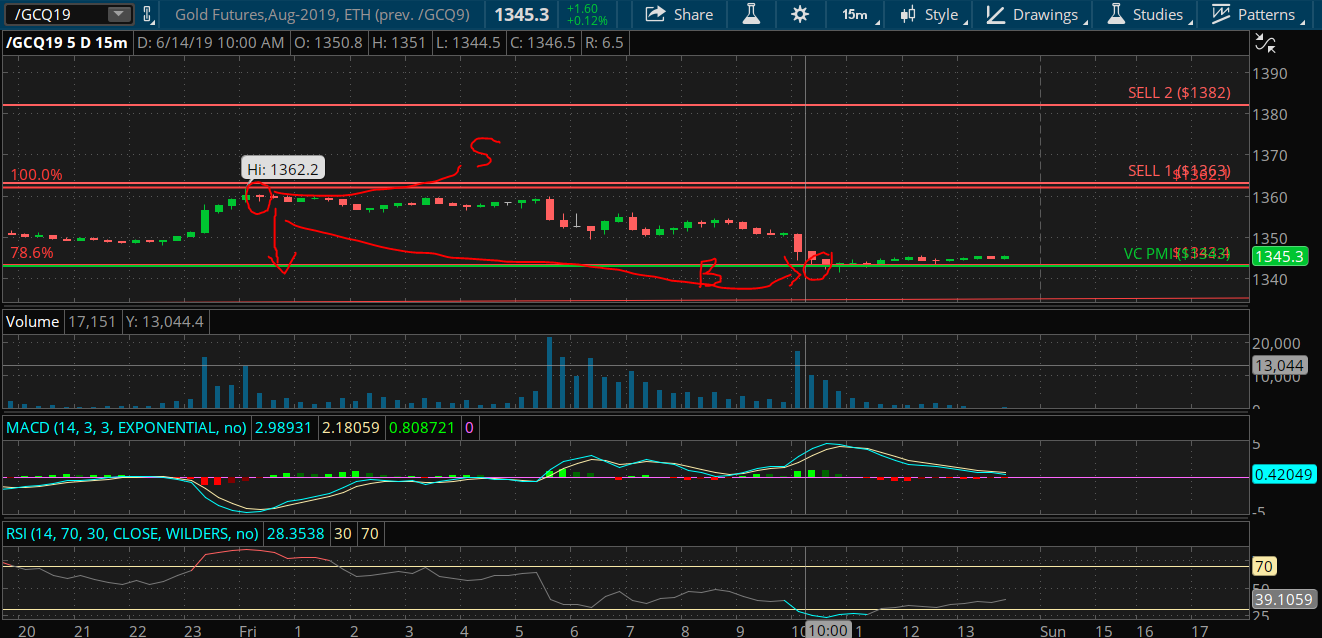
Courtesy: TDAmeritrade
The high last week was $1,362.20. This validated and confirmed the accuracy of the artificial intelligence of the VC PMI. The high of $1,362.20 completed the pattern into the weekly S1 level as posted in Marketplace. Once the target level is completed, the market last week should revert back to the mean. In this case, the high was made at about 12 AM Pacific on Friday. Once the price reaches the target, you go flat or neutral and wait for the next trigger point. The artificial intelligence tells you that if the market closes below the S1 level after completing the structure, it would identify the trigger point. This occurred when the market closed at $1,359.90 after completing the target of $1,362. Automatically when the signal is triggered, it activates the level below as your target. In this case, it automatically activated $1,343 as a target in the report we published last Saturday.
Classic Mean Reversion Trading
"What we see here is a classic, textbook example of mean reversion trading," Equity Management Academy CEO Patrick MontesDeOca said.
This was a profit from $1,362 to $1,343 of about 19 or 20 points or approximately a $2,000 gain, which is more than the average net profit for a day trader. Most day traders look for a couple of points in scalping the market.
Next Week
As we come into next week, we are identifying once again that the average price is $1,343. The market closing above the average price means that the market is coming into next week with a neutral to bullish trend momentum. Therefore, it automatically activates the target above the mean of S1 of $1,363. It also tells you the alternative: If the market closes below $1,343, it automatically negates the bullishness coming into this week and activates the buy 1 (B1) level of $1,325 to the buy 2 (B2) level of $1,305.
The VC PMI Automated Algorithm
We use the proprietary Variable Changing Price Momentum Indicator (VC PMI) to analyze the precious metals markets and several indices. The primary driver of the VC PMI is the principle of reversion to the mean ("Mean Reversion Models of Financial Markets," "The Power of Mean Reversion in Factor-Based Investing"), which is combined with a range of analytical tools, including fundamental logic, wave counts, Fibonacci ratios, Gann principles, supply and demand levels, pivot points, moving averages and momentum indicators. The science of Vedic Mathematics is used to combine these elements into a comprehensive, accurate and highly predictive trading system.
Mean reversion trading seeks to capitalize on extreme changes in the price of a particular security or commodity, based on the assumption that it will revert to its previous state. This theory can be applied to both buying and selling, as it allows a trader to profit on unexpected upswings and buy low when an abnormal low occurs. By identifying the average price (the mean) or price equilibrium based on yesterday's supply and demand factors, we can extrapolate the extreme above this average price and the extreme below it. When prices trade at these extreme levels, it's between 90% (sell 1 or buy 1 level) and 95% (sell 2 or buy 2 level) probable that prices will revert to the mean by the end of the trading session. I use this system to analyze the gold and silver markets.
Strengths And Weaknesses
The main strength of the VC PMI is the ability to identify a specific structure which price levels traders can execute with a high degree of accuracy. The program is flexible enough to adjust to market volatility and alerts you when such changes take place, so one can adjust strategies accordingly. Such changes include when the market breaks out of a consolidation phase or a trend accelerates. Such volatility usually happens when the market has produced a signal at the S2 or B2 level and the market closes above or below these extreme levels.
The day trading program then confirms that a higher fractal in price has been identified and the market will move significantly higher, although the same principle applies if the market falls significantly. The price closing above the S2 level indicates that the buying demand is greater than the supply. This means that the market has found support for the next price fractal. Conversely, the price closing below the B2 level indicates that the selling pressure has met demand greater than supply at the extreme below the mean, and prices should revert back to the mean.
The basic concept of the VC PMI is that the program trades the extremes of supply and demand based on the average price daily, weekly and monthly.
The strongest relationship we find in the algorithm is when the daily price is harmonically in alignment with the weekly and monthly indicators. We call this "harmonic timing." Such an indication produces the highest probability (90%) that the price will revert from these levels to its daily, weekly or monthly average.
To learn more about how the VC PMI works and receive weekly reports on the E-mini, gold and silver, check out our Marketplace service, Mean Reversion Trading.
Disclosure: I am/we are long DUST. I wrote this article myself, and it expresses my own opinions. I am not receiving compensation for it (other than from Seeking Alpha). I have no business relationship with any company whose stock is mentioned in this article.
Follow Equity Management Academy and get email alerts