Gold: Buy Corrections Into Low 1500s
Because gold closed above the average price, the trend momentum was bullish as we came into this week.
It also tells us that if gold closes below $1,520, it would negate this bullish trend momentum, and a second close below $1,520 would activate the levels below.
Gold did close below $1,520, and we came down to the levels that we saw on the 20th into that low $1,500 level.
Gold did not quite come down to $1,493, which was the weekly signal, but it did activate the daily signals at $1,506/7.
In my last Seeking Alpha gold report on August 19, 2019, I said that because the market closed above the average price as we came into the week at $1,520, it activated the sell 1 (S1) target of $1552. I said, if the market reaches $1,552 and closes above it using the 15-minute bar, it activates the $1,579 target. I also said that if the price closes below $1,520, it would activate a bearish trend momentum, negating this bullish trend momentum. The fact that the trend momentum turned bearish would activate the targets of Buy 1 (B1) of $1,493 and the Buy 2 (B2) of $1,461.
A Structure To Trade With
What I am doing here is describing a mathematical structure of probability factors. Nothing that we do with the Variable Changing Price Momentum Indicator is a guarantee. When I mention a probability factor of 90% or 95%, it does not mean I am guaranteeing the trade. It is a probability factor, just as the weatherman says a 90% chance of rain. It still might not rain 10% chance. We use an algorithm to identify the average price and then it gives us the extreme levels above and below that average price, where traders have the highest probabilities of profitable trades. The algorithm provides the mean and then two levels above and two below the mean in a perfect Fibonacci structure. The results of the price action activate these pivot levels, which then trigger a setup. The artificial intelligence then tells you, based on the 15-minute bar, if the market closes above, it's a buy trigger; if it closes below, it's a sell signal. It also identifies stops for you above and below, depending on your position.
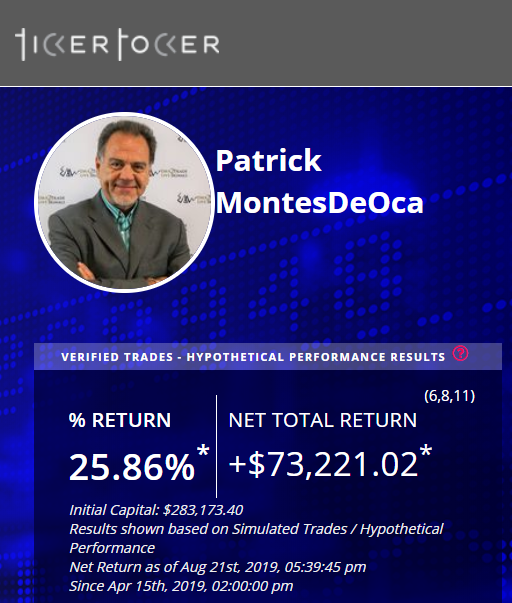
"It is not a guaranteed trade," Equity Management Academy CEO Patrick MontesDeOca stressed.
I frequently hear comments of various opinions, and I respect those opinions, but, hopefully, everyone else should respect my opinion. Not everyone is a day, swing, long-term, fundamental or technical trader. There are all kinds of traders. It does not mean that you have to follow exclusively what I say. If you don't understand, I urge you to ask us. We are always glad to answer questions.
For the past few months, MontesDeOca has been executing this VC PMI algorithm which is a completely independent third-party platform and serves to verify our trades based on the VC PMI. On Seeking Alpha, we are sharing some of the information we are using to trade on TickerTocker using the VC PMI. The trades based on the VC PMI on TickerTocker is up more than 25% over the past four months, up more than $73,000 in profits, verified by a third-party independently.
Looking Ahead
Since our last gold report on August 19, had the average price at $1520. Because gold closed above the average price, the trend momentum was bullish as we came into this week. It also tells us that if gold closes below $1,520, it would negate this bullish trend momentum, and a second close below $1,520 would activate the levels below. This week, gold did close below $1,520 and we came down to the levels that we saw on the 20th into that low $1,500 level. We did not quite come down to $1,493, which was the weekly signal but activating the daily signals at $1,506/7, which we shared in our private elite trading room with our paid subscribers. This is the daily confidential information that we share the night before each trading day, so our subscribers are prepared the night before to watch the market and see what the market will do in relation to the pivot points. We provide a structure, so our subscribers are prepared to execute when they sit down at their computers.
The VC PMI Automated Algorithm
We use the proprietary Variable Changing Price Momentum Indicator (VC PMI) to analyze the precious metals markets and several indices. The primary driver of the VC PMI is the principle of reversion to the mean ("Mean Reversion Models of Financial Markets," "The Power of Mean Reversion in Factor- Based Investing"), which is combined with a range of analytical tools, including fundamental logic, wave counts, Fibonacci ratios, Gann principles, supply and demand levels, pivot points, moving averages, and momentum indicators. The science of Vedic mathematics is used to combine these elements into a comprehensive, accurate, and highly predictive trading system.
Mean reversion trading seeks to capitalize on extreme changes in the price of a particular security or commodity, based on the assumption that it will revert to its previous state. This theory can be applied to both buying and selling, as it allows a trader to profit on unexpected upswings and buy low when an abnormal low occurs. By identifying the average price (the mean) or price equilibrium based on yesterday's supply and demand factors, we can extrapolate the extreme above this average price and the extreme below it. When prices trade at these extreme levels, it's between 90% (sell 1 or buy 1 level) and 95% (sell 2 or buy 2 level) probable that prices will revert to the mean by the end of the trading session. I use this system to analyze the gold and silver markets.
Strengths And Weaknesses
The main strength of the VC PMI is the ability to identify a specific structure which price level traders can execute with a high degree of accuracy. The program is flexible enough to adjust to market volatility and alerts you when such changes take place, so one can adjust strategies accordingly. Such changes include when the market breaks out of a consolidation phase or a trend accelerates. Such volatility usually happens when the market has produced a signal at the S2 or B2 level, and the market closes above or below these extreme levels.
The day trading program then confirms that a higher fractal in price has been identified, and the market will move significantly higher, although the same principle applies if the market falls significantly. The price closing above the S2 level indicates that the buying demand is greater than the supply. This means that the market has found support for the next price fractal. Conversely, the price closing below the B2 level indicates that the selling pressure has met demand greater than supply at the extreme below the mean, and prices should revert back to the mean.
The basic concept of the VC PMI is that the program trades the extremes of supply and demand based on the average price daily, weekly, and monthly.
The strongest relationship we find in the algorithm is when the daily price is harmonically in alignment with the weekly and monthly indicators. We call this "harmonic timing." Such an indication produces the highest probability (90%) that the price will revert from these levels to its daily, weekly, or monthly average.
To learn more about how the VC PMI works and receive weekly reports on the E-mini, gold, and silver, check out our Marketplace service, Mean Reversion Trading.
Disclosure: I am/we are long NUGT. I wrote this article myself, and it expresses my own opinions. I am not receiving compensation for it (other than from Seeking Alpha). I have no business relationship with any company whose stock is mentioned in this article.
Follow Equity Management Academy and get email alerts