Gold Clearly Reverses at Consolidation's Upper Border / Commodities / Gold & Silver 2019

 Quitea few journalists wrote about gold’s breakout in the previous days even thoughgold made an attempt to break above the key resistance – the mid-2013 high –only today (and it failed). At the same time, when the gold to silver ratio wasbreaking out in a clear way, many journalists ignored that and emphasized theimportance of the resistance at hand. Either way, the focus was not on what wasreally going on, but on trying to make the reality fit the bullish case forgold. After all, “gold people” have to be bullish on gold all the time, right?Wrong – those, who want their clients to succeed need to stay focused on whatis likely to happen based on objective, cold logic and facts, instead of chasingthe emotions of the day. And what do the facts tell us?
Wehave a twofold purpose in highlighting the pitfalls of permabullishemotionality. The first one is to show you how acting on emotions in investingbackfires – goldrallied temporarily above $1,440 and in today’s pre-market trading, declined to almost$1,400. And it doesn’t seem that the decline is over. The second one is that wewant to emphasize that there is almost nobody else in the gold analysisbusiness that saw that the real resistance and the upper border of thelong-term consolidation pattern in gold is at the mid-2013 highs. Many otherscheered as gold moved above the previous – less important – highs, and theywrote about a major breakout in gold. These were breakouts, but not the keyones and nothing to call home about given that the highest of the relativelyclose highs remained unbroken. Please remember the above as gold moves to lowerprices. Please also remember that we are writing right now that we will seegold below $1,200 well before we’ll see it above $1,500.
Let’ssee what happened on the precious metals market, starting with something…beautiful.
MarvelousFractal Lessons
Doyou remember how gold topped in 2011? Do you recall its immediate and sharpdecline followed by a correction that hasn’t made it to the previous high, andthen – after a few months of pausing – making a final attempt to move higherbut failing to break above the most recent high? And then, in April 2013, ittruly plunged, which was immediately followed by a sharp correction and thenthe slide continued to new lows?
Ifyou’ve been interested in the precious metals market at that time, youdefinitely remember – it was impossible to miss these moves.
Thebeautiful thing here is that… The above chart doesn’t feature it. These are notweekly or monthly candlesticks. These are 30-minute candlesticks and what yousee above is what gold did in the last two days or so. You probably thoughtthat it was gold’s performance from 2013, because the price pattern is almostidentical. Please take a look below for details.
Entirelydifferent time frames, entirely different candlestick length, and yet, thepattern repeated itself almost to the letter. The fractal near-perfection.
Wedetected it during yesterday’s session, but since it simply confirmed what wewrote in our regular Gold& Silver Trading Alert, we didn’t send an intraday follow-up. Whatdoes it mean going forward?
Thesimilarity is likely to persist for some time. Unfortunately, we don’t know forhow long it’s going to be the case, but it’s definitely likely to remain inplace for a day or two. Given the current volatility, a day or two can changequite a lot, so the above is important. What happened after the 2013 slide?Gold entered a few-years-long consolidation. Applying it to this week’s terms,it means that we could see some back and forth trading today or tomorrow. Thiscould be accompanied by another move lower in the USD Index, during which itreaches its 61.8% Fibonacci retracement level. Or it could be more or lessrandom, or Twitter-politics based.
Whatthe above doesn’t tell us is what happens after the one- or two-dayconsolidation, and if gold is done declining in case of this immediate-termmove. The volatility has been extraordinary recently, which means that goldcould slide some more before today’s daily bottom is reached. It might be thecase that gold slides below $1,400 and then consolidates. This would completethe analogy to the long-term price pattern.
Andthis is where things are likely to get really interesting. You see, thefractal similarity works both ways. Gold’s small (it could be just severalhours) consolidation and a daily close below $1,400 could result in a powerfulslide in the following hours (possibly tomorrow). Yesterday, we mentioned thisweek being critical, as it’s where we’ll get also the monthly and quarterlyclosing prices, which are paramount. This means that if the bearish pictureremains intact, we should see a decline before the end of the week and that’smore or less what we’re getting right now. Let’s move back to the similarity.If gold plunges in the following days and weeks, it will also indicate whatgold is about to do from the long-term point of view – in the following months.Please assess gold’s performance with regard to the overall volatility – itshould provide a taste of what’s to come (multiplied many times in terms ofprice and time).
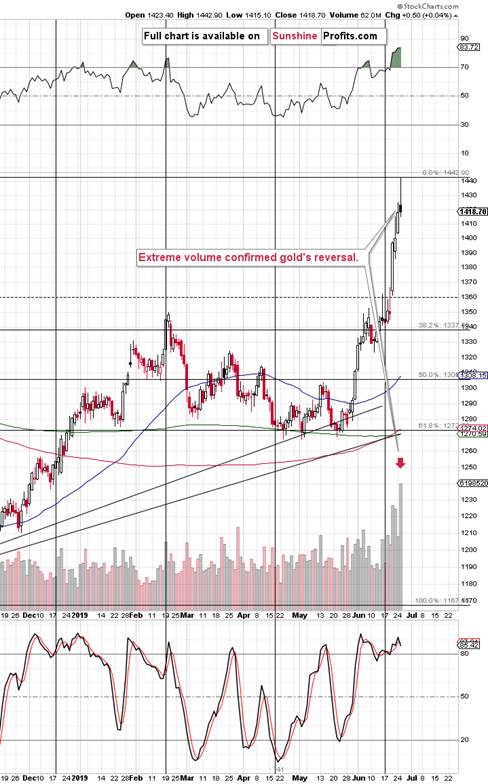
Asfar as the daily chart is concerned, we saw a near-perfect goldshooting star reversal. The critical thing to look for during these reversals is volume. Weshould see the fierce battle between bulls and bears, leaving the bullsoverpowered. Low volume means that the battle was not fierce, or that there wasvery little fighting done on a given day. The implications would likely benonexistent. But, that’s not what happened yesterday. We saw the highest volumeof 2019. And it happened while RSI was not only above 70, but above 80. And ithappened at the combination of three vertex-based-reversals. It really doesn’tget any more bearish than that – it’s a classic beginners-gold-trading-guide combination ofbearish signals that should be obvious to everyone.
WhatAbout Silver?
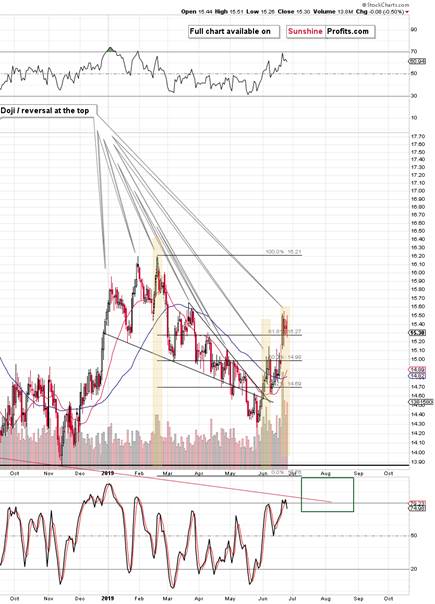
Silvertopped in a classic manner – it moved higher on extremely high volume, whileoutperforming gold at the top. It then refused to follow gold higher, but thekey thing remains that there was a time during which the silver marketoutperformed – this was the true top.
Theyellow rectangles on the above chart mark the situations in which silver soaredon huge volume. They were all tops, but the early June case was just a local,not the final top. The size of the volume that we saw recently suggests thatthere will be no additional attempt to move higher anytime soon and that thiswas indeed the final high.
TheRSI moved to 70, additionally confirming that the top is indeed in.
Summary
Summingup, the gold-silver ratio, silver itself, gold stocks to gold ratio, the sizeof the upswing in the gold stocks, and the situation in the USD Index, and gold’sinvalidation of the breakout above the mid-2013 high all suggest that themost recent move higher in the precious metals sector is nothing more than justa corrective upswing within a bigger trend. It is only the gold price itselfthat can make one wonder if gold has truly broken out and that it will nowcontinue to soar. This is doubtful, because this strength is not confirmed, asit happened right after a series of rather chaotic and surprising news. Addingextremely positive sentiment as confirmed by volume across the precious metalsboard and the very strong triple vertex-based reversal indication, makes theoutlook for gold much less bullish that everyone and their brother would haveyou believe. Please note that we are not “married” to the bearish outlook forgold and we will return to viewing the medium-term outlook as bullish, but notuntil the cold analytical facts suggest that the tables have indeed turned.This is not the case right now – please take a look at today’s charts fordetails. In particular, it’s a bad idea to adjust one’s outlook just becausemany people got excited. The excitement itself is a sign of a turnaround, notsomething to take at face value.
Today'sarticle is a small sample of what our subscribers enjoy on a daily basis. Theyknow about both the market changes and our trading position changes exactlywhen they happen. Apart from the above, we've also shared with them thedetailed analysis of the miners and the USD Index outlook as they both carrynumerous implications for the PMs market.. Check more of our free articles on our website, including this one – justdrop by and have a look. Weencourage you to sign up for our daily newsletter, too - it's free and if youdon't like it, you can unsubscribe with just 2 clicks. You'll also get 7 daysof free access to our premium daily Gold & Silver Trading Alerts to get ataste of all our care. Signup for the free newsletter today!
Thank you.
Przemyslaw Radomski, CFA
Founder, Editor-in-chief
Toolsfor Effective Gold & Silver Investments - SunshineProfits.com
Tools für EffektivesGold- und Silber-Investment - SunshineProfits.DE
* * * * *
About Sunshine Profits
SunshineProfits enables anyone to forecast market changes with a level of accuracy thatwas once only available to closed-door institutions. It provides free trialaccess to its best investment tools (including lists of best gold stocks and best silver stocks),proprietary gold & silver indicators, buy & sell signals, weekly newsletter, and more. Seeing is believing.
Disclaimer
All essays, research and information found aboverepresent analyses and opinions of Przemyslaw Radomski, CFA and SunshineProfits' associates only. As such, it may prove wrong and be a subject tochange without notice. Opinions and analyses were based on data available toauthors of respective essays at the time of writing. Although the informationprovided above is based on careful research and sources that are believed to beaccurate, Przemyslaw Radomski, CFA and his associates do not guarantee theaccuracy or thoroughness of the data or information reported. The opinionspublished above are neither an offer nor a recommendation to purchase or sell anysecurities. Mr. Radomski is not a Registered Securities Advisor. By readingPrzemyslaw Radomski's, CFA reports you fully agree that he will not be heldresponsible or liable for any decisions you make regarding any informationprovided in these reports. Investing, trading and speculation in any financialmarkets may involve high risk of loss. Przemyslaw Radomski, CFA, SunshineProfits' employees and affiliates as well as members of their families may havea short or long position in any securities, including those mentioned in any ofthe reports or essays, and may make additional purchases and/or sales of thosesecurities without notice.
Przemyslaw Radomski Archive |
© 2005-2019 http://www.MarketOracle.co.uk - The Market Oracle is a FREE Daily Financial Markets Analysis & Forecasting online publication.