Gold Continues The Pattern
Gold, like all markets, displays repetitive patterns in its price history.
We present two patterns, one from 2000 and another from 2013.
If these patterns continue to replicate, then gold should drop into the $1,225-$1,250 area before bouncing.
We present patterns in the price history of the gold market that seem to be replicating in real time. If these similar patterns continue to replicate, then gold will continue to fall, but is unlikely to fall below $1,225 before bouncing higher.
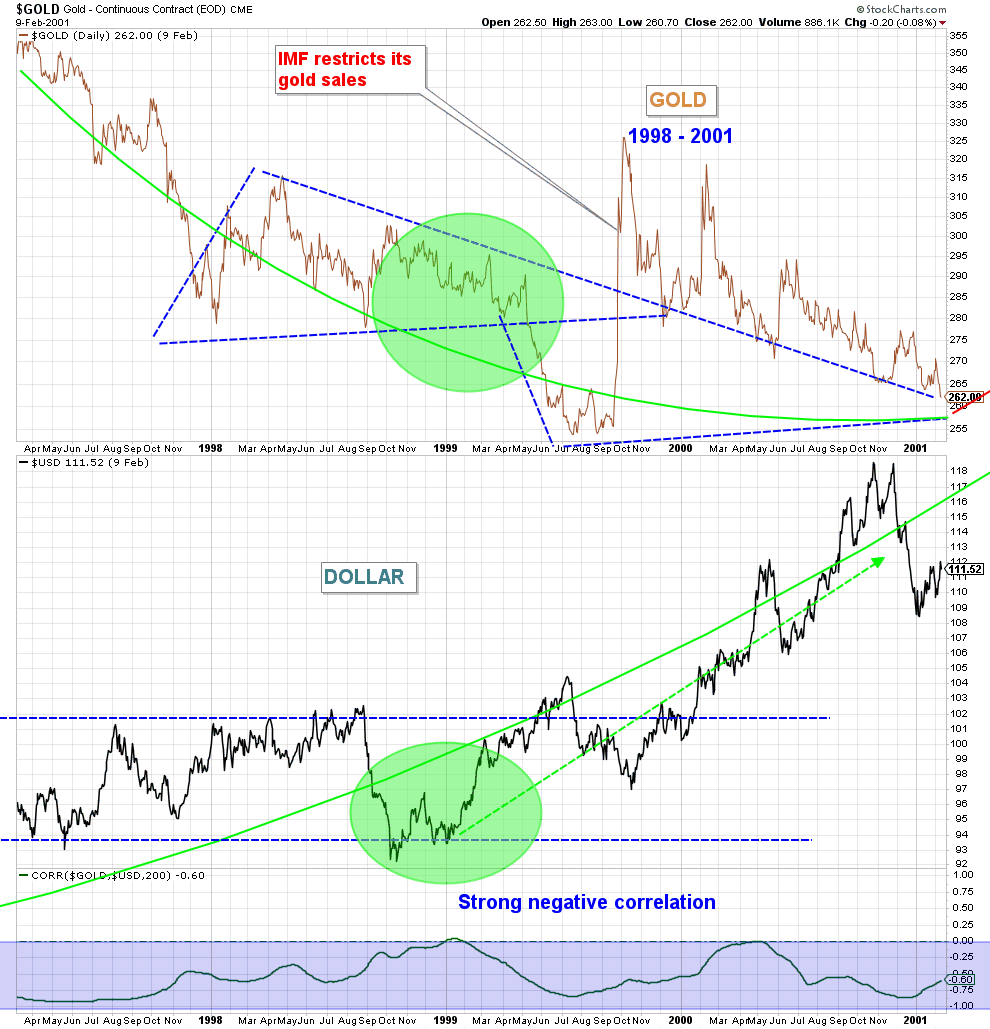
Gold has a strong inverse-correlation with the dollar. There's a pattern forming that's similar to the trading in 2000 - both then and now, the dollar was in a trading range and gold was trading within a pennant formation (chart below).
 Source: ANG Traders, StockCharts
In 1999, as the dollar broke out of its trading range, gold dropped out of its pennant formation. If the IMF had not restricted its gold sales, gold would have likely fallen to much lower prices (chart below).
 Source: ANG Traders, StockCharts
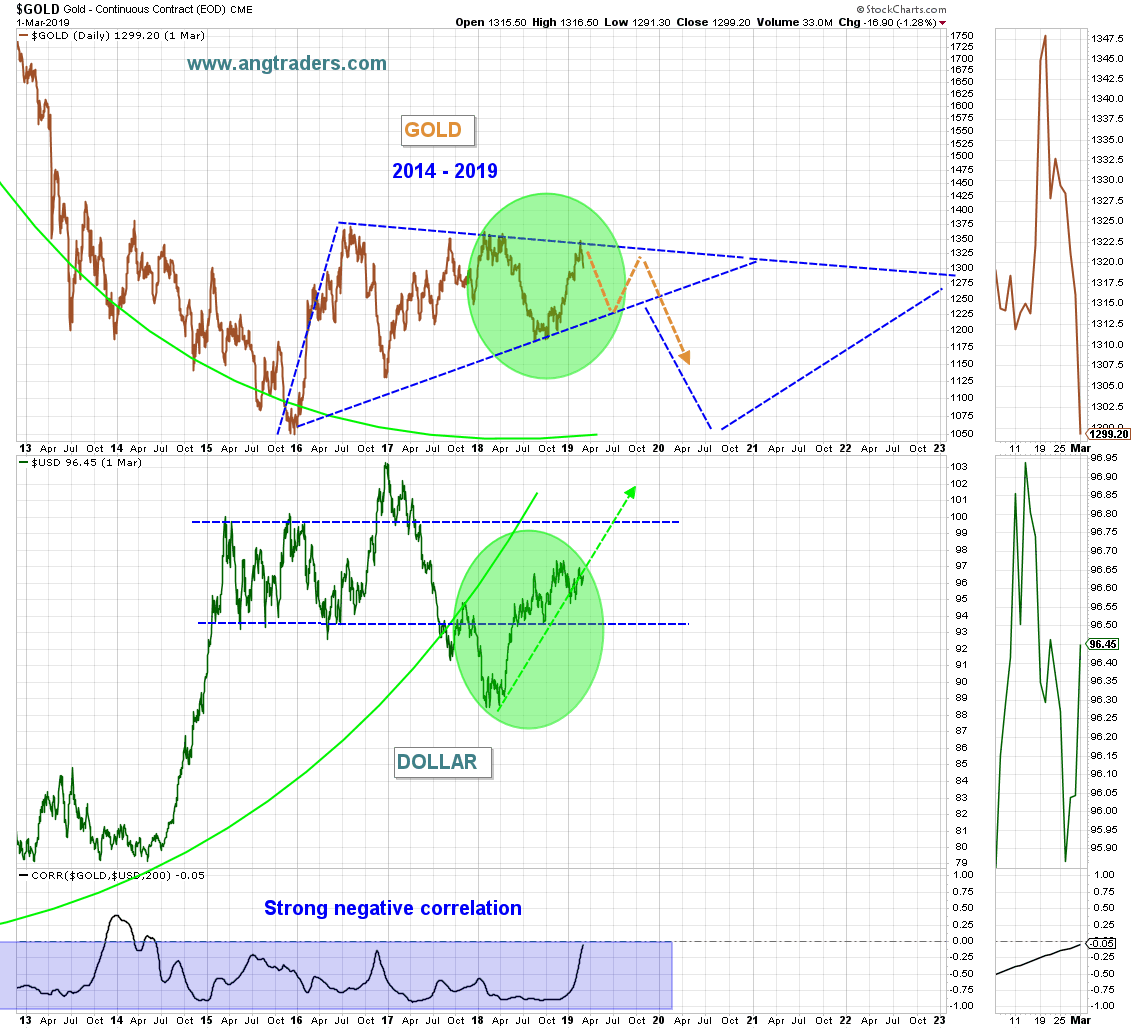
This time around, the IMF is unlikely to interfere in the market like it did in 1999, which means that when gold drops out of the pennant formation, it could be a seriously deep dive. However, the pattern similarity implies that gold is likely to "ping pong" inside the pennant formation before falling out of it (chart below).
 Source: ANG Traders, StockCharts
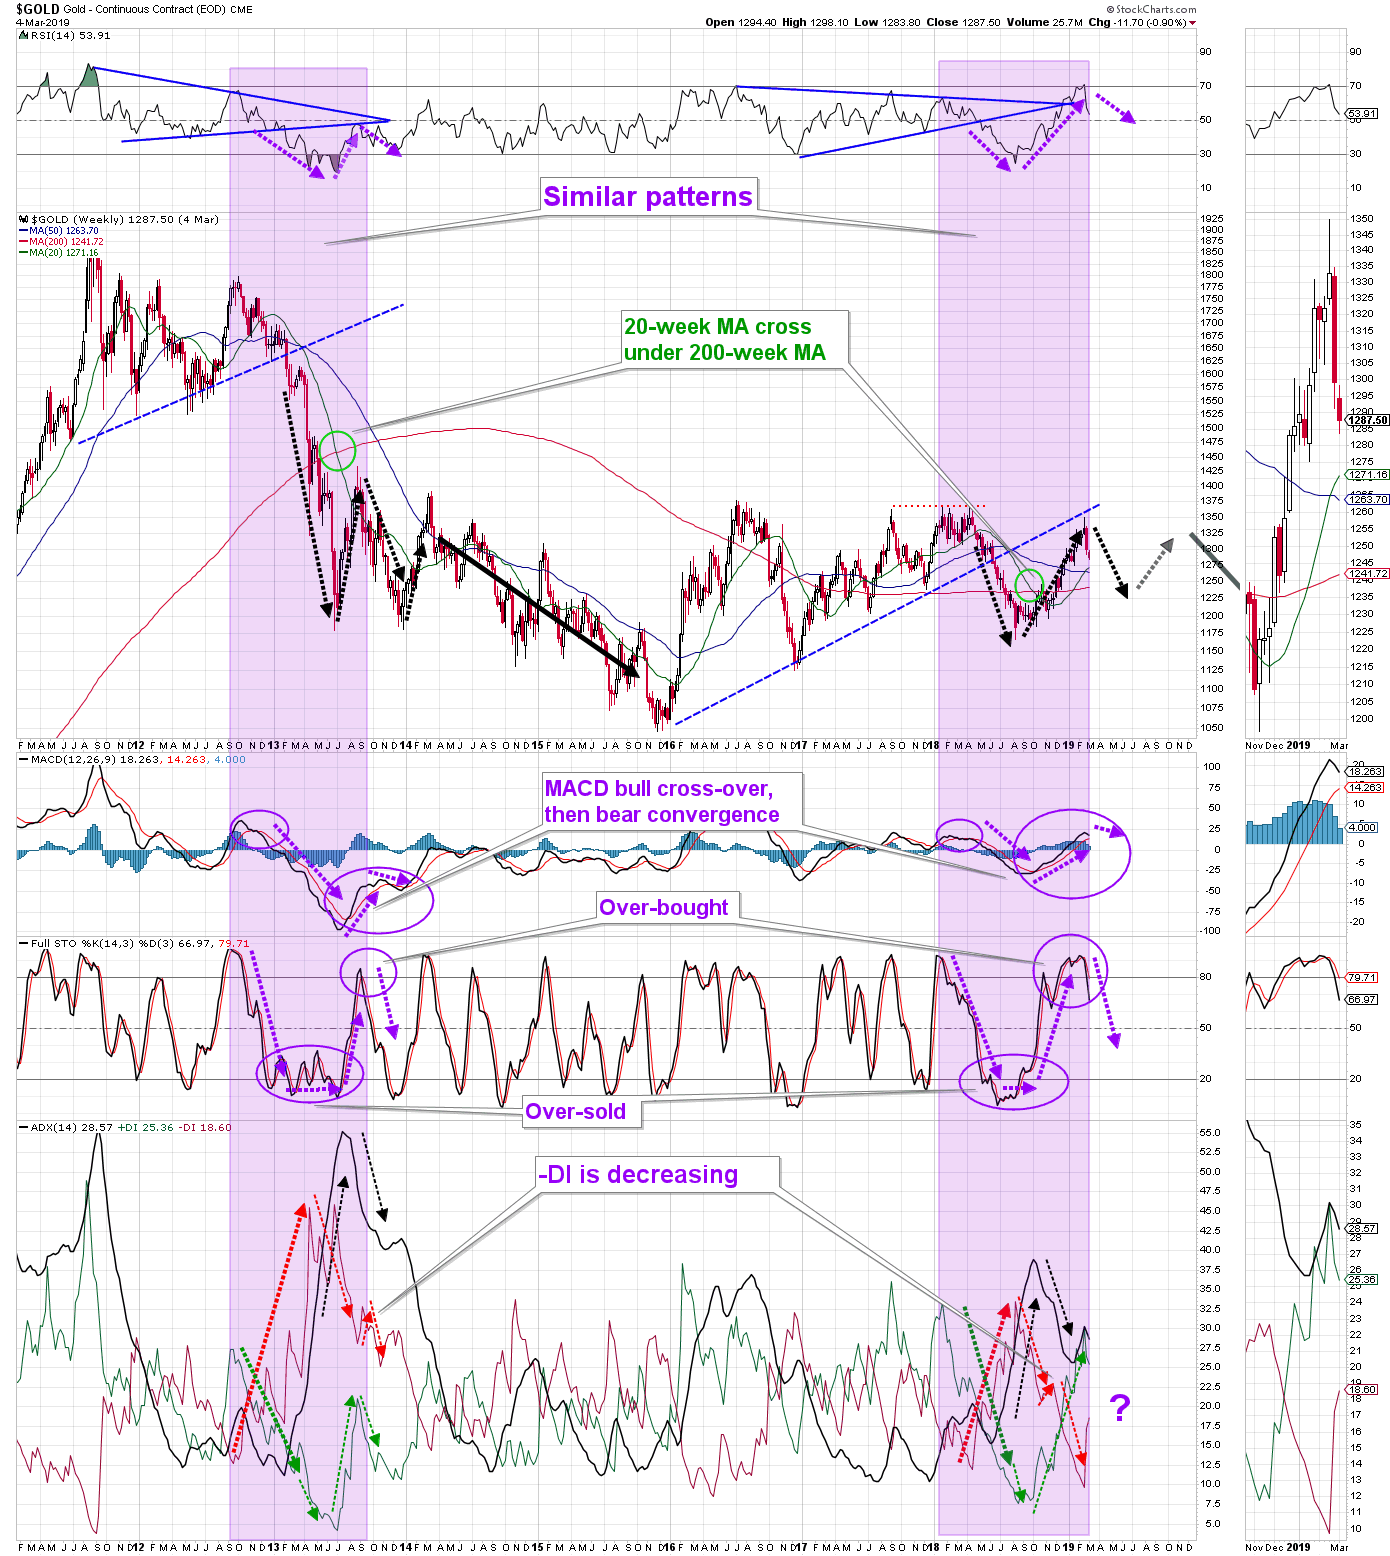
Gold also is replicating a pattern from 2013 that started with breach of the short-term trendline and the 20-week MA crossing over the 200-week MA. The purple highlighted areas on the chart below show the similar patterns of the RSI, MACD, Stochastic, and ADX. If the pattern continues to replicate, then we expect gold to drop to the $1,225-$1,250 zone before bouncing higher (chart below).
 Source: ANG Traders, StockCharts
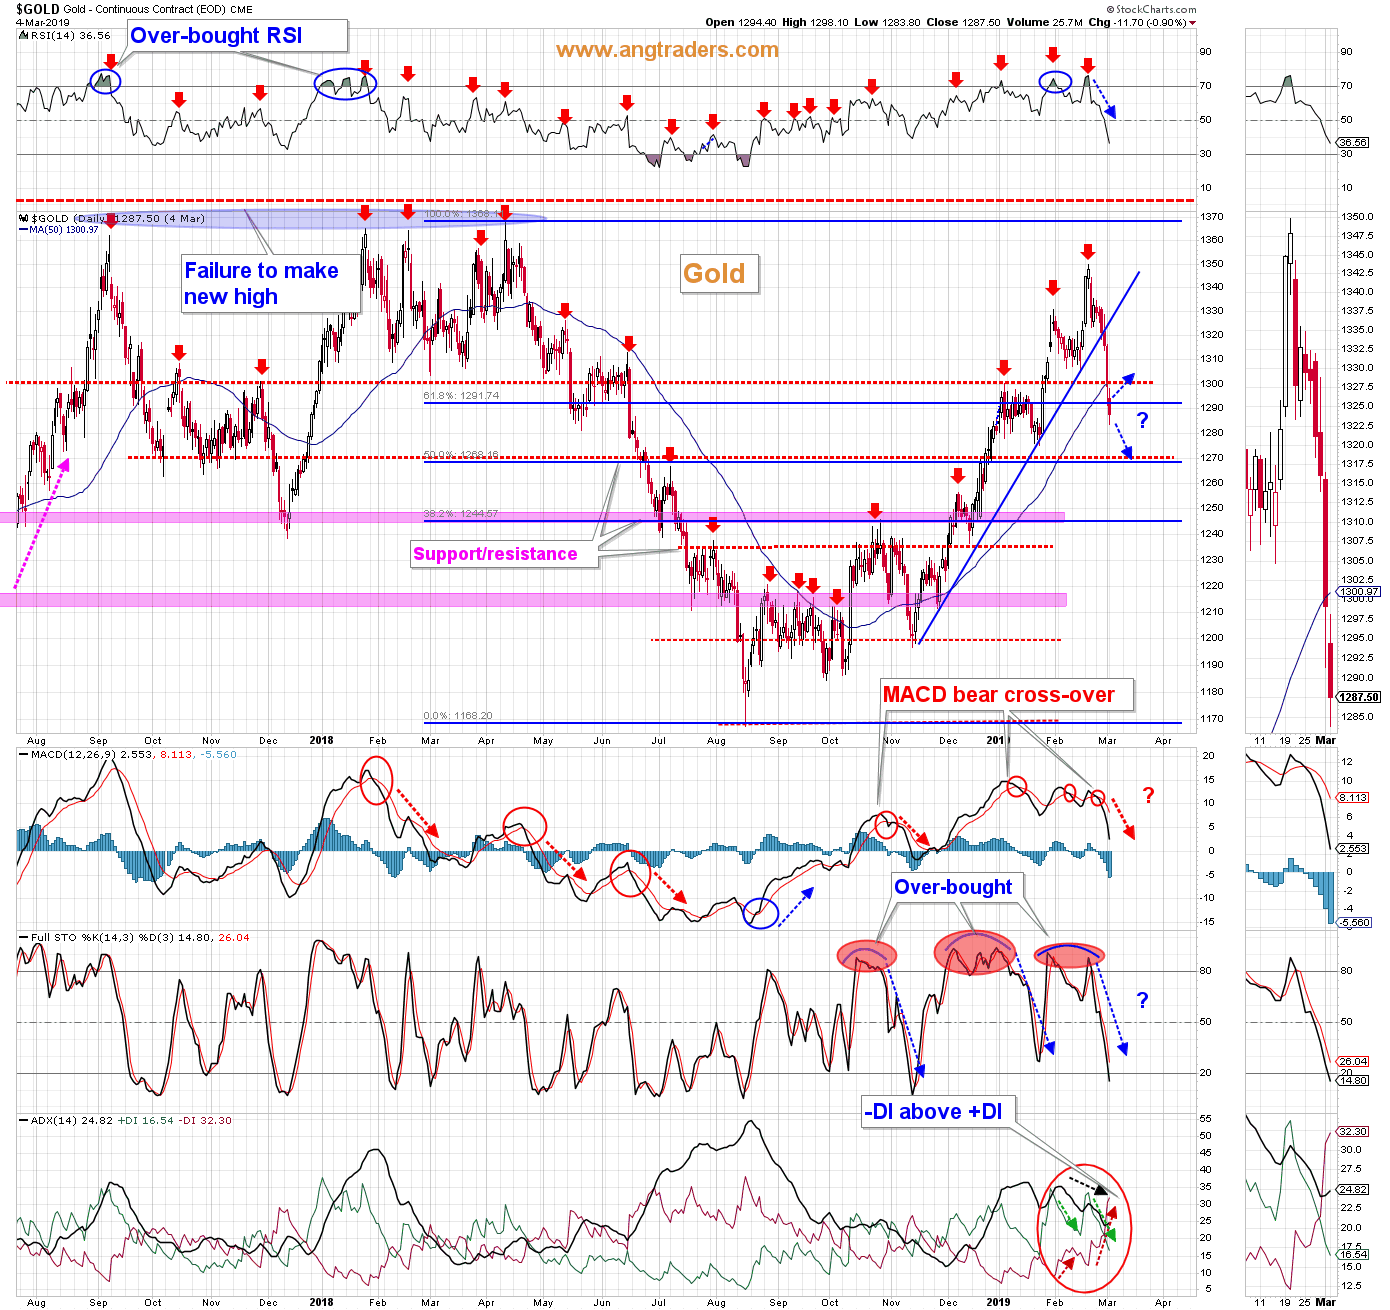
Gold's technical situation has deteriorated at this point:
The RSI has accelerated its fall from overbought levels The MACD has made a bear cross-over and followed through The stochastic has dropped away from over-bought The -DI has crossed above the +DIGold bounced off the 62% Fibonacci retrace of last year's April to August decline, but was turned back at the $1,350 level, crashing through the sort-term trend-line, the 50-day MA, the $1,300 psychological level, and the 62% Fib retrade level. The next support is in the $1,270-$1,280 zone which includes the 50% Fib retrace level. After that, there's resistance at $1,245 which is the 38% Fib retrace and which is within the $1225-$1250 zone mentioned above (chart below).
 Source: ANG Traders, StockCharts
In conclusion, we think gold will continue to drop until the $1,225-$1,250 price zone before it rallies to test the short-term trendline and the upper boundary of the longer-term pennant formation.
What our subscribers are saying:
" I find tremendous value in your work. What got me here initially was the book 'Trading Against the Crowd' which examined sentiment and put-call ratios to show sentiment extremes, as soon as I found you and saw you used similar methodology I knew you were onto something. Your subscription service is top notch. "
"I definitely find value in your work, I will be a client for a long time barring death."
We invite you to take advantage of our 20% discount and 14-day free trial and let us keep you on the right side of the market and Away From the Herd.
Disclosure: I/we have no positions in any stocks mentioned, and no plans to initiate any positions within the next 72 hours. I wrote this article myself, and it expresses my own opinions. I am not receiving compensation for it (other than from Seeking Alpha). I have no business relationship with any company whose stock is mentioned in this article.
Follow ANG Traders and get email alerts