Gold Correction - How Low Can The Yellow Metal Go?
A new high leads to selling.
The short-term technical position improved.
The long-term picture looks good.
Three reasons for higher gold.
Turbocharged products on dips.
In mid-August 2018, a new high in the dollar index took the price of gold to its lowest price since early 2017 at $1161.40 per ounce. Gold did not stay at that level for long, and by the end of August, the price had recovered to over $1200.
One of the most impressive signs for the gold market since mid-August is that the dollar index continued to make higher highs with the latest coming in mid-December and the yellow metal never revisited or came even close to the August bottom. Gold has been trending higher in dollar, euros, and yen which is a sign of a global bull market in the yellow metal. At the same time, central banks continue to be net buyers adding to their reserves. I never read too much into central bank buying or selling in the gold market. After all, the United Kingdom sold half of its reserves of the yellow metal at the turn of this century at an average price that was below $300 per ounce. However, the purchases have provided an element of support to the price.
Gold has been in a bullish trend over the past six months with the latest new peak coming on February 20.
Over recent sessions, the price of gold has pulled back from the February 20 peak. Now could be the perfect time to consider a turbocharged product like the Velocity Shares 3X Long Gold ETN (UGLD).
A new high leads to selling
After reaching a new high at $1344 on the continuous COMEX futures contract on February 20, the price of gold turned lower. 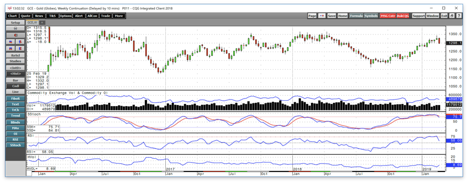
Source: CQG
As the weekly chart highlights, the yellow metal fell over $45 from the high as both price momentum and relative strength moved into overbought territory and crossed lower last Friday. Markets rarely move in a straight line, and it is possible that the latest price action will turn out to be healthy for the market over the coming days and weeks.
The short-term technical position improved
The daily chart shows that the corrective price action is washing some of the weaker longs out of the gold futures market. 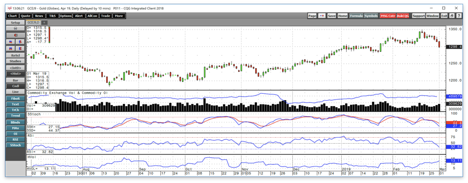
Source: CQG
The daily chart illustrates that the price momentum and relative strength metrics have returned to neutral readings over recent sessions and are falling towards oversold territory in the aftermath of the selling last Friday. Open interest, the total number of open long and short positions in the COMEX gold futures market declined from 537,605 contracts at the end of January when gold was on its way to the recent high to 489,879 contracts as of February 28 in a sign that 47,726 contracts of positions exited the market over the past month. Some longs likely took profits, and others decided to close risk as February futures rolled to April at the end of January. At under 490,000 contracts, the gold market is not overly long or short at the current price level. The rise in daily historical volatility from under 6% in mid-February to 13% reflects the recent price action as gold tends to take the stairs higher and the elevator to the downside.
The current level of technical support stands at the January 22 low at $1282.10 on the April futures contract. Below there, the mid-December low at $1242.50 is the next level of support.
The long-term picture looks good
Gold has been shining since mid-August which shifted the monthly chart to a bullish trend. 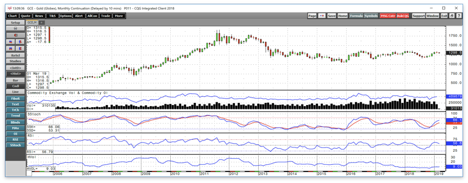
Source: CQG
The monthly chart shows that price momentum and relative strength continues to point to higher prices. Gold posted gains in four of the past five months, with only a marginal small loss in February. At the same time, open interest has moved higher with the price since November. In a futures market, rising price alongside increasing open interest tends to be a validation of a bullish trend. 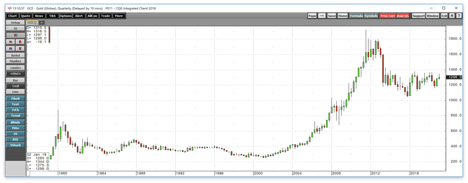
Source: CQG
The quarterly chart shows that gold has been working its way towards two levels of technical resistance on the upside. The first level stands at $1365.40 per ounce which is the double top formation at the 2018 high that came in January and April. Above there, the July 2016 peak and line in the sand that could launch gold significantly higher stands at $1377.50 per ounce. On the quarterly change, technical support is at the mid-August 2018 low at $1161.40, so the price is still closer to resistance than support as of the end of last week.
Three reasons for higher gold
Many factors support a continuation of the rally in gold. While the long-term picture continues to point to higher prices, gold has rallied not only in dollar terms but also in euro and yen prices. 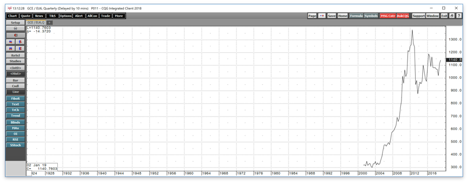
Source: CQG
The price of gold in euros has been in a bullish trend since the turn of this century.
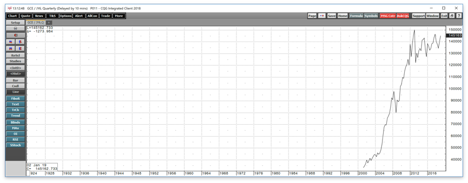
Source: CQG
The trend of the yellow metal in Japanese yen terms is even more bullish. The dollar, euro, and yen are the three leading reserve currencies of the world, and all three are telling us that the trend in gold remains higher.
The second reason that the path of least resistance for gold is higher is the state of the geopolitical landscape. Thursday's meeting between President Trump and North Korean leader Kim Jong Un was a reminder that the Korean Peninsula is still a global flashpoint for conflict. President Trump walked away from the summit early after it became apparent that the North Koreans are not ready to give up their status as a nuclear power. The Middle East remains a hotbed of turbulence with Iran and Saudi Arabia at each other's throats. And, the potential for an outbreak of significant hostilities between India and Pakistan is rising given the ongoing conflict over Kashmir. At the end of this month, the deadline for Brexit could cause fear and uncertainty in markets as it did in the aftermath of the referendum vote in June 2016 that took gold to its most recent significant peak at $1377.50 per ounce.
Finally, US domestic politics continue to provide the potential for market volatility and periods of fear and uncertainty. The political division in the continues to reach unprecedented levels since the civil war on almost a daily basis. Moreover, Congress will need to approve an increase in the debt ceiling as the obligations of the US are now over $22 trillion. The US and global monetary policies over the past decade caused a flood of liquidity which has caused the value of fiat currencies to decline making gold a more attractive investment vehicle and store of value than ever before. We cannot forget that central banks around the world continue to hold the yellow metal as a reserve asset, and they continue to be net buyers adding to their aggregate stockpiles.
Turbocharged products on dips
Gold is correcting to the downside as we head into March, and now may be the perfect time to consider turbocharged gold ETN products which will outperform the price action in the yellow metal if it is about to find a bottom at a higher low. The fund summary for the Velocity Shares 3X Long Gold ETN states:
The investment seeks to replicate, net of expenses, three times the S&P GSCI Gold index ER. The index comprises futures contracts on a single commodity. The fluctuations in the values of it are intended generally to correlate with changes in the price of gold in global markets.
UGLD has net assets of $144.06 million and trades around 105,000 shares each day. UGLD's triple leverage comes at a price as the instrument will decay over time. Therefore, timing is everything when it comes to holding a product that can provide a significantly higher gain if the price of gold is going to recover and move to a new high. UGLD is a trading rather than an investment tool. If last Friday's correction set the stage for the next leg to the upside, UGLD would offer a leveraged return compared to the price of the yellow metal. I would not hold UGLD for longer than two to three weeks and would exit any position if the price of gold closes below the $1280 per ounce level on the nearby April COMEX futures contract. UGLD and other leveraged ETF and ETNs periodically undergo reverse splits that destroy their value and make them dust collectors in the portfolios of market participants who hand onto them for more than a short period.
It is possible that the correction in gold will continue this week, but since August, any price weakness in the yellow metal had been a buying opportunity. If that pattern remains intact, UGLD is a product that could turbocharge returns.
The Hecht Commodity Report is one of the most comprehensive commodities reports available today from the #2 ranked author in both commodities and precious metals. My weekly report covers the market movements of 20 different commodities and provides bullish, bearish and neutral calls; directional trading recommendations, and actionable ideas for traders. I just reworked the report to make it very actionable!
Disclosure: I/we have no positions in any stocks mentioned, and no plans to initiate any positions within the next 72 hours. I wrote this article myself, and it expresses my own opinions. I am not receiving compensation for it (other than from Seeking Alpha). I have no business relationship with any company whose stock is mentioned in this article.
Additional disclosure: The author always has positions in commodities markets in futures, options, ETF/ETN products, and commodity equities. These long and short positions tend to change on an intraday basis.The author owns physical gold.
Follow Andrew Hecht and get email alerts