Gold: Daily, Weekly And Monthly Potential Short Trigger Levels Identified
A close in gold below $1476 will activate a short trigger on a monthly signal, automatically activating the targets below.
The next targets below are $1465 to $1471.
A close below $1450 will activate the yearly, monthly and daily short signals, activating short trigger points with targets below the mean at the $1400 to $1363 levels.
Based on the forecast we published on September 28, 2018 for the following 12 months for gold in 2019, it appears that gold has completed the target of $1476 we published in the report. As we came into this morning, the gold high for the December contract was $1486.80, which completed the annual sell 2 (S2) target of $1476 we mentioned in our Seeking Alpha report. When the price reaches the indicated target, the artificial intelligence of the Variable Changing Price Momentum Indicator (VC PMI) recommends that you go neutral. That was a 23% gain or a $280 move per oz. The futures equals a $28,000 net profit per contract.
Gold Short Trigger
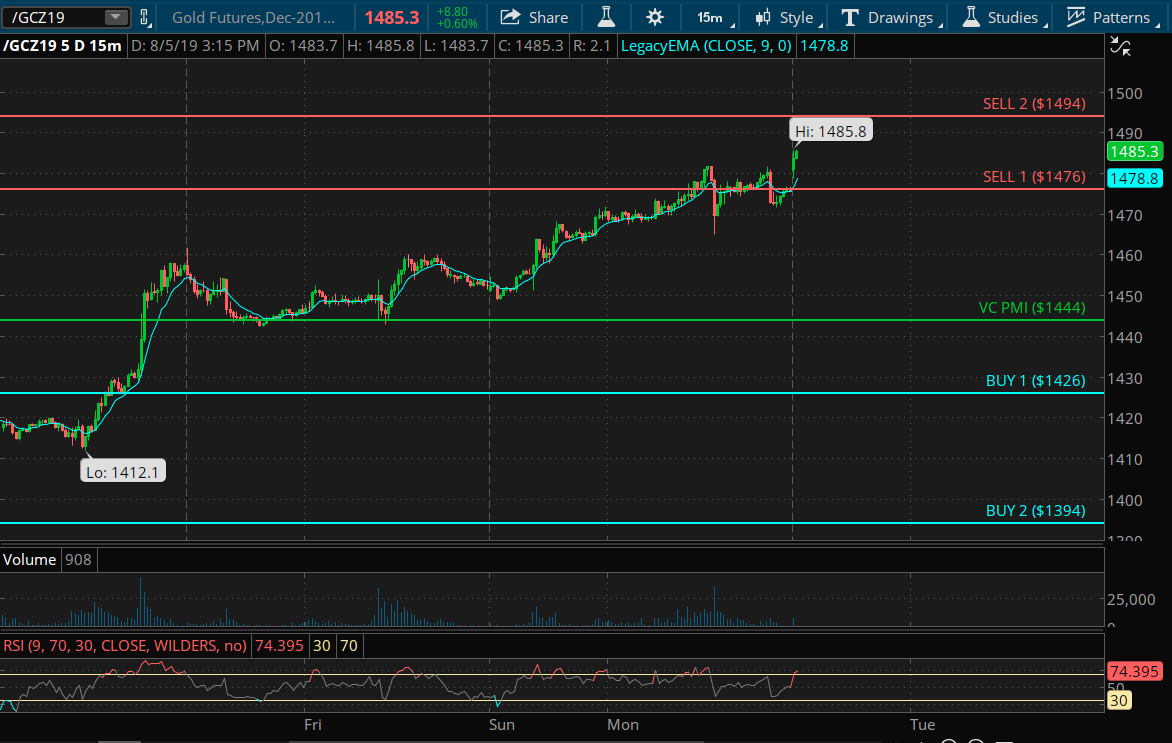
As we look at the closing at $1475.70, it was the first indication of a potential short trigger developing in gold. The artificial intelligence recommends that if the price closes a second time below $1476, it would activate a short trigger point from the S1 level on the monthly chart. If activated, the first target below is $1444 the mean for this period of time.
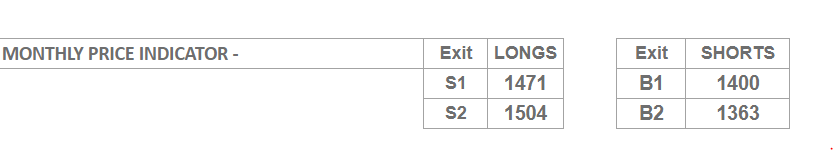
If we look at the current monthly Mean Reversion Trading report that we published on Seeking Alpha this past Saturday, it said that if we came in long at the start of the month, the targets for this month were $1471 to $1504. On the monthly chart, we have the target of $1471 completed.
"There is still room for the prices to spike up to $1504 as indicated on the sell 2 weekly level of the monthly report for August," Equity Management Academy CEO Patrick MontesDeOca warned. "But today's close, below $1476, which is the annual signal, is beginning to indicate the possibility that the market is rolling over to the short side."
Daily, Weekly and Monthly Potential Short Triggers
If we look at the monthly target of the sell 1 (S1) level of $1471 as we came into this month, a close below $1471 would activate the monthly short trigger, as well as the yearly short trigger.
As we begin to see the price activating the trigger points from the levels of distribution of supply, we begin to get an idea of where the supply is, and the price action activating the trigger point means we have the potential for a high probability trade. Whether the signal is daily, weekly or monthly, if the price reaches the S1 level and closes below it, the market activates a short trigger. If it is daily, weekly or monthly, you begin to see that the structure of the market is beginning to change accordingly.
Mean Reversion Strategy
The gold market has accomplished the annual target of $1476, as well as the monthly target for this month of $1471. As we move forward, a close below $1476 will activate a short trigger on a monthly signal, automatically activating the targets below. The next targets below are $1465 to $1471. What we want to see in the next couple of days is a close below $1470 in gold, thereby activating the yearly short signal, the monthly short signal and, most probably, the daily short signal on a close below about $1450. In doing so, all three major trends would be activating bearish trend momentum and short trigger points as we begin the reversion to the mean and, possibly, to the extreme levels below the mean at the $1400 to $1363 levels indicated by the artificial intelligence of the VC PMI, written in C++ on TradeStation platforms.
The VC PMI Automated Algorithm
We use the proprietary Variable Changing Price Momentum Indicator (VC PMI) to analyze the precious metals markets and several indices. The primary driver of the VC PMI is the principle of reversion to the mean ("Mean Reversion Models of Financial Markets," "The Power of Mean Reversion in Factor - Based Investing"), which is combined with a range of analytical tools, including fundamental logic, wave counts, Fibonacci ratios, Gann principles, supply and demand levels, pivot points, moving averages, and momentum indicators. The science of Vedic mathematics is used to combine these elements into a comprehensive, accurate, and highly predictive trading system.
Mean reversion trading seeks to capitalize on extreme changes in the price of a particular security or commodity, based on the assumption that it will revert to its previous state. This theory can be applied to both buying and selling, as it allows a trader to profit on unexpected upswings and buy low when an abnormal low occurs. By identifying the average price (the mean) or price equilibrium based on yesterday's supply and demand factors, we can extrapolate the extreme above this average price and the extreme below it. When prices trade at these extreme levels, it's between 90% (sell 1 or buy 1 level) and 95% (sell 2 or buy 2 level) probable that prices will revert to the mean by the end of the trading session. I use this system to analyze the gold and silver markets.
Strengths And Weaknesses
The main strength of the VC PMI is the ability to identify a specific structure which price level traders can execute with a high degree of accuracy. The program is flexible enough to adjust to market volatility and alerts you when such changes take place, so one can adjust strategies accordingly. Such changes include when the market breaks out of a consolidation phase or a trend accelerates. Such volatility usually happens when the market has produced a signal at the S2 or B2 level, and the market closes above or below these extreme levels.
The day trading program then confirms that a higher fractal in price has been identified, and the market will move significantly higher, although the same principle applies if the market falls significantly. The price closing above the S2 level indicates that the buying demand is greater than the supply. This means that the market has found support for the next price fractal. Conversely, the price closing below the B2 level indicates that the selling pressure has met demand greater than supply at the extreme below the mean, and prices should revert back to the mean.
The basic concept of the VC PMI is that the program trades the extremes of supply and demand based on the average price daily, weekly, and monthly.
The strongest relationship we find in the algorithm is when the daily price is harmonically in alignment with the weekly and monthly indicators. We call this "harmonic timing." Such an indication produces the highest probability (90%) that the price will revert from these levels to its daily, weekly, or monthly average.
To learn more about how the VC PMI works and receive weekly reports on the E-mini, gold and silver, check out our Marketplace service, Mean Reversion Trading.
Disclosure: I/we have no positions in any stocks mentioned, but may initiate a long position in DUST over the next 72 hours. I wrote this article myself, and it expresses my own opinions. I am not receiving compensation for it (other than from Seeking Alpha). I have no business relationship with any company whose stock is mentioned in this article.
Follow Equity Management Academy and get email alerts