Gold: Don't Lose Sight Of The Big Picture
Gold continues to make higher lows on its weekly chart, with a potential new higher low at $1,280/oz.
Bullish sentiment also continues to make higher lows and is still not at exuberant levels.
Unless $1,274/oz breaks on a weekly close, there's no reason to entertain the sub $1,200/oz double bottom calls.
While many are focused on the day-to-day fluctuations to prognosticate the twists and turns in the gold (GLD) price, I've always found it easiest to zoom out and look at the big picture. When gold is above its key weekly and monthly moving averages, the benefit of the doubt goes to the bulls. This doesn't mean 3-5% corrections aren't possible, but generally, they are opportunities to begin adding exposure. We recently saw this as gold came down to test its 20-month moving average and found support immediately, a change in character from 2018's doldrums where it sliced through that level like it wasn't there. Bullish sentiment is not yet at exuberant levels for gold and the sentiment trend also remains positive with the sentiment moving averages continuing to gain ground. This suggests that more bulls are entering the market and will be motivated buyers on dips of 3-5%. As long as the $1,274/oz level holds on a weekly closing basis, I don't see any reason that gold has to double bottom under $1,200/oz like some are suggesting. When the facts change, it's important to adjust, but thus far, the facts indicate that the bulls are playing defense exactly where they need to.
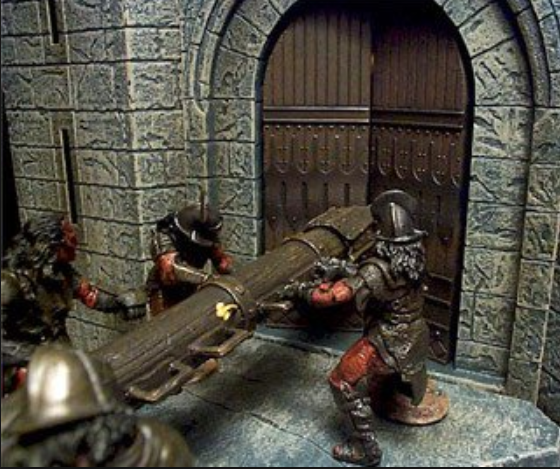
(Source: Author's Photo)
Beginning with a chart of bullish sentiment of gold I've built from Daily Sentiment Index data, we can see that the key sentiment moving average (red line) continues to trend higher and sentiment also remains in an uptrend. The metal got a little ahead of itself last month, but thus far, it's found support right near its key sentiment moving average. As long as the metal continues to make higher lows in sentiment and does not begin living below this key sentiment moving average, this indicator will remain on a favorable reading.
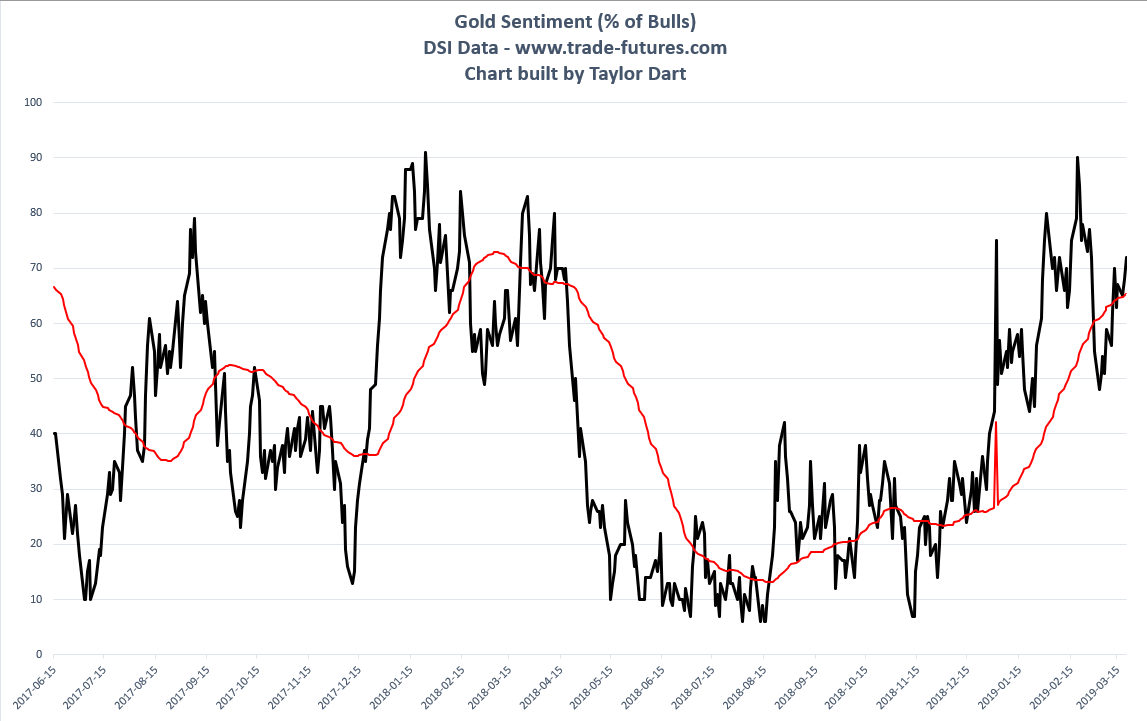
(Source: Daily Sentiment Index Data, Author's Chart)
I've never really understood the obsession with single daily readings for sentiment data as often you get the highest readings in sentiment at the onset of a significant move in an asset class. The same is true of a massive move down in an asset class; the worst readings often come right before the wheels come off. I briefly touched on this last year with a chart of oil displaying its significant bear market in 2015. As we can see in the below chart, oil hit a reading of 4% bulls in October at over $86.00/barrel and saw absolutely no bounce before plunging to $42.00/barrel over the next three months. It is not the reading that matters; it's the trend. In my opinion, there's minimal value in using daily sentiment readings to try and forecast medium-term and even short-term moves. It is not the reading that's important; it's the trend in the readings.
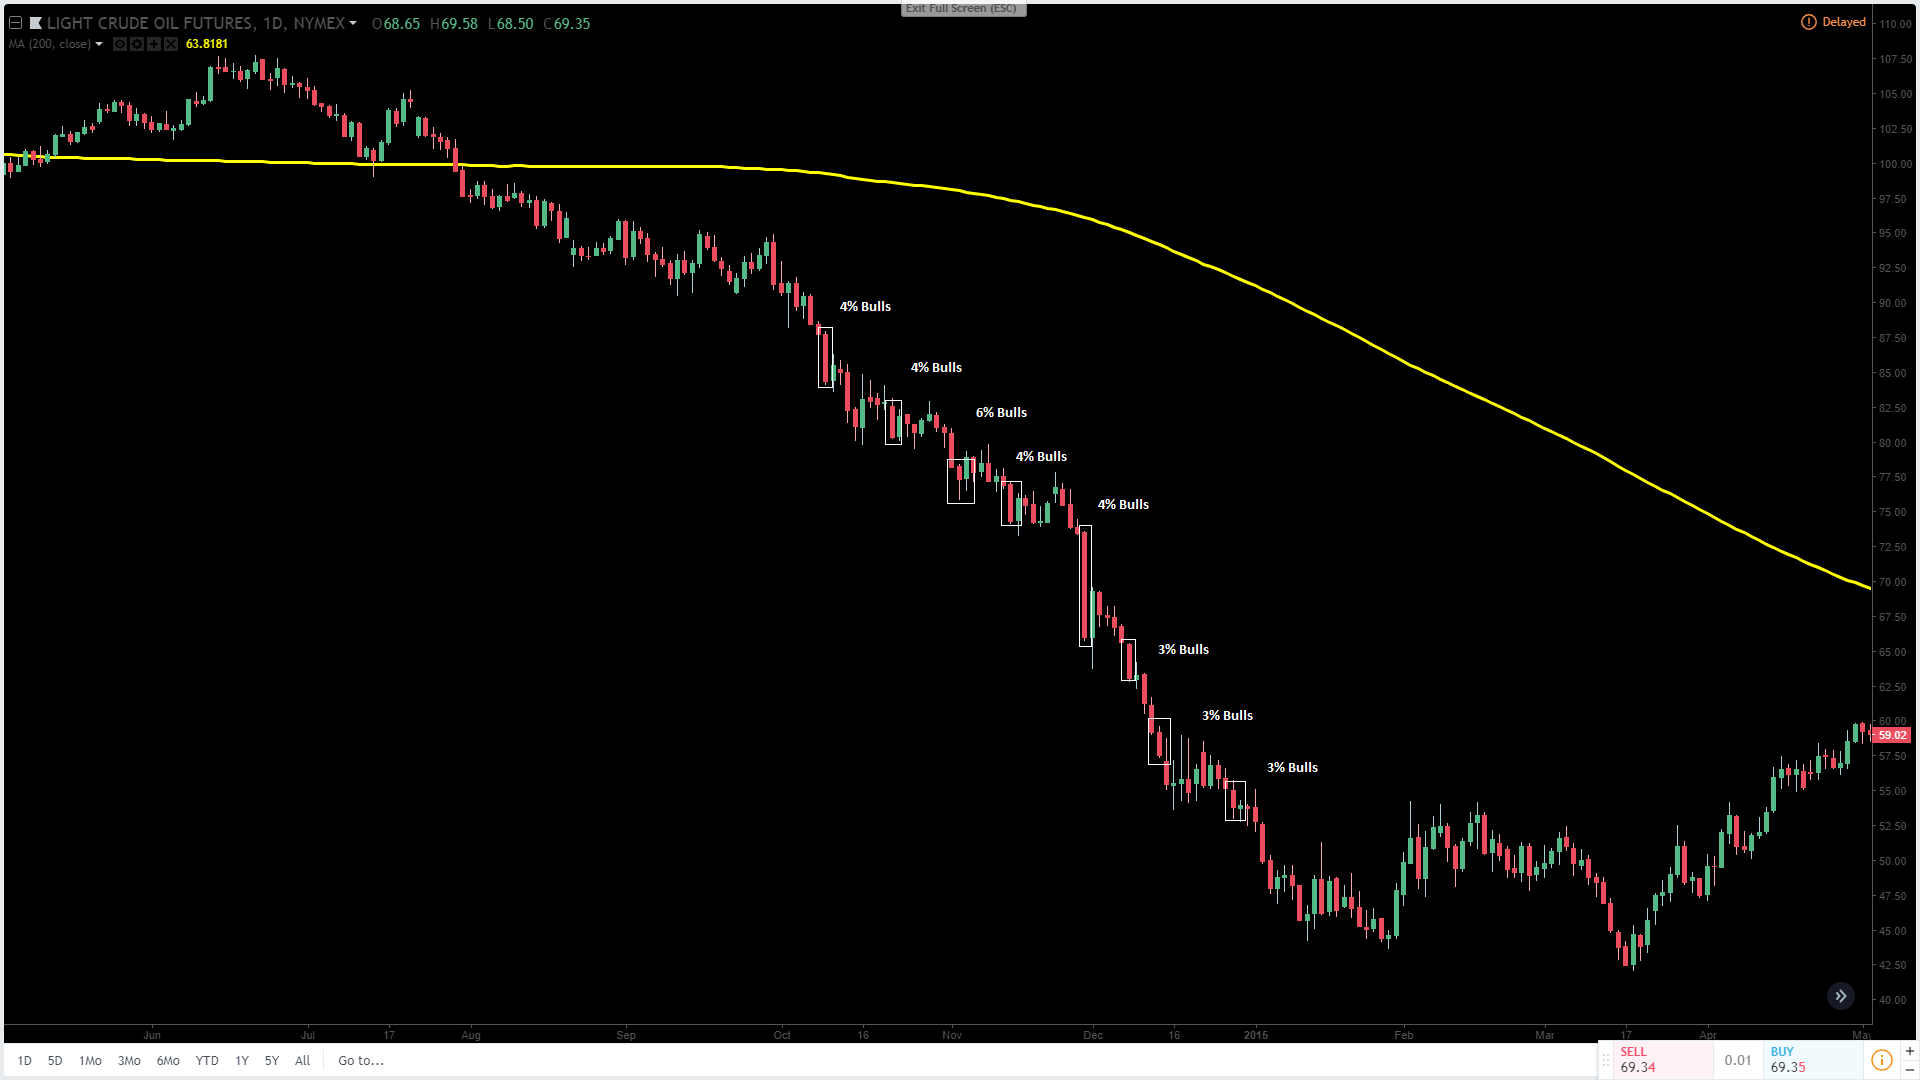
(Source: TradingView.com, Author's Chart)
To explain this point, we can see that gold put in several readings of 85-95% in 2010, and this was not a reason to go out and try to justify the need for a 10% correction or a double bottom.
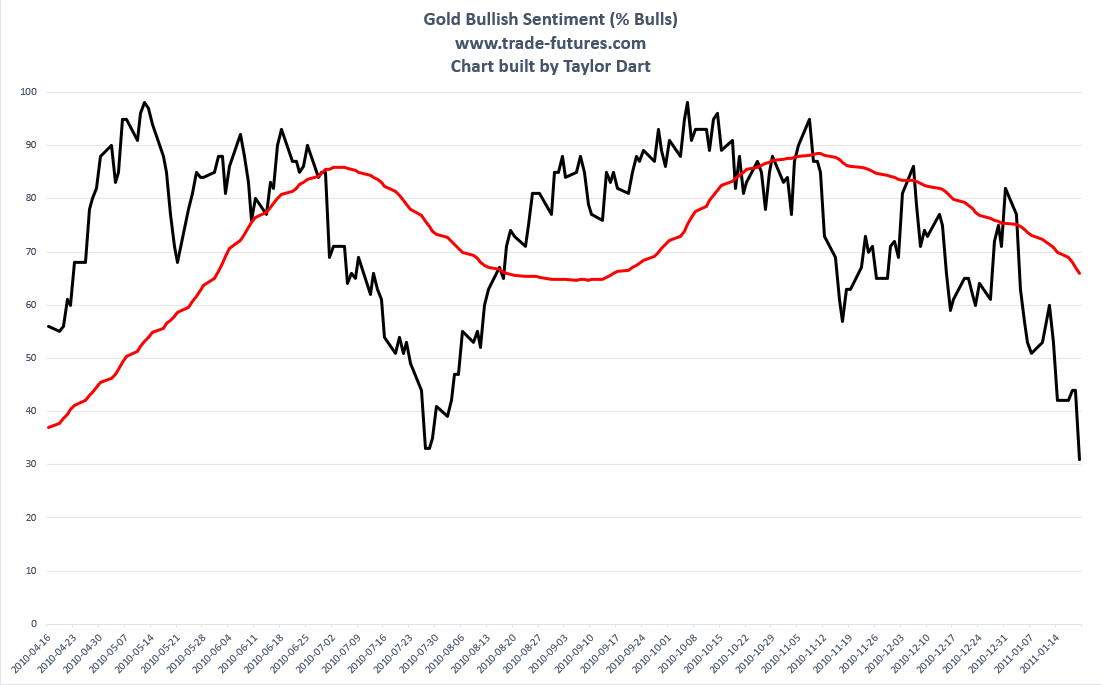
(Source: Daily Sentiment Index Data, Author's Chart)
I have labeled the 90% bullish readings and 88% bullish readings in the below 2010 chart, and they were not ideal times to be selling gold unless you were interested in trying to buy it back 1% lower to get back in.
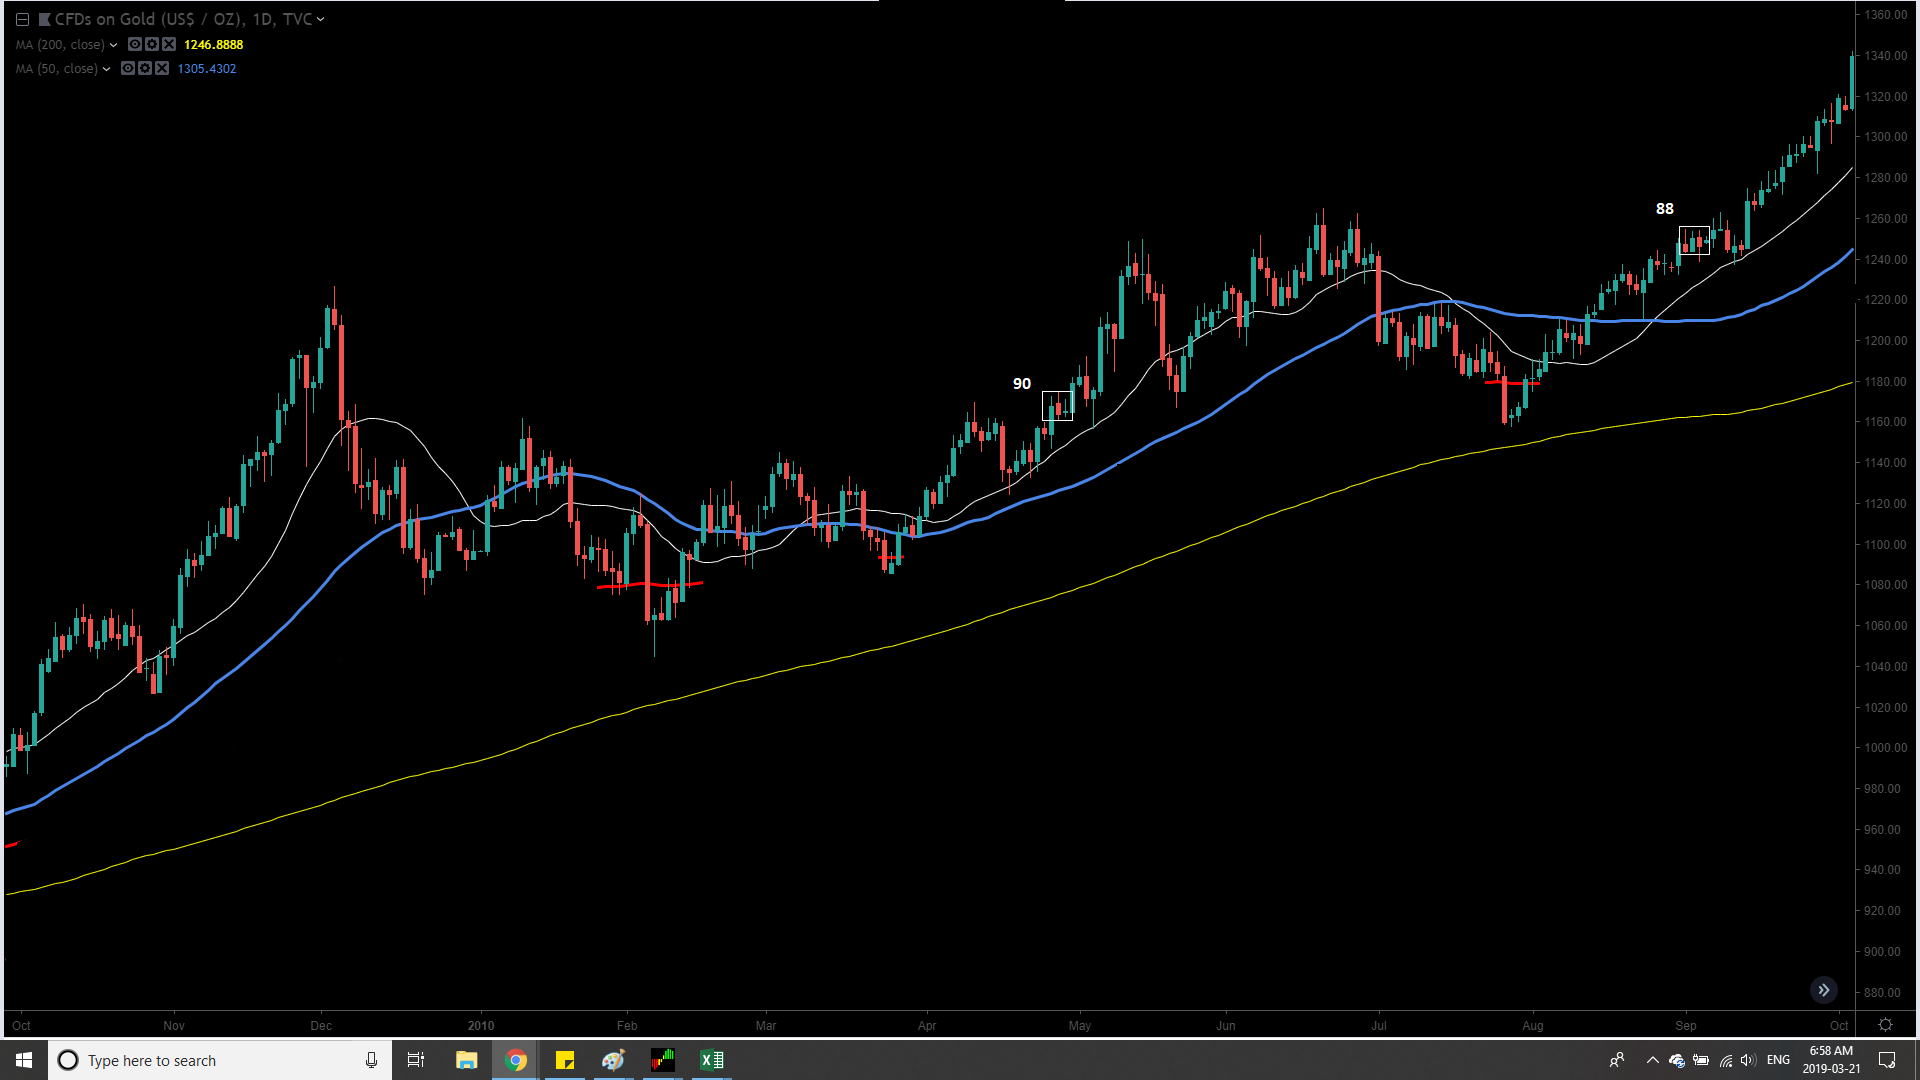
(Source: TradingView.com)
The only trouble for gold began in late 2010 when the trend flipped to down (in the DSI chart above of 2010/2011) and the metal continued to make lower highs and lower lows below its key sentiment moving average. This eventually led to a decline of 9% from $1,430 to $1,308 and was a time to potentially re-position if one wanted to be strategic.
So, how does this relate to gold currently? As shown in the below chart, the key sentiment moving average is rising and gold is above it. Unless gold starts making lower lows in sentiment below the 55% level and a new trend down is established, I don't see any reason for the sub $1,200/oz calls we're seeing from some analysts. Would it be logical that gold would reclaim its 200-day moving average and then move back down to re-test it? Sure, it would be logical. But, I don't know when the market has ever been logical or easy for the masses.

(Source: Daily Sentiment Index Data, Author's Chart)
Based on the above chart of DSI data, the trend remains up, and we are not yet at exuberant levels. This suggests that 3-5% dips will continue to get bought up and that the path of least resistance is higher for now. The only way a dent could be put in this picture would be a lower low in sentiment or if the metal began to live below its key sentiment moving average (red line).
So, is the technical picture supporting this?
Taking a look at the monthly chart of gold, we can see that it found support right at the 20-month moving average (teal line) earlier this month. The 20-month moving average currently sits at $1,280/oz, and the key for the bulls is defending this level on a monthly closing basis. As we can see in the below chart, we did not find support at this level in 2018 and dropped right through it with no supportive action by the bulls. Thus far, this is a positive change of character for the time being.
The 20-month moving average is also attempting to restart a positive slope like it did in 2016, after being flat to down for the majority of 2018. We still do not have a positive confirmation of an upward slope yet, but we should see this at some point in 2019 if the bulls can continue to play defense above the $1,274/oz level. For what it's worth, the metal is also above a long-term indicator that it has been unable to reclaim on a monthly closing basis since this level was lost in 2011 as it transitioned to a new bear market. This suggests that there's certainly a possibility that the metal is trying to transition into a new bull market. A monthly close above $1,380/oz will be required to confirm this view.
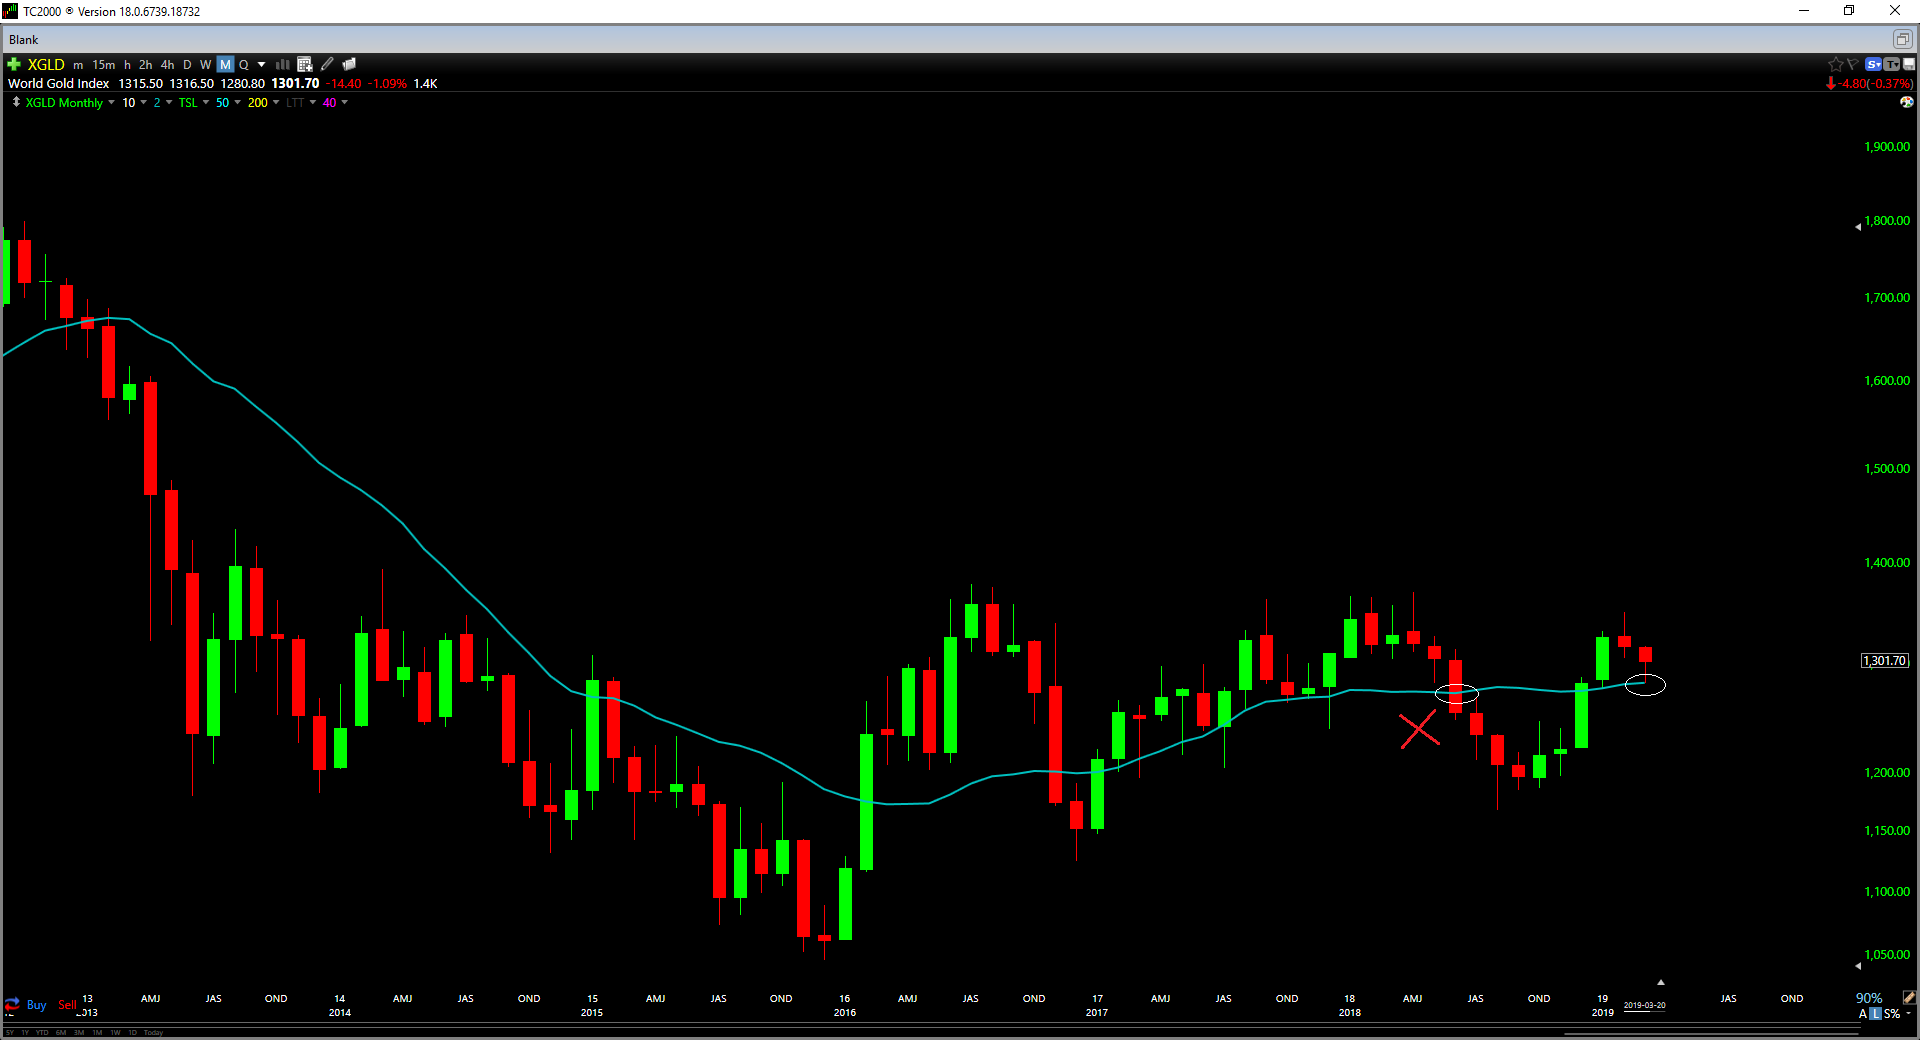
(Source: TC2000.com)
Looking at a weekly chart, we can see that the metal continues to make higher lows over the past three years. The 2016 rally was a violent bounce within a secular bear market, in my opinion, which is why it was squashed so quickly. The past 30 months since Q3 of 2016 has shaken most of the weak hands out of gold while the metal has built out a near 5-year base. This is a massive launching pad if the metal decides to finally break through the $1,380/oz level on a monthly close.
We can also see that the 400-week moving average for gold is now attempting to move back in an uptrend for the first time in nearly a year as it flattens out near the $1,250/oz level. This is a crucial spot for the bulls to defend going forward. Ideally, I would like to see a higher low and defense played at $1,274/oz on a weekly close, but an intra-week drop to the $1,255-1,265/oz to test this moving average would not dent the bullish picture at all if it were to occur. It's also notable to mention that gold has now tested resistance at the $1,365/oz area several times over the past few years. Generally, when a level continues to get tested, this level gets weaker and weaker over time. I would compare this to a battering ram banging on a castle's doors. While the first, second, and third test might not get through as they need to weaken the hinges of the door, the door is likely to come back if those operating the battering ram get a fifth or sixth chance at it.
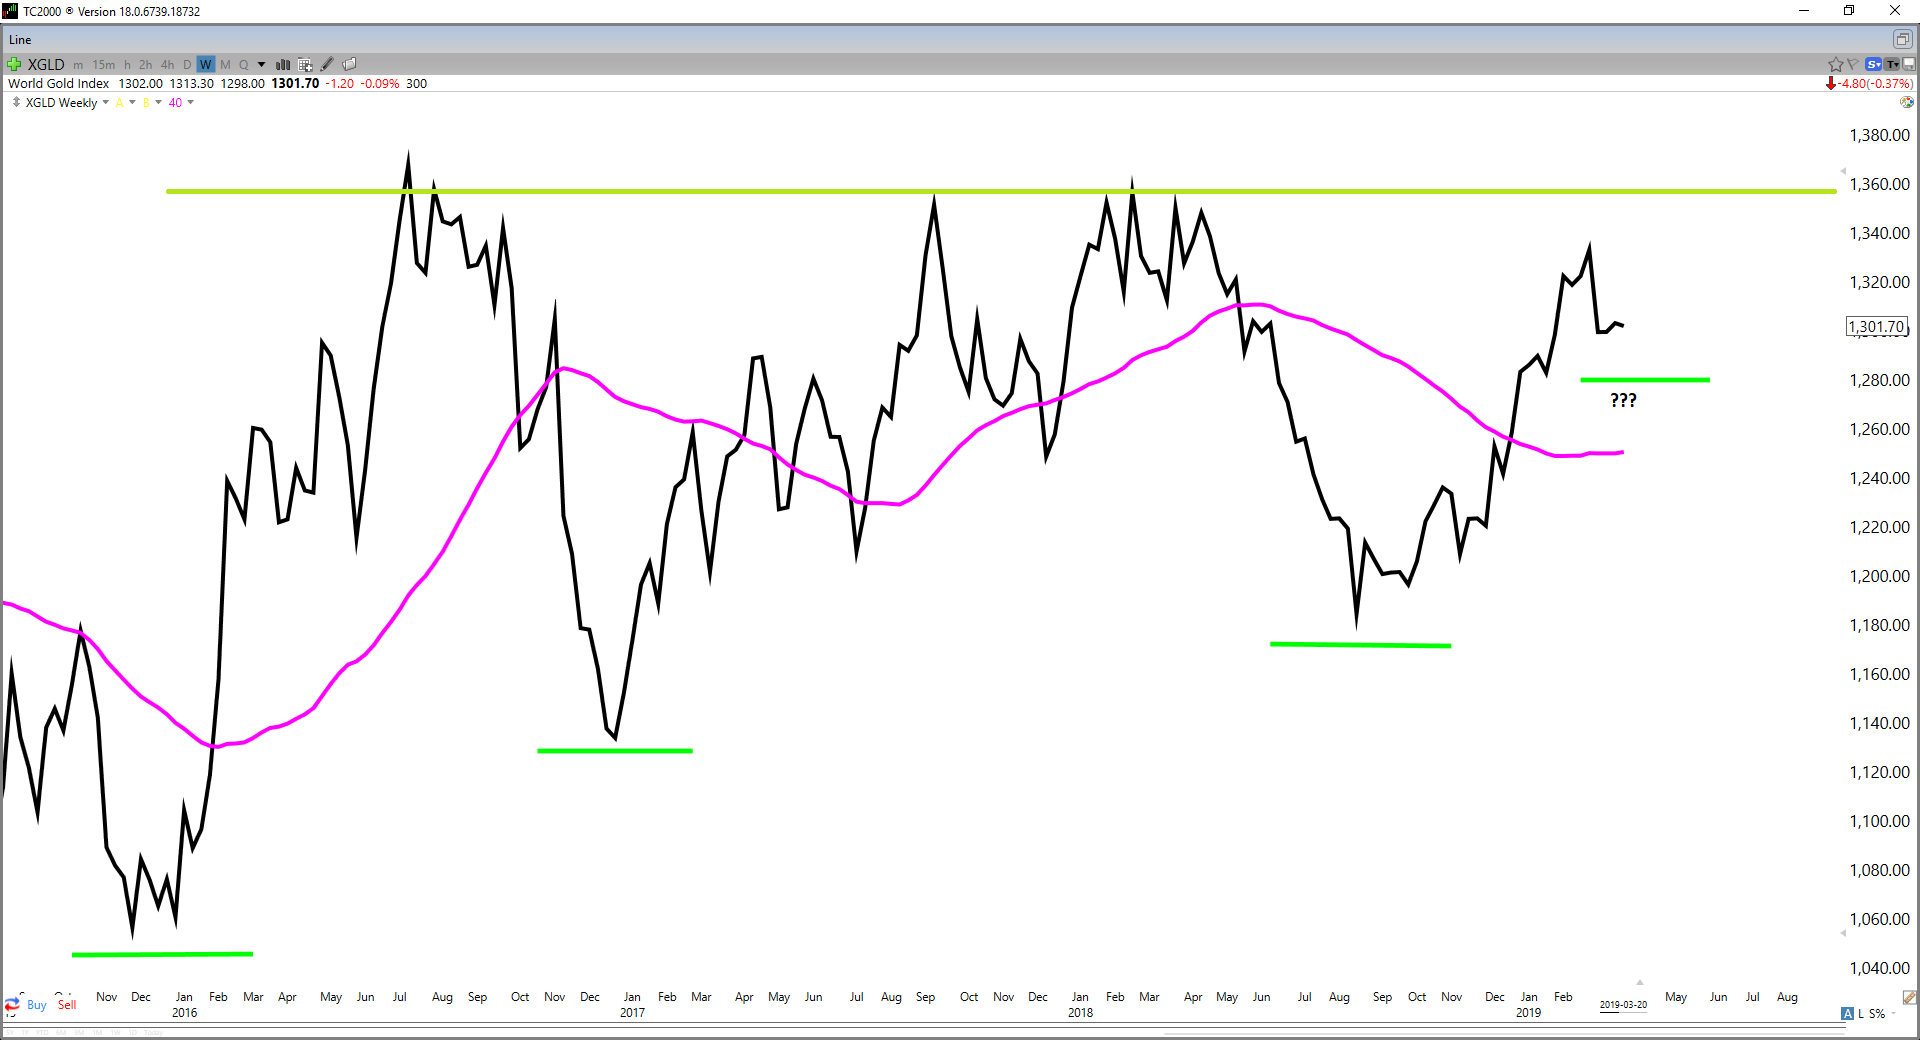
(Source: TC2000.com)
In summary, I see no reason for the bulls to lose faith here. The sentiment trend remains favorable, bullish sentiment is not at exuberant levels where major tops have occurred, and the metal remains above all of its key monthly and weekly moving averages. Trying to micro-manage each $10-15/oz move in the metal or every high daily sentiment reading is just going to distract one from focusing on the big picture, and that's why I see no value in it. The bulls remain in control as long as they can defend $1,274/oz on a weekly close. A weekly close below $1,274/oz would be a dent in the short-term picture and would suggest the metal needs more time before attempting another run at $1,365/oz. As long as the bulls can remain above $1,274/oz though on a weekly close, I would consider any 3-5% dips from the highs to be opportunities to add to long exposure and noise within the bigger picture.
If you liked this article, please consider following me for future updates!
Disclosure: I am/we are long GLD. I wrote this article myself, and it expresses my own opinions. I am not receiving compensation for it (other than from Seeking Alpha). I have no business relationship with any company whose stock is mentioned in this article.
Follow Taylor Dart and get email alerts