Gold Fakeout Instead of Breakout: Is the Gold Miners' Crash Coming? / Commodities / Gold and Silver Stocks 2022

Some analogies in the gold market thatmay be a hint for investors can be seen right now. If there's a 2008 rerun,what could that mean in the near term?
The precious metals market declinedyesterday, and while the move is still small, it’s nice to see that our shortpositions in juniors are already profitable.
Something quite interesting happened intheir price movement at the beginning of yesterday’s session, and that’s whatI’d like to start with today.
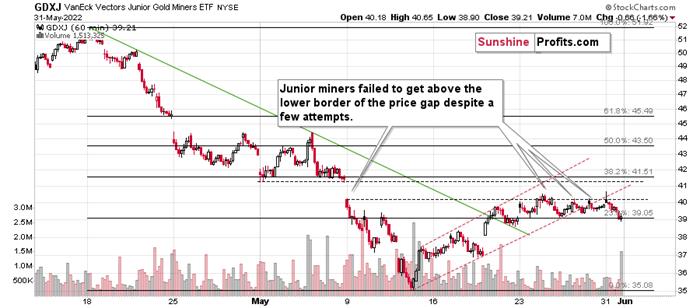
Juniors tried to rally above their recenthighs and resistance levels, but failed. They formed an hourly reversalcandlestick and then declined in the following part of the session.
What was “supposed” to be a breakout turnedout to be a fakeout, andlower values followed. This is bearish, and it tells us that taking profitsfrom our previous long positions inthe junior miners several days ago was likely a great idea.
To clarify, the above is bearish only forthe very short term. It doesn’t tell us much about the bigger picture. So let’szoom out. Significantly.
There are quite a few analogies betweennow and 2012, and I described them in the hugelast Friday’s analysis. However, there are also signs that whatwe’re seeing is actually similar to what happened in 2008. I also describedsome of them on Friday, but the one that I would like to emphasize today isalready visible on the chart above.
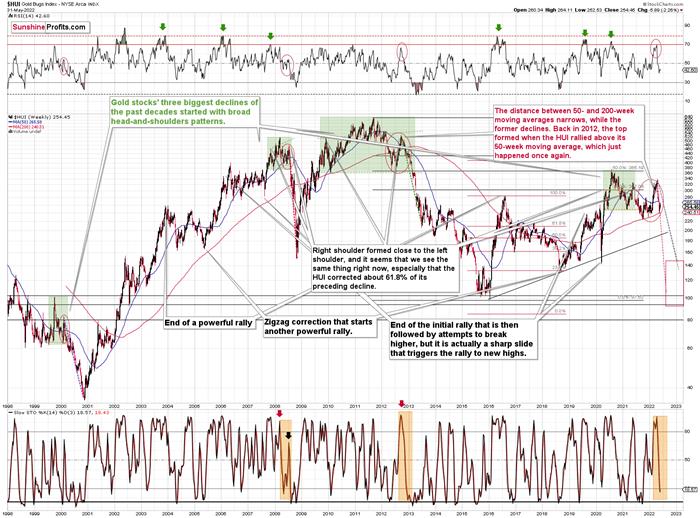
Namely, gold stocks declined practicallyjust as rapidly as they did in 2008. Here’s the really interesting part: theycorrected after moving close to their 200-week moving average – just like whatwe saw in 2008. This red line triggered corrections in both cases. They werenot huge, but notable from the short-term point of view.
You know how much theHUI Index declined before this correction (between the July 2008 topand the August 2008 bottom)?

About 33%.
The decline in the HUI Index that we sawbetween April and May took it about 27% lower.
Not identical, but very similar.
Andthe recent correction? The HUI moved uparound 8% higher in terms of closing prices and about 11% higher. Back in 2008,the analogous rally took the HUI about 12.5% higher.
Once again: not identical, but similar.Things are just a little less extreme this year.
If this similarity is to continue, thenwe can expect another mover lower to materialize shortly. Well, that’s what wealready knew based on other indications, but what the above analogy also tellsus is that the HUI Index could decline significantly once again. Back in 2008,it declined by about 26%, which was a little less than before theconsolidation.
Please keep in mind that history tends torhyme, not repeat itself to the letter. So, the above doesn’t imply that theHUI now has to decline by exactly 26%. It does tell us, however, that miningstocks can be expected to decline by as much (approximately!) as they didbefore correcting, and that’s animportant clue.
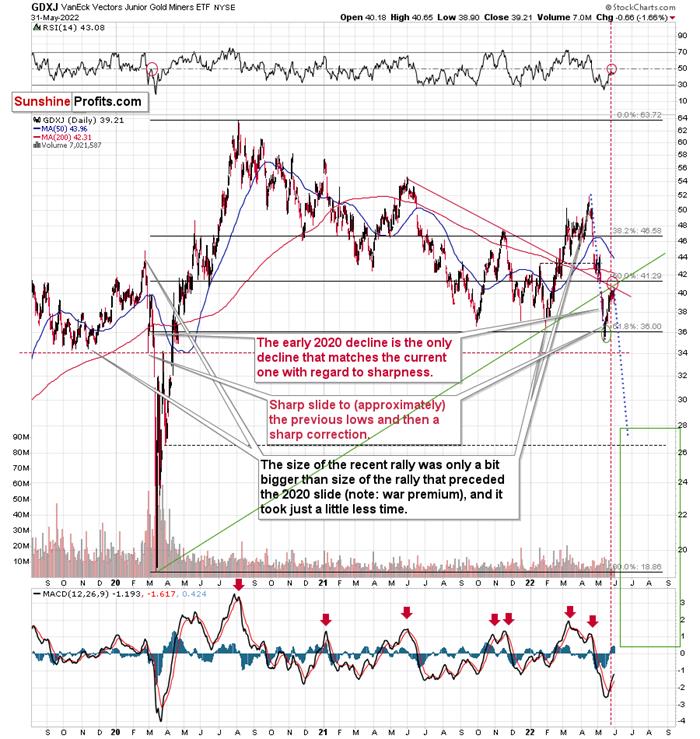
If the GDXJ declines by as much as it did beforecorrecting, it will move slightly below $28. The nearby support isprovided by the previous low (dashed line, slightly below $27). While it’sunclear if it moves below $27 or not – before correcting – it’s very likelythat we’ll see a huge decline below $30, and that the profits on our shortpositions are likely to increase significantly.
Is the very short-term top in? Thatappears likely, though it’s not 100% certain. The GDXJ appears to have toppedin the lower part of my target area, and the same goes for the RSI (which mighthave topped close to 50, just like it did in early 2020).
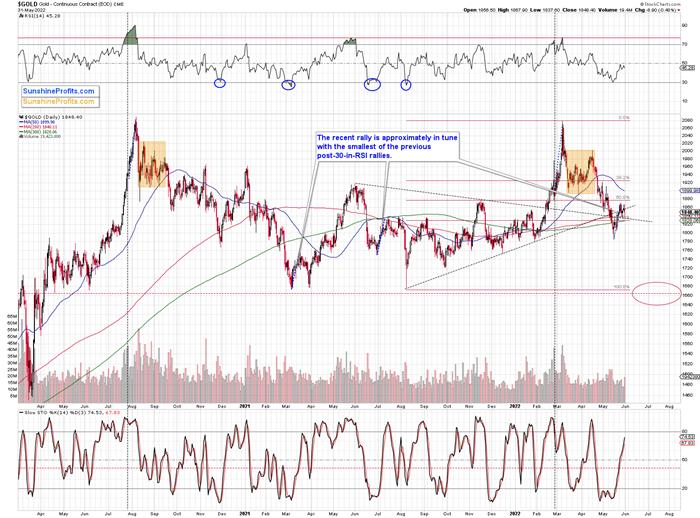
The gold market doesn’t provide any majorclues right now, except for the fact that we saw a substantial increase involume while gold declined. That’s bearish, but not very strongly so. Itdoesn’t have to be, though, as based on multiple other factors, gold is likelyto decline in the medium term and analogies to previous huge declines are onlyone of them. Rising real interest rates and the USD Index are the two keybearish drivers of gold prices.
Speaking of the USD Index, it seems thatit might have just bottomed right in my target area.
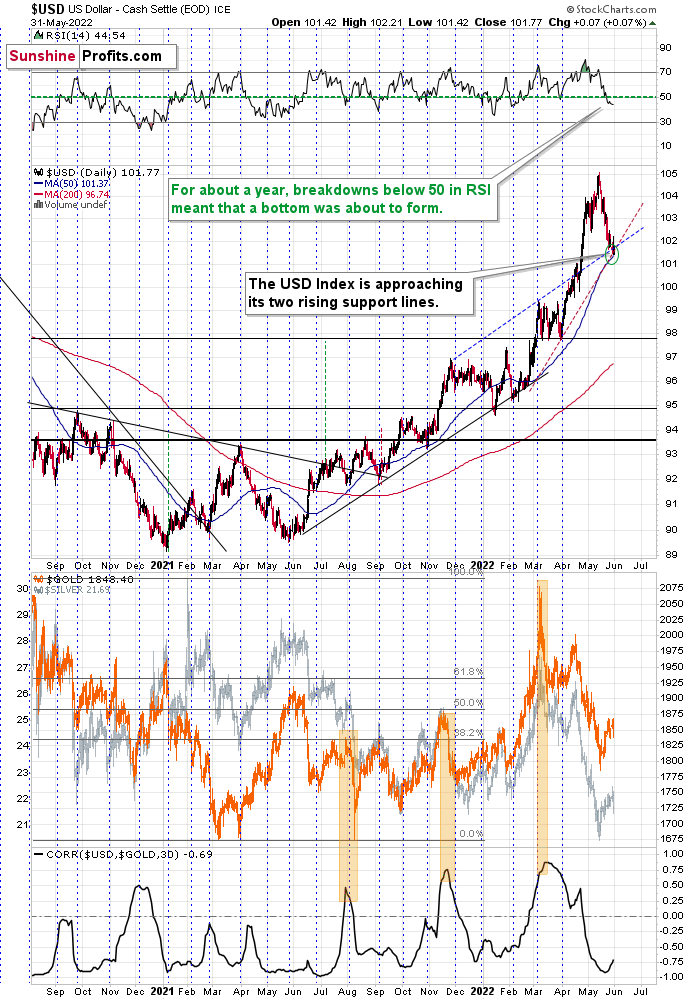
The combination of two rising supportlines (and the 50-day moving average) was likely to stop the pullback, and wemight have seen exactly that.
Please keep in mind that the RSI below 50also indicated good buying opportunities for the USD Index during the recentrun-up.
Most importantly, though, let’s keep inmind that gold stopped reacting to USDX’s weakness recently as it didn’t moveto new highs while the former moved to new short-term lows.
The above is a powerful bearishcombination of factors for the precious metals market.
All in all, it seems that we’re about tosee another sizable decline in the prices of junior mining stocks, and while Ican’t promise any performance, it seems likely to me that profits on our shortpositions will increase substantially.
Today's article is asmall sample of what our subscribers enjoy on a daily basis. They know aboutboth the market changes and our trading position changes exactly when theyhappen. Apart from the above, we've also shared with them the detailed analysisof the miners and the USD Index outlook. Check more of our free articles on our website, including this one – justdrop by and have a look. Weencourage you to sign up for our daily newsletter, too - it's free and if youdon't like it, you can unsubscribe with just 2 clicks. You'll also get 7 daysof free access to our premium daily Gold & Silver Trading Alerts to get ataste of all our care. Signup for the free newsletter today!
Thank you.
Przemyslaw Radomski, CFA
Founder, Editor-in-chief
Toolsfor Effective Gold & Silver Investments - SunshineProfits.com
Tools für EffektivesGold- und Silber-Investment - SunshineProfits.DE
* * * * *
About Sunshine Profits
SunshineProfits enables anyone to forecast market changes with a level of accuracy thatwas once only available to closed-door institutions. It provides free trialaccess to its best investment tools (including lists of best gold stocks and best silver stocks),proprietary gold & silver indicators, buy & sell signals, weekly newsletter, and more. Seeing is believing.
Disclaimer
All essays, research and information found aboverepresent analyses and opinions of Przemyslaw Radomski, CFA and SunshineProfits' associates only. As such, it may prove wrong and be a subject tochange without notice. Opinions and analyses were based on data available toauthors of respective essays at the time of writing. Although the informationprovided above is based on careful research and sources that are believed to beaccurate, Przemyslaw Radomski, CFA and his associates do not guarantee theaccuracy or thoroughness of the data or information reported. The opinionspublished above are neither an offer nor a recommendation to purchase or sell anysecurities. Mr. Radomski is not a Registered Securities Advisor. By readingPrzemyslaw Radomski's, CFA reports you fully agree that he will not be heldresponsible or liable for any decisions you make regarding any informationprovided in these reports. Investing, trading and speculation in any financialmarkets may involve high risk of loss. Przemyslaw Radomski, CFA, SunshineProfits' employees and affiliates as well as members of their families may havea short or long position in any securities, including those mentioned in any ofthe reports or essays, and may make additional purchases and/or sales of thosesecurities without notice.
Przemyslaw Radomski Archive |
© 2005-2019 http://www.MarketOracle.co.uk - The Market Oracle is a FREE Daily Financial Markets Analysis & Forecasting online publication.