Gold Fields: Risks And Opportunities In Its Mining Operations
GFI's FY 2018 operational performance suffered a setback during FY 2018.
Despite the unimpressive performance, share prices were supported by a rally in gold prices.
The gold price rally finally seems to have found some ground.
GFI needs to witness the strong operational performance, particularly from the South Deep mine.
Thesis
Gold Fields Ltd. (GFI) is one of the largest gold miners in the world. Headquartered in South Africa, the company operates with 8 mines and 2 projects located across five countries.
Figure-1 (Source: IT News)
In this article, I have analyzed the financial and operating performance of GFI. During FY 2018, the company has demonstrated mixed financial performance in terms of top-line revenues and bottom-line earnings. On the operational front, GFI suffered a Y/Y decline in production together with an increase in mining costs. This has affected the mining dynamics of the company, particularly in its most significant mining asset namely the South Deep mine (in South Africa). Nevertheless, due to its high correlation with gold prices, GFI's share has recently witnessed upside following the recent rally in gold prices. However, since the prolonged gold rally finally seems to have found some ground, we would need GFI to actually deliver solid performance on its operational front, in order to witness any noticeable price gains.
Performance review and way forward
During FY 2018, GFI's GAAP EPS amounted to a negative $0.42 and missed the expectations by $0.18. Moreover, its revenues of ~$2.5 BB also witnessed a 6.5% Y/Y decline but exceeded expectations by $50 MM. As we will elaborate in the following discussion, GFI's gold production suffered on a Y/Y basis, hence, the $50 MM excess of revenues over expectations appears to be supported by a persistent increase in gold prices.
During FY 2018, GFI produced ~2,036 Koz (read: a thousand ounces) of gold at an AIC (read: All-in-Costs) of $1,173/oz. If we make a detailed comparison between annual guidance and actual production during the last 5 years, we can identify that during FY 2018 GFI's actual production was lower than the guidance. The production trend witnessed during FY 2018 was inconsistent with the trends observed during the last two years (FY 2016 and FY 2017), wherein GFI exceeded the annual production guidance. Nevertheless, GFI's annual gold production has gradually declined since 2014, on a Y/Y basis. Moreover, the FY 2018 production declined at a faster rate compared with the prior years. Have a look at Figure-2 that depicts these facts.
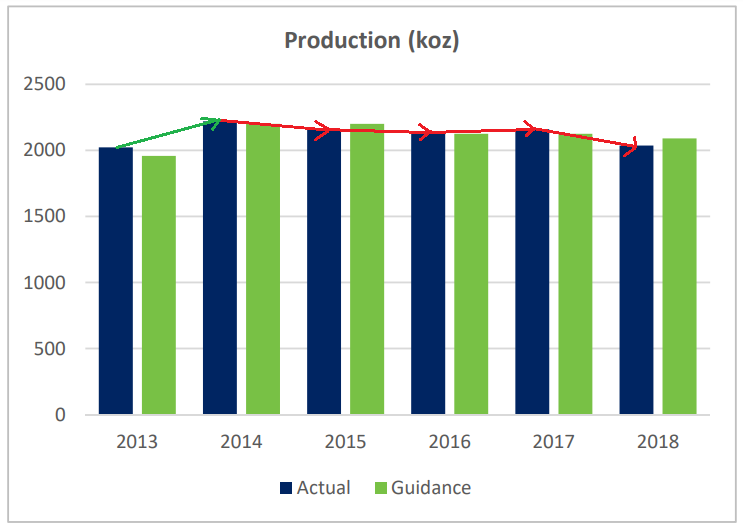
Figure-2 (Source: Presentation)
During FY 2018, GFI's production profile was also affected by the operational performance of the SD (read: South Deep) mine. From an operational viewpoint, SD delivered ~157 Koz of gold, at an AIC of ~$2,012/oz. If we consider the gold prices during FY 2018 (Figure-3), we can see that SD's operations were nowhere near 'economical', as the maximum gold price witnessed during the past 12 months was within the range of ~$1,300-1,400/oz.
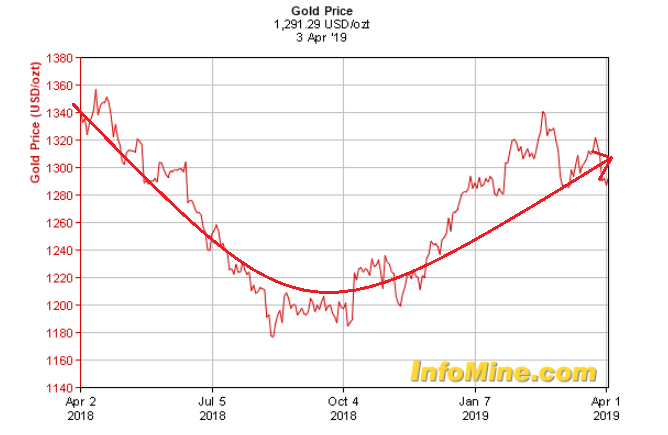
Figure-3 (Source: Infomine)
The mine's operating losses forced the company's management to cut down the manpower strength (by ~1,100 workers), thereby igniting the strike that further affected the output. When we consider GFI's mine-wise production profile (Figure-4), it's easy to identify that the Australia and Americas regions were the star performers in terms of operational performance. The Australia region delivered the highest proportion of attributable gold production, while the Americas region delivered the lowest cost production.
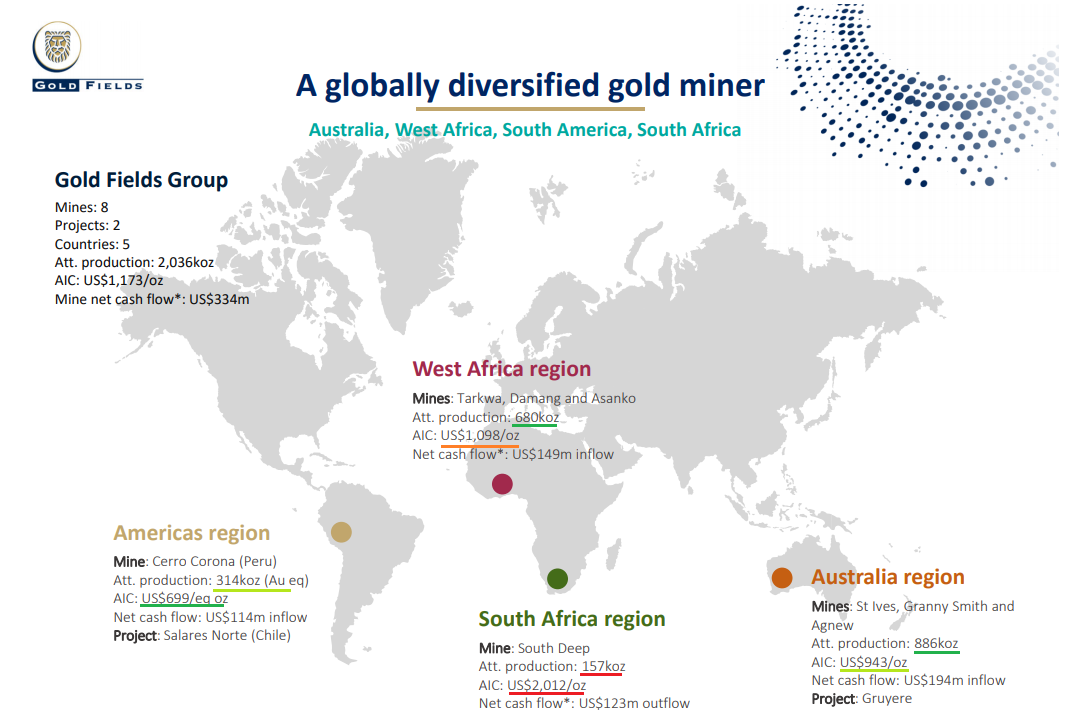
Figure-5 (Source: Presentation)
But unfortunately, for GFI, the strength in gold production from the Australian mines could not noticeably improve the overall mining dynamics of the company, which remain challenged by a mix of both production and cost-related concerns. When we consider the attributable AuEq (read: gold equivalent) reserves of GFI based on its geographic segments (Figure-6), we have a different story to consider (based on the numbers).
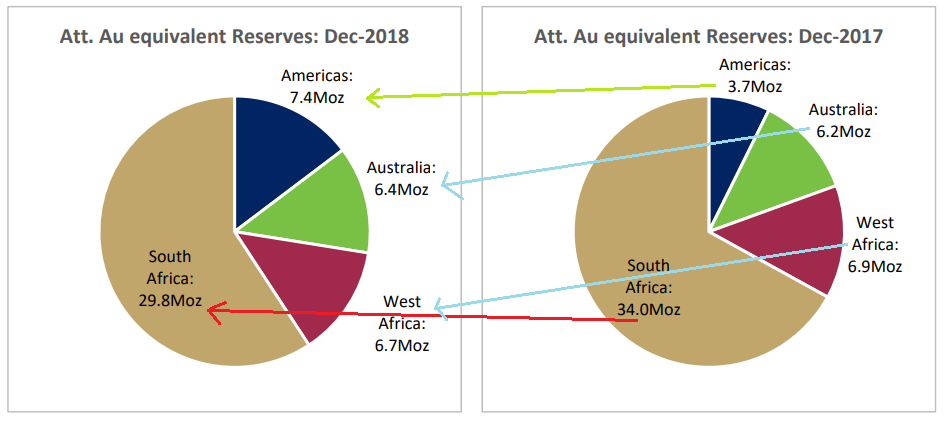
Figure-6 (Source: Presentation)
We can see that the Australian segment's reserves may well deplete within the next ~7-8 years if segment production continues at or near the levels witnessed during FY 2018. Moreover, the Australian segment had reported higher AIC compared with the Americas region. Now that leads us to consider how strong GFI's Americas region is in terms of production potential.
The production from the Americas region stood at ~1/3rd of the production from the Australian region (refer Figure-5). This region also reported the lowest production costs among GFI's geographical segments (at ~$700/oz). Moreover, we have seen in Figure-6 that the estimated AuEq reserves attributable to the Americas region have doubled during FY 2018, on a Y/Y basis. Given the fact that the Americas region produced ~314 Koz during FY 2018, if annual production continues at that rate, then we can expect GFI's American mines to continue production for the next 23-24 years.
Finally, the South Africa region has the highest potential in terms of gold reserves (~30 Moz at the end of FY 2018). The only mine in the region is the SD mine, and this mine alone accounts for ~60% of GFI's reserves reported at the end of FY 2018. However, there appear to be a few noticeable problems with this mine including the low annual production, high AIC, operating losses, and problems in maintaining a congenial working relationship with the mineworkers union. Given the significant potential of the mine, I believe that GFI should focus on resolving the issues at SD since this mine could be a game changer for the company. It appears that management is already set to resolve the issues with the SD mine. Have a look at Figure-7 that highlights the key initiatives taken by GFI to implement cost-reduction across the SD mine.
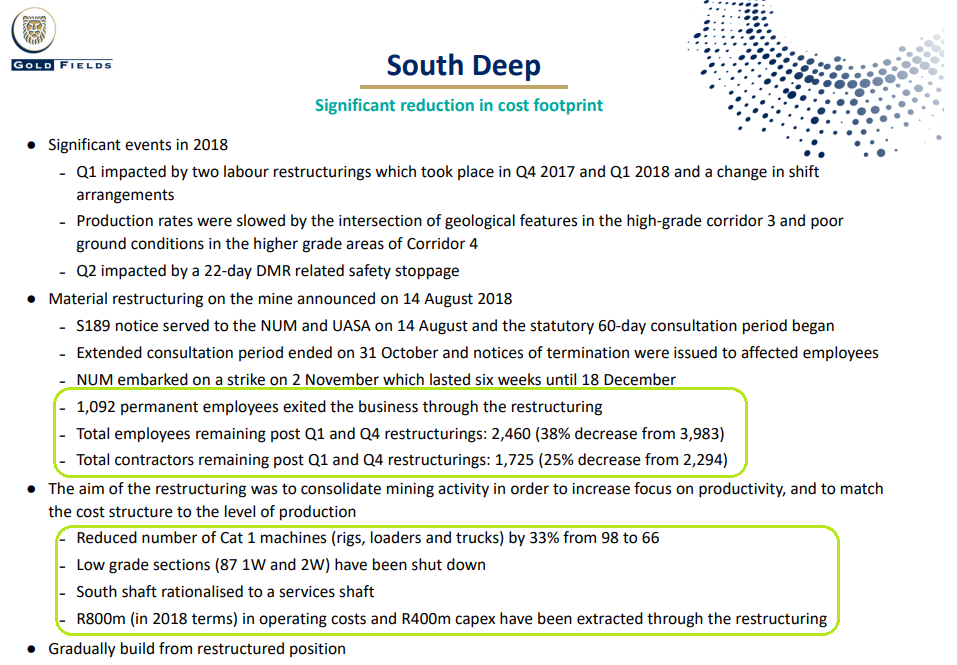
Figure-7 (Source: Presentation)
GFI's high correlation with gold prices
An analysis of the relationship between the prices of GFI and gold reveals a high correlation (~5-8 times) between the two. Figure-8 compares GFI's daily price returns (trailing twelve months) with that of SPDR Gold Trust (GLD).
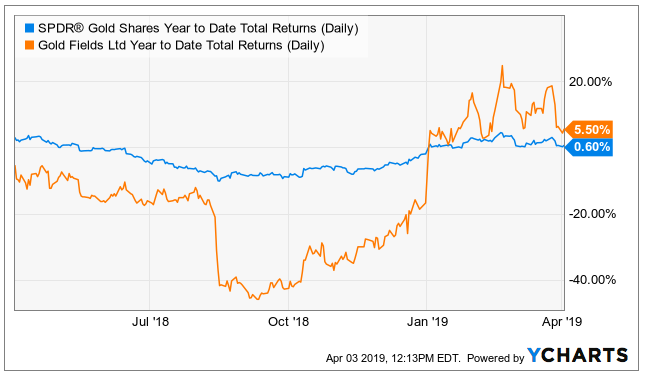
Figure-8 (Source: YCharts)
In my opinion, since GFI's results have largely remained flat in terms of operational and financial performance, we would need another round of gold bull market to propel the share prices higher than the current levels. Given the fact that gold prices have already had their bullish run since Q4 2018, there's a fat chance that gold will move significantly up from these levels. Therefore, we would need to see an improvement in GFI's operational and financial performance to witness upside in share prices. As discussed earlier, GFI's operational strength would largely depend on its progress in key geographical segments such as South Africa and the Americas regions.
Conclusion
In the preceding discussion, we have analyzed the operational performance of GFI based on its geographic segments. This analysis reveals that the South Africa region and the Americas region are of paramount importance for the company. The first one has the highest reserves (but also the highest costs), and the latter has the lowest costs (together with significant reserves).
GFI management plans to improve the mining dynamics of the SD mine through various cost-reduction initiatives, but the effectiveness of these initiatives has yet to be seen. If management succeeds in converting SD operations to profitability, then that could be a big achievement on their part and the share price would witness noticeable gains. If it couldn't, then the continued operating losses at the SD mine would imply that the share prices may only move sideways until we could see another round of gold bull markets.
Disclosure: I/we have no positions in any stocks mentioned, and no plans to initiate any positions within the next 72 hours. I wrote this article myself, and it expresses my own opinions. I am not receiving compensation for it (other than from Seeking Alpha). I have no business relationship with any company whose stock is mentioned in this article.
Follow Aitezaz Khan and get email alerts