Gold Final Warning: Here Are the Stunning Implications of Plunging Gold Price / Commodities / Gold & Silver 2019

 Goldhas turned vigorously lower yesterday. And not only gold at that. Red, red,everywhere in precious metals you looked. The silent scream we wrote about inthe Wednesday’s Alert for our subscribers brought serious repercussions.Immediately and just in time to reap the benefits. Today, we will devoteextraordinary attention to the long-term view of the PMs complex.
In yesterday’s Part I, we shared with youthe short-term check on precious metals sector health. That article was alimited sample of exclusive care our subscribers get on an everyday basis.Today, we will follow up with more of such a peek under the hood - anothersample of what our subscribers already enjoyed yesterday. Whether you arereading this article on our website or elsewhere on the Internet, we will nowshare today’s full picture with you, the visitor, on the long-term charts andsignals. Let’s examine whether the most recent developments changed thelong-term view.
Long-termUpdate on Gold and Silver
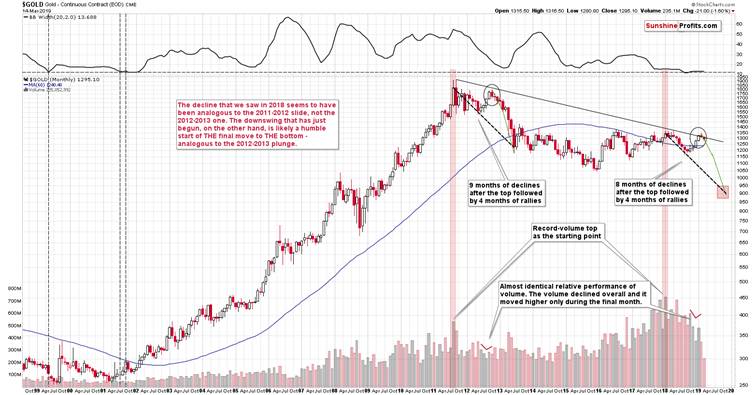
Firstthings first – gold’s analogy to what happened in 2012 and 2013 remainsup-to-date. Consequently, it seems to be worth to recall the description of theabove chart. As weexplained on March 4th, the analogy is striking also insilver and mining stocks, but we don’t want to quote the entire previous Alerthere, so we will simply quote what we wrote about gold:
The very first few months of the2018 were similar to the late-2012 decline, so it was natural to start theanalogy with these moves. As we now see, something else fits the analogybetter. The record-breaking monthly volume that we saw in 2011 and in 2018 issomething that starts an analogy that is confirmed by multiple developments(and not only from gold) and the most recent upswing doesn’t invalidate it.Conversely, it fits and confirms it.
Starting with the record-breakingvolume (marked with red rectangles), in 2011 we saw 9 months of declines, andin 2018 we saw 8 months of declines. In both cases, we then saw 4 months ofhigher prices and then a month where gold moved higher only on an intradaybasis, but declined in terms of the monthly closing prices. Both tops formednot too far from the previous high, but still below it. Then gold keptdeclining for several months.
Quite interesting so far, isn’tit? And we’re just getting started.
The similarity is not only inprice. The monthly volume readings are remarkably similar as well. When goldrallied in mid-2012, it did so on declining volume that increased in the finalmonthly upswing. It was exactly the same case in late 2018 and in January 2019.
What about the shape of theinitial decline (late-2011 – early 2012) that was rather chaotic and volatilecompared to the stable nature of the mid-2018 slide?
Looking at it with the benefit ofhindsight, it’s easy to see why these moves were different. It’s the questionof what preceded them. In particular, it’s the question of what kind ofvolatility was present overall. The former move was preceded by the parabolicupswing in gold prices and the top, while the latter was yet another (boring?)attempt to rally above $1400, which ultimately failed. The volatility that waspresent at and below the former was very high and the volatility that waspresent at and below the latter was very low. Consequently, it’s normal andnatural to expect that the former decline would be volatile and chaotic, andthe latter would be calm. This is normal, not something that breaks the analogy.You can check the volatility levels by looking at the upper part of the abovechart – it includes the Bollinger Band width, which can be used as a reliableproxy for volatility.
Theabove chart shows no deviation from the above-mentioned self-similarity. Goldis down this month, but not extremely so – just like it was the case in theearly part of the decline in 2012. The fact of gold moving higher in the lastseveral days didn’t change anything. Our goldprice forecast remains very bearish for the medium term.
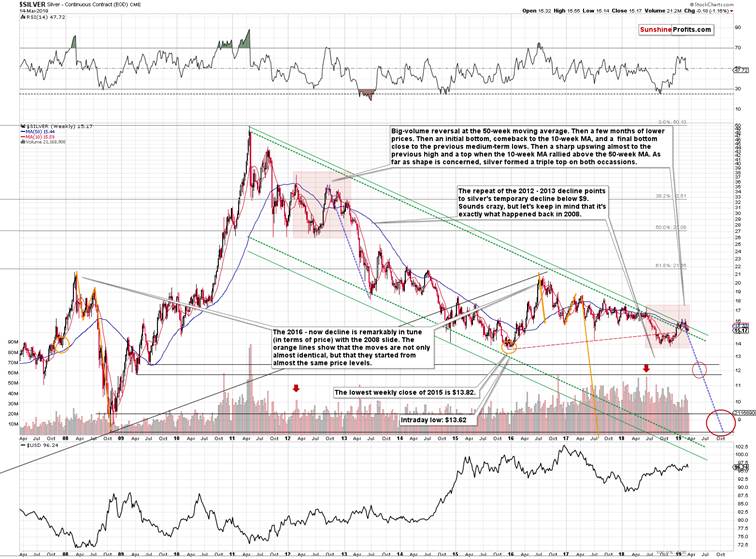
Silver’svery long-term chart also shows that nothing materially important changed evenwithout taking into account today’s pre-market decline. Silver once againinvalidated the small breakout above the long-term declining green resistanceline. Also our silverprice forecast remains very bearish for the medium term.
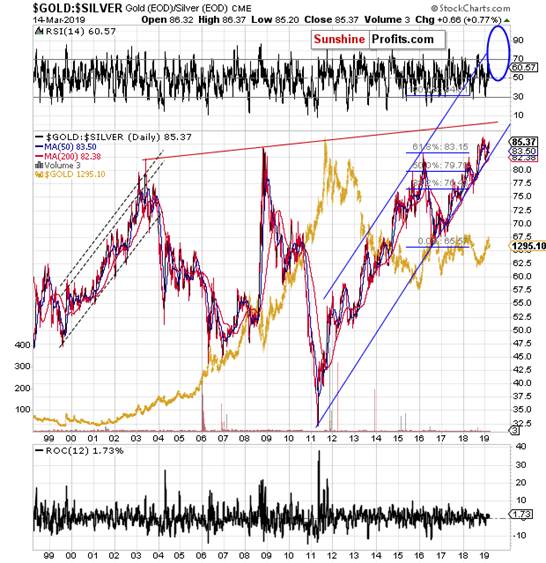
Therelative performance of both markets also continues to have bearishimplications. The gold to silver ratio is on the rise once again – as the briefcorrection after breaking above the previous highs has run its course. The true long-term resistance is at about 100level, so the ratio still has a long way to go before this level isreached. Since this ratio generally moves inversely to gold and silver prices,both metals are likely to decline.
Pleasenote that it’s not just the value of the ratio itself that suggests higherreadings – it’s the time factor as well. In the past two decades, there was noother case when the gold to silver ratio stayed so long above the 80 level. Allprevious attempts were invalidated rather quickly. This time, the ratio simplypulled back, but remained strong and rallied once again after bouncing off therising support line. The implications remain bullish for the ratio and bearishfor the PM prices for the next few months.
Oh,and by the way, it may seem like our target area is too close in terms of time,but please note how sharply the ratio did soar when it was close to 80. Suchsharpness is quite natural at those levels, so the above “daring” prediction isjustified.
We hope you enjoyed today’sanalysis, and we encourage you to sign up for our free newsletter. You’ll beupdated on our free articles on a daily basis, and you’ll get access to ourpremium Gold & Silver Trading Alerts for the first 7 days as a startingbonus. And yes, it’s free. Sign up today.
Thank you.
Przemyslaw Radomski, CFA
Founder, Editor-in-chief
Toolsfor Effective Gold & Silver Investments - SunshineProfits.com
Tools für EffektivesGold- und Silber-Investment - SunshineProfits.DE
* * * * *
About Sunshine Profits
SunshineProfits enables anyone to forecast market changes with a level of accuracy thatwas once only available to closed-door institutions. It provides free trialaccess to its best investment tools (including lists of best gold stocks and best silver stocks),proprietary gold & silver indicators, buy & sell signals, weekly newsletter, and more. Seeing is believing.
Disclaimer
All essays, research and information found aboverepresent analyses and opinions of Przemyslaw Radomski, CFA and SunshineProfits' associates only. As such, it may prove wrong and be a subject tochange without notice. Opinions and analyses were based on data available toauthors of respective essays at the time of writing. Although the informationprovided above is based on careful research and sources that are believed to beaccurate, Przemyslaw Radomski, CFA and his associates do not guarantee theaccuracy or thoroughness of the data or information reported. The opinionspublished above are neither an offer nor a recommendation to purchase or sell anysecurities. Mr. Radomski is not a Registered Securities Advisor. By readingPrzemyslaw Radomski's, CFA reports you fully agree that he will not be heldresponsible or liable for any decisions you make regarding any informationprovided in these reports. Investing, trading and speculation in any financialmarkets may involve high risk of loss. Przemyslaw Radomski, CFA, SunshineProfits' employees and affiliates as well as members of their families may havea short or long position in any securities, including those mentioned in any ofthe reports or essays, and may make additional purchases and/or sales of thosesecurities without notice.
Przemyslaw Radomski Archive |
© 2005-2019 http://www.MarketOracle.co.uk - The Market Oracle is a FREE Daily Financial Markets Analysis & Forecasting online publication.