Gold Hangs In There On Fear And Uncertainty At A Dangerous Time Of The Year
A new high last week.
Gold was crawling higher after breaking out.
Danger ahead if history repeats.
Higher rates are baked in the market.
The dollar poses the most significant risk.
Gold bulls had a rough summer in 2018. After making higher lows since late 2015, the price of the precious metal broke its bullish pattern in July when the price declined below the December 2017 low at $1236.50 per ounce.
Gold had made a low of $1046.20 in December 2015 as the U.S. central bank increased the short-term Fed Funds rate from zero to 25 basis points. A second interest rate hike came in December 2016 which caused the price of gold to fall to a higher low at $1123.90 after trading to a peak at $1377.50 in July in the aftermath of the Brexit referendum. In 2017, the Fed picked up the pace of rate hikes, but a move during the final month of the year sent the price of gold to a higher low at $1236.50 per ounce. In 2016 and 2017 the price of the precious metal never traded below the low from the previous December. However, in 2018 that changed, and gold fell to lows of $1161.40 per ounce in mid-August which ended the pattern of higher lows that had been in place since the 2015 bottom.
Recently, the price action in gold is getting more active as the price has recovered. Higher levels of price variance offer traders more opportunities to profit from increased trading ranges. The most direct route for trading gold is via the futures and futures options that trade on the COMEX division of the Chicago Mercantile Exchange. For those who do not participate in the volatile and highly-leveraged world of the futures arena, the Velocity Shares 3X Long Gold ETN product (UGLD) and its complementary product, the 3X Short Gold ETN (DGLD) bring the ability to trade the precious metal in standard equity accounts to a broader addressable market.
Gold was crawling higher after breaking out
After trading to a low of just over $1160 per ounce in mid-August of this year, gold rebounded to a high of $1220.70 on August 28, and established a trading range from that high to a low of $1184.30 until October 10. $1200 per ounce stood as a pivot point for the trading range that lasted for six weeks. 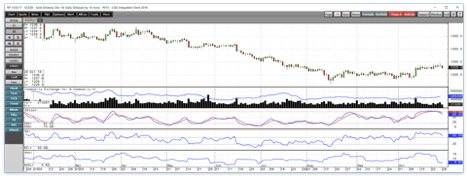
Source: CQG
As the daily chart of December COMEX gold futures highlights, the price broke to the upside and above the top end of the trading range on October 11. Open interest, the total number of open long and short positions in the futures market increased from 458,607 contracts on October 10 to 488,496 on October 26, a rise of 29,889 contracts or 6.5%. A rise in the metric alongside increasing price is typically a validation of a bullish move in a futures market. Price momentum and relative strength on the daily chart have risen to overbought territory. Daily historical volatility at 5.78% reflects the slow and steady move in the price of gold which has moved to a higher trading with a trajectory to the upside since October 11. However, this week got off on a bearish note with gold falling to a low of $1226.10 on Monday.
A new high last week
After the bearish price trend that took gold from $1365.40 in April to lows of $1161.40 on mid-August, the price has posted a gain over the past four consecutive weeks. 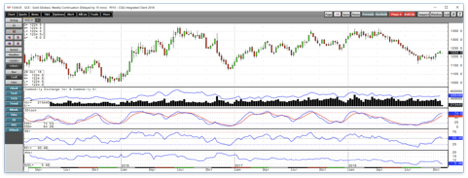
Source: CQG
As the weekly chart illustrates, gold put in a bullish key reversal trading pattern during the week of October 8 when it broke above the top end of its trading range. Last week, gold once again made a lower low than the prior week and closed at a level that was above the previous week's high. The second bullish reversal over the past three weeks led to a new high at $1238.60 on the nearby futures contract, and $1246 on the active month December contract on October 26.
The weekly chart shows that price momentum and relative strength are rising towards an overbought condition. Gold traded at the highest price since mid-July last week.
Danger ahead if history repeats
As the gold market heads into the final two months of 2018, the history of the past three years stands as a warning sign for the path of least resistance of the precious metal.
While patterns on charts are often made to be broken, the lows in December 2015, 2016, and 2017 could stand as a barrier to buying for many market participants. However, in the past years, gold did not break below the bottoms created during the final month of the previous year, but in 2018 that pattern did not hold. Time will tell if we will see another departure this year and gold will break its bearish trading pattern during the final month of the year.
Two factors could weigh on the price of gold over the coming weeks. The path of least resistance of short, medium, and long-term interest rates has weighed on the prices of many commodities over recent weeks and months, and gold is no exception. The dollar, which has a long-standing inverse price relationship with gold, is trading near its highest level of 2018 and is threatening to break to the upside on the dollar index.
Higher rates are baked in the market
One of the factors that pushed gold lower in July and August was the June FOMC meeting where the central bank told markets they planned to increase the pace of short-term interest rate hikes in 2018. The FOMC increased the number of 25 basis point rate increases from three to four which weighed on the price of gold in the weeks that followed the June meeting.
At the same time, the Fed has continued to allow the legacy of quantitative easing to roll off their swollen balance sheet that had risen to $4.5 trillion but is now declining. As purchases of government debt securities roll off, there is a natural upward pressure on rates and downside pressure on bonds with medium and long-term maturities. The bottom line is that while the Fed continues to increase short-term rates, longer-term rates are moving higher at the same time. The most recent economic data that told the central bank GDP growth was at 3.5% in Q3. A continuation of economic growth presents a validation for a fourth rate hike at their December meeting. The market expects the Fed to act which will come as no surprise to the gold market. However, increasing rates raise the cost of financing inventories and the cost of holding a long position in gold. The contango or forward premium in the gold futures market reflects interest rates, storage, and insurance rates. Therefore, the cost of rolling a long position in gold from month to month on the futures exchange rises with interest rates which could weigh on the price of the metal. Higher real rates and a low rate of inflation tends to be a bearish environment for gold. Meanwhile, when rates rise because inflationary pressures are eating away at the value of money, the price of gold tends to move higher.
Higher interest rates in the U.S. also are supportive of gains in the value of the U.S. dollar.
The dollar poses the most significant risk
The dollar index appears to be moving towards a challenge of the mid-August high on the dollar index at 96.865 as of Friday, October 2. 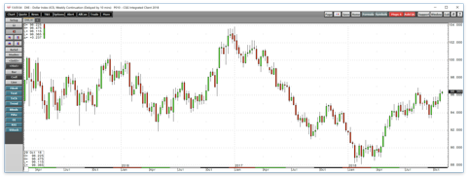
Source: CQG
The dollar index settled at the 96.128 level on the December futures contract last Friday after trading to a high of 96.62 during the week. On Monday, the index moved to a high of 96.475 which put pressure on the price of gold. Rising interest rates in the U.S. are causing the dollar to rally against the euro and other world currencies. The euro accounts for 57% of the dollar index. With rates likely to rise to 2.25-2.50% by the end of 2018 and European rates at the negative 40 basis point level, the differential between the short-term rates will rise to 2.65-2.90% by the end of this year.
One of the primary factors when it comes to the path of least resistance of foreign exchange rates is the yields on currencies. As we head into November, the dollar index is trading at close to the level where it was in mid-August when gold was on its low. The inverse historical relationship between gold and the dollar stands as a reason for caution in the precious metal over the coming days and weeks.
The technical picture for the gold market looks bullish. The paths of least resistance for both interest rates and the dollar look bearish. A combination of factors to lead to an increase in gold volatility over the coming weeks. The pattern of higher lows broke this summer, and now we will find out if the pattern of December lows in the gold market will remain intact or the precious metal will negate another pattern that has been in place since late 2015.
The Velocity Shares 3X Long Gold ETN product (UGLD) and its complementary product, the 3X Short Gold ETN (DGLD) could be excellent tools when it comes to approaching a volatile gold market over the coming days and weeks. The fund summary for UGLD states:
"The investment seeks to replicate, net of expenses, three times the S&P GSCI Gold index. The index comprises futures contracts on a single commodity. The fluctuations in the values of it are intended generally to correlate with changes in the price of gold in global markets."
The instrument uses leverage to create its triple-gearing via the futures and options markets. The inverse DGLD product does the same thing on the downside via short positions in the gold market to create the leverage. The leverage means that both the bullish and bearish instruments suffer from decay over time and makes them only appropriate for short-term positions in the gold market on the long and short side of the market.
Gold rallied from a low of $1194.70 on October 11 to a high of $1246 on October 26 on the December futures contract, a rise of 4.3%. 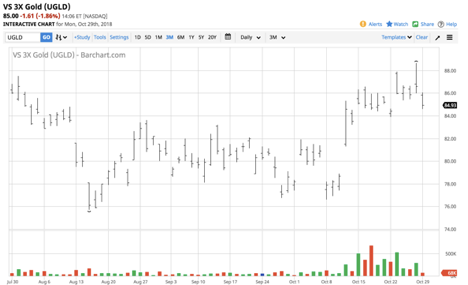
Source: Barchart
Over the same period, UGLD moved from $81.30 to $88.65, a rally of 9%. UGLD underperformed its goal to deliver a triple return. 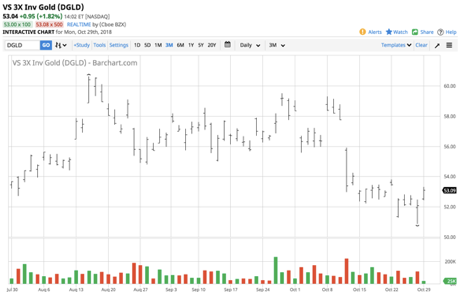
Source: Barchart
Meanwhile, DGLD fell from $55.90 to $50.87 over the same period, a drop of 9%, so the bearish product suffered less than a 3X loss over the period.
UGLD and DGLD have net assets of $124.57 million and $20.52 million respectively. UGLD trades an average of 114,473 shares each day while DGLD's average is 92,576 shares making them liquid market products. As with all leveraged ETF and ETN products, UGLD and DGLD are susceptible to reverse splits over time because of the impact of decay on the leveraged products. Both are only appropriate for short-term trading purposes.
Bullish and bearish factors are pulling gold in opposite directions as we head into the final two months of 2018. Trading rather than investing could offer the optimal results in the gold market over the coming weeks. For those who do not wade into the shark-infested waters of the futures arena, UGLD and DGLD could offer a leveraged alternative for nimble traders with their fingers on the pulse of the gold market.
The Hecht Commodity Report is one of the most comprehensive commodities reports available today from the #2 ranked author in both commodities and precious metals. My weekly report covers the market movements of 20 different commodities and provides bullish, bearish and neutral calls; directional trading recommendations, and actionable ideas for traders. More than 120 subscribers are deriving real value from the Hecht Commodity Report.
Disclosure: I/we have no positions in any stocks mentioned, and no plans to initiate any positions within the next 72 hours.
I wrote this article myself, and it expresses my own opinions. I am not receiving compensation for it (other than from Seeking Alpha). I have no business relationship with any company whose stock is mentioned in this article.
Additional disclosure: The author always has positions in commodities markets in futures, options, ETF/ETN products, and commodity equities. These long and short positions tend to change on an intraday basis.
Follow Andrew Hecht and get email alerts