Gold Has The Potential To Go Parabolic
The Fed lights the fuse.
Gold breaks out to the upside on the long-term chart.
Gold is rallying in all currencies.
UGLD magnifies the price action in gold.
I find that for me, being a history buff makes it almost impossible not to be a believer in the metal that has been a fixture and sign of value and wealth since ancient times. I am a gold bug and have been since I first started in the commodities business in the early 1980s. There is no other asset that gives a person the same feeling than gold. Holding a kilo bar of the yellow metal is a feeling that no other investment can elicit. Even when the price was trading at $300 per ounce or below, the bar was worth almost $10,000. In those days, I would think to myself; I'd rather have that bar in my hand than a stack of one hundred, one hundred dollar bills. On June 27, at the $1408 per ounce level, that bar is worth over $45,000, and I'd still rather have it than the cash it represents.
As humans, we can never own gold; we pay to hold it for our lifetime because all of the gold ever mined in the history of the world still exists. Currencies come and go, and the note could never do for me what gold does. The gold market traded in a $331.30 range from December 2015 through June 19, 2019. The range was in place since April 2014, for over one-half of one decade. Last week, gold moved outside of the band, and now it looks like it could be on the verge of a parabolic move to the upside. If gold is going a lot higher in the short term, the VelocityShares 3X Long Gold ETN product (UGLD) will magnify the price action for nimble traders looking for a leveraged instrument to turbocharge what could be the next leg in a bull market that started in the early 2000s.
The Fed lights the fuse
On June 19, the US Federal Reserve at the June FOMC meeting told markets that the chances of declines in the short-term Fed Funds rate are on the horizon before the end of 2019. The central bank cited the low level of inflation, according to the data they watch, and "crosscurrents" from Europe and China that are weighing on global economic growth. The ongoing trade dispute between the US and China has caused weakness in the Chinese economy as tariffs and retaliatory measures have hurt China more than the US.
Last year, the US Fed hiked the Fed Funds rate a total of four times that boosted the short-term rate by a full percentage point to the 2.25-2.50% level. While they guided at the June meeting, the central bank did not act as the trade summit between President Trump and Xi will take place this coming Saturday, June 29. It appears that the Fed wanted to wait in case the two leaders come to a surprise agreement that would jump-start the global economy, removing some of the "crosscurrents."
Since the US has the world's leading economy and the dollar is a dominant reserve currency, the move by the Fed has global ramifications. Commodities are global assets, and the move by the central bank is bullish for raw material prices on two fronts. Lower rates reduce the cost of carrying commodities inventories and long positions. At the same time, falling rates in the US weigh on the value of the dollar versus other world currencies. 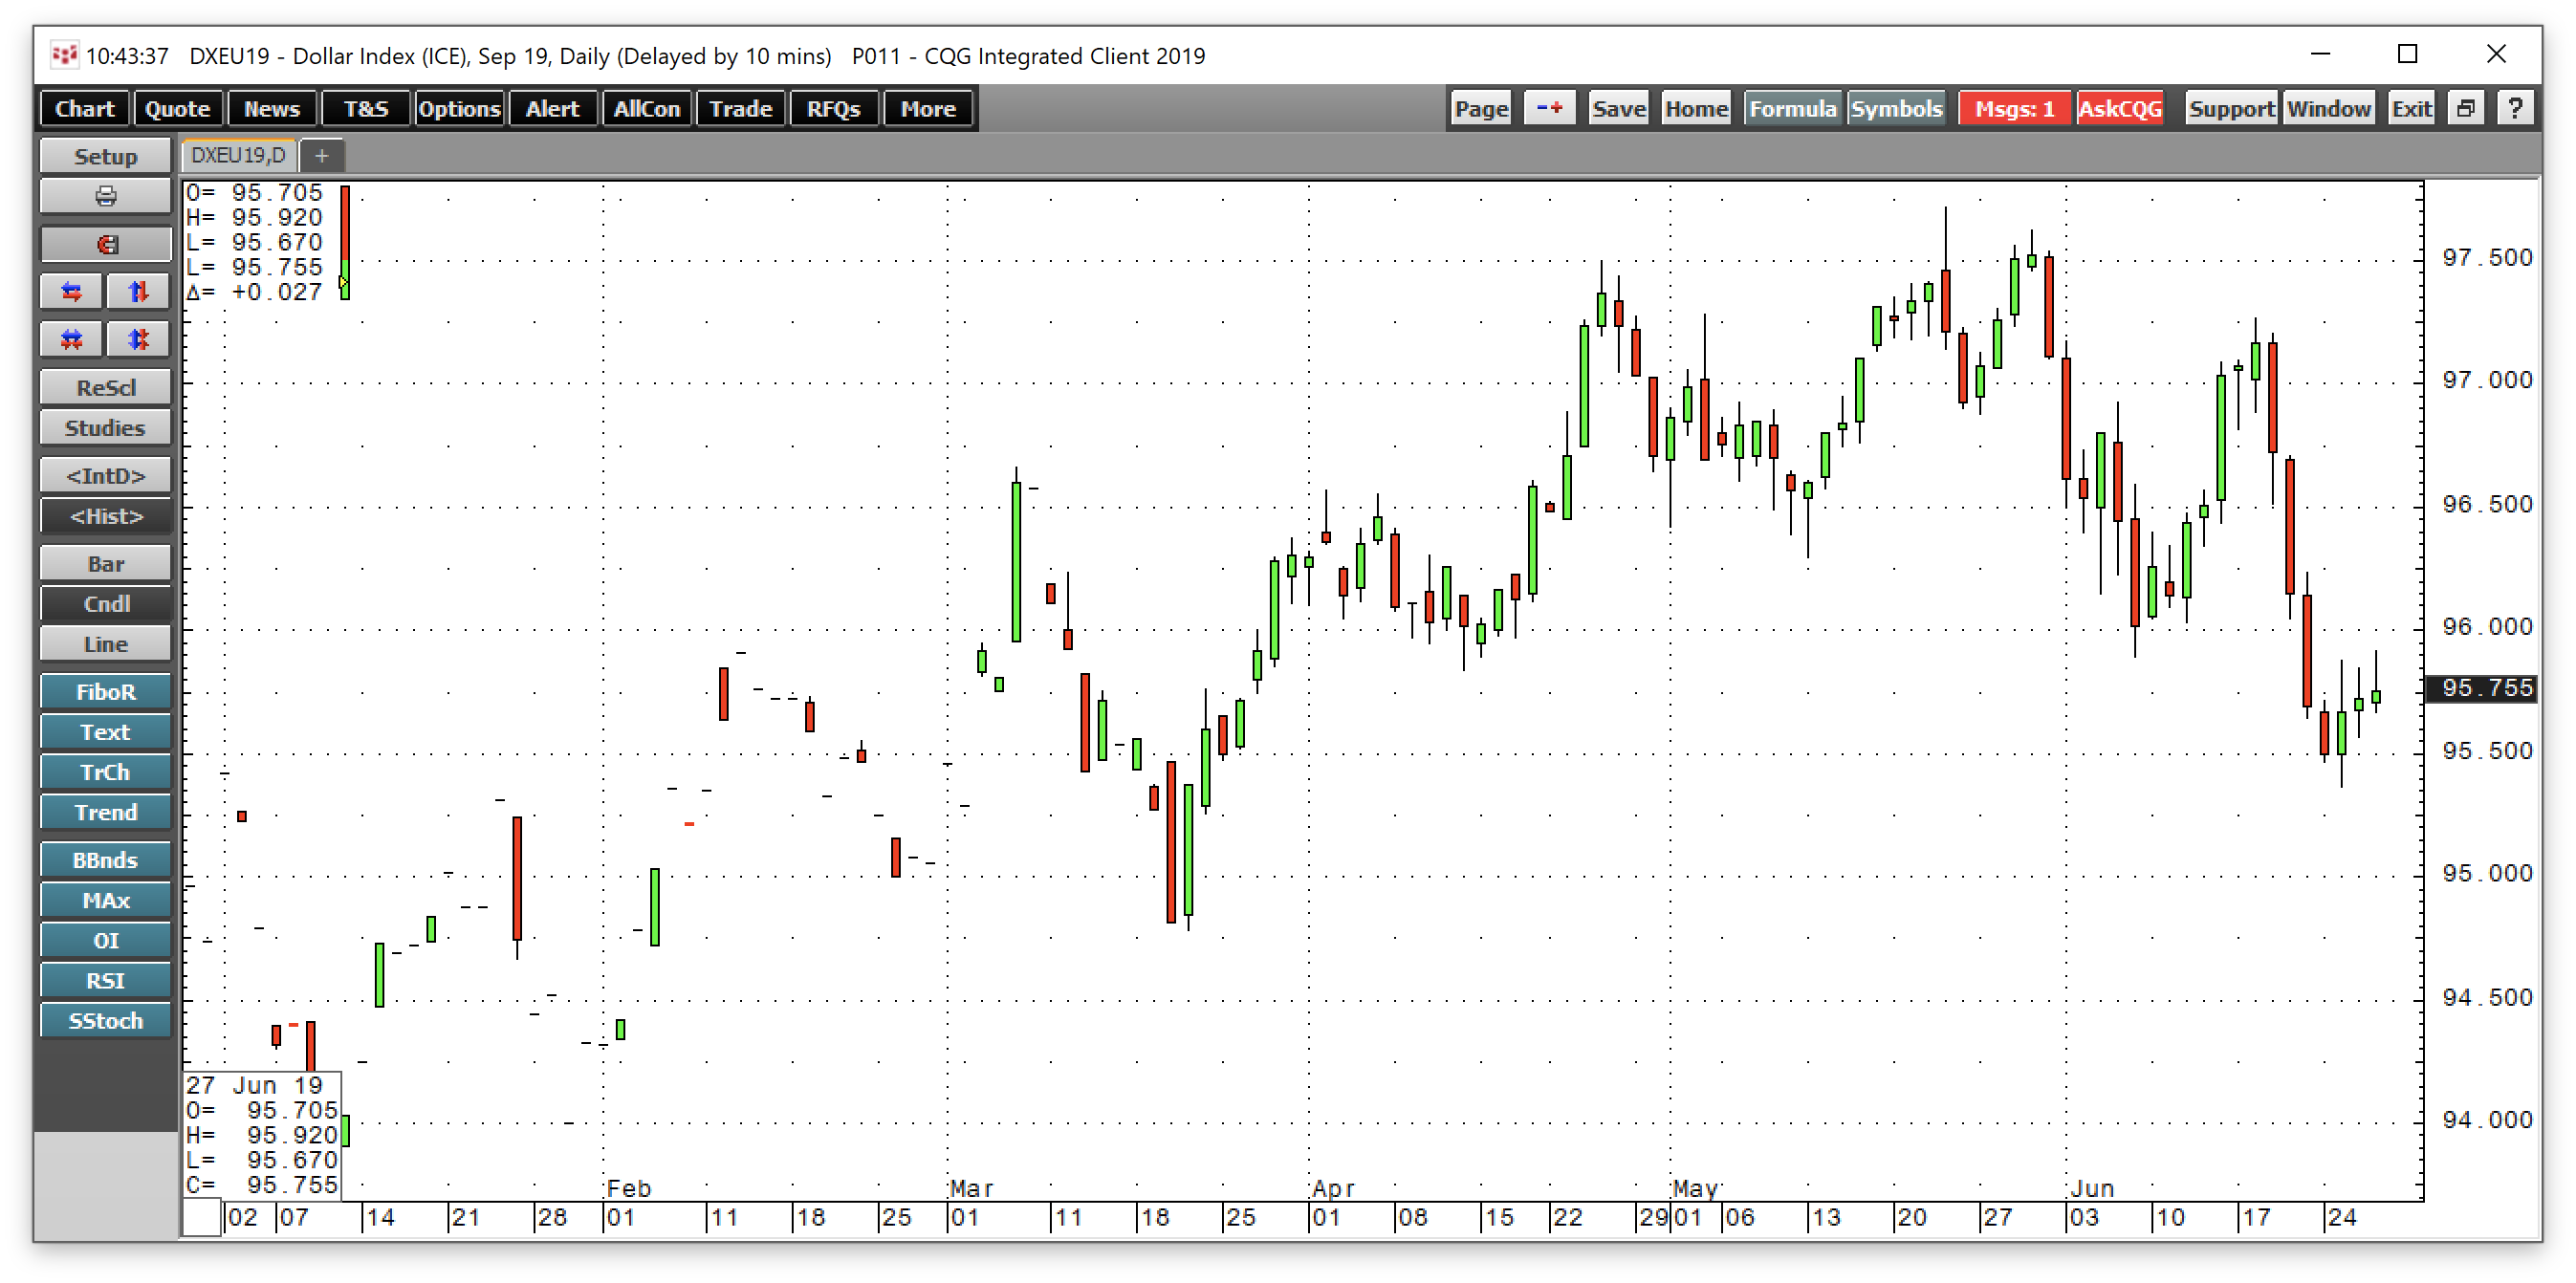
Source: CQG
As the daily chart of the September dollar index futures contract highlights, the index traded to a high at 97.265 on June 18, the day before the most recent Fed meeting. The greenback fell following the news of lower rates reaching a low at 95.365 on June 25, a decline of 1.95%. Since then it had edged higher but remained below the 96 level as of June 27. The prospects for lower rates and a falling dollar caused many commodity prices to move to the upside in the aftermath of the Fed meeting. Gold is a leader in the asset class, and the Fed's guidance lit a bullish fuse under the price of the yellow metal.
Gold breaks out to the upside on the long-term chart
The two critical levels of technical resistance in the gold market going into the Fed's June meeting stood at the 2018 double-top at $1365.40 and the July at $1377.50 per ounce, the highest level for the precious metal since March 2014. 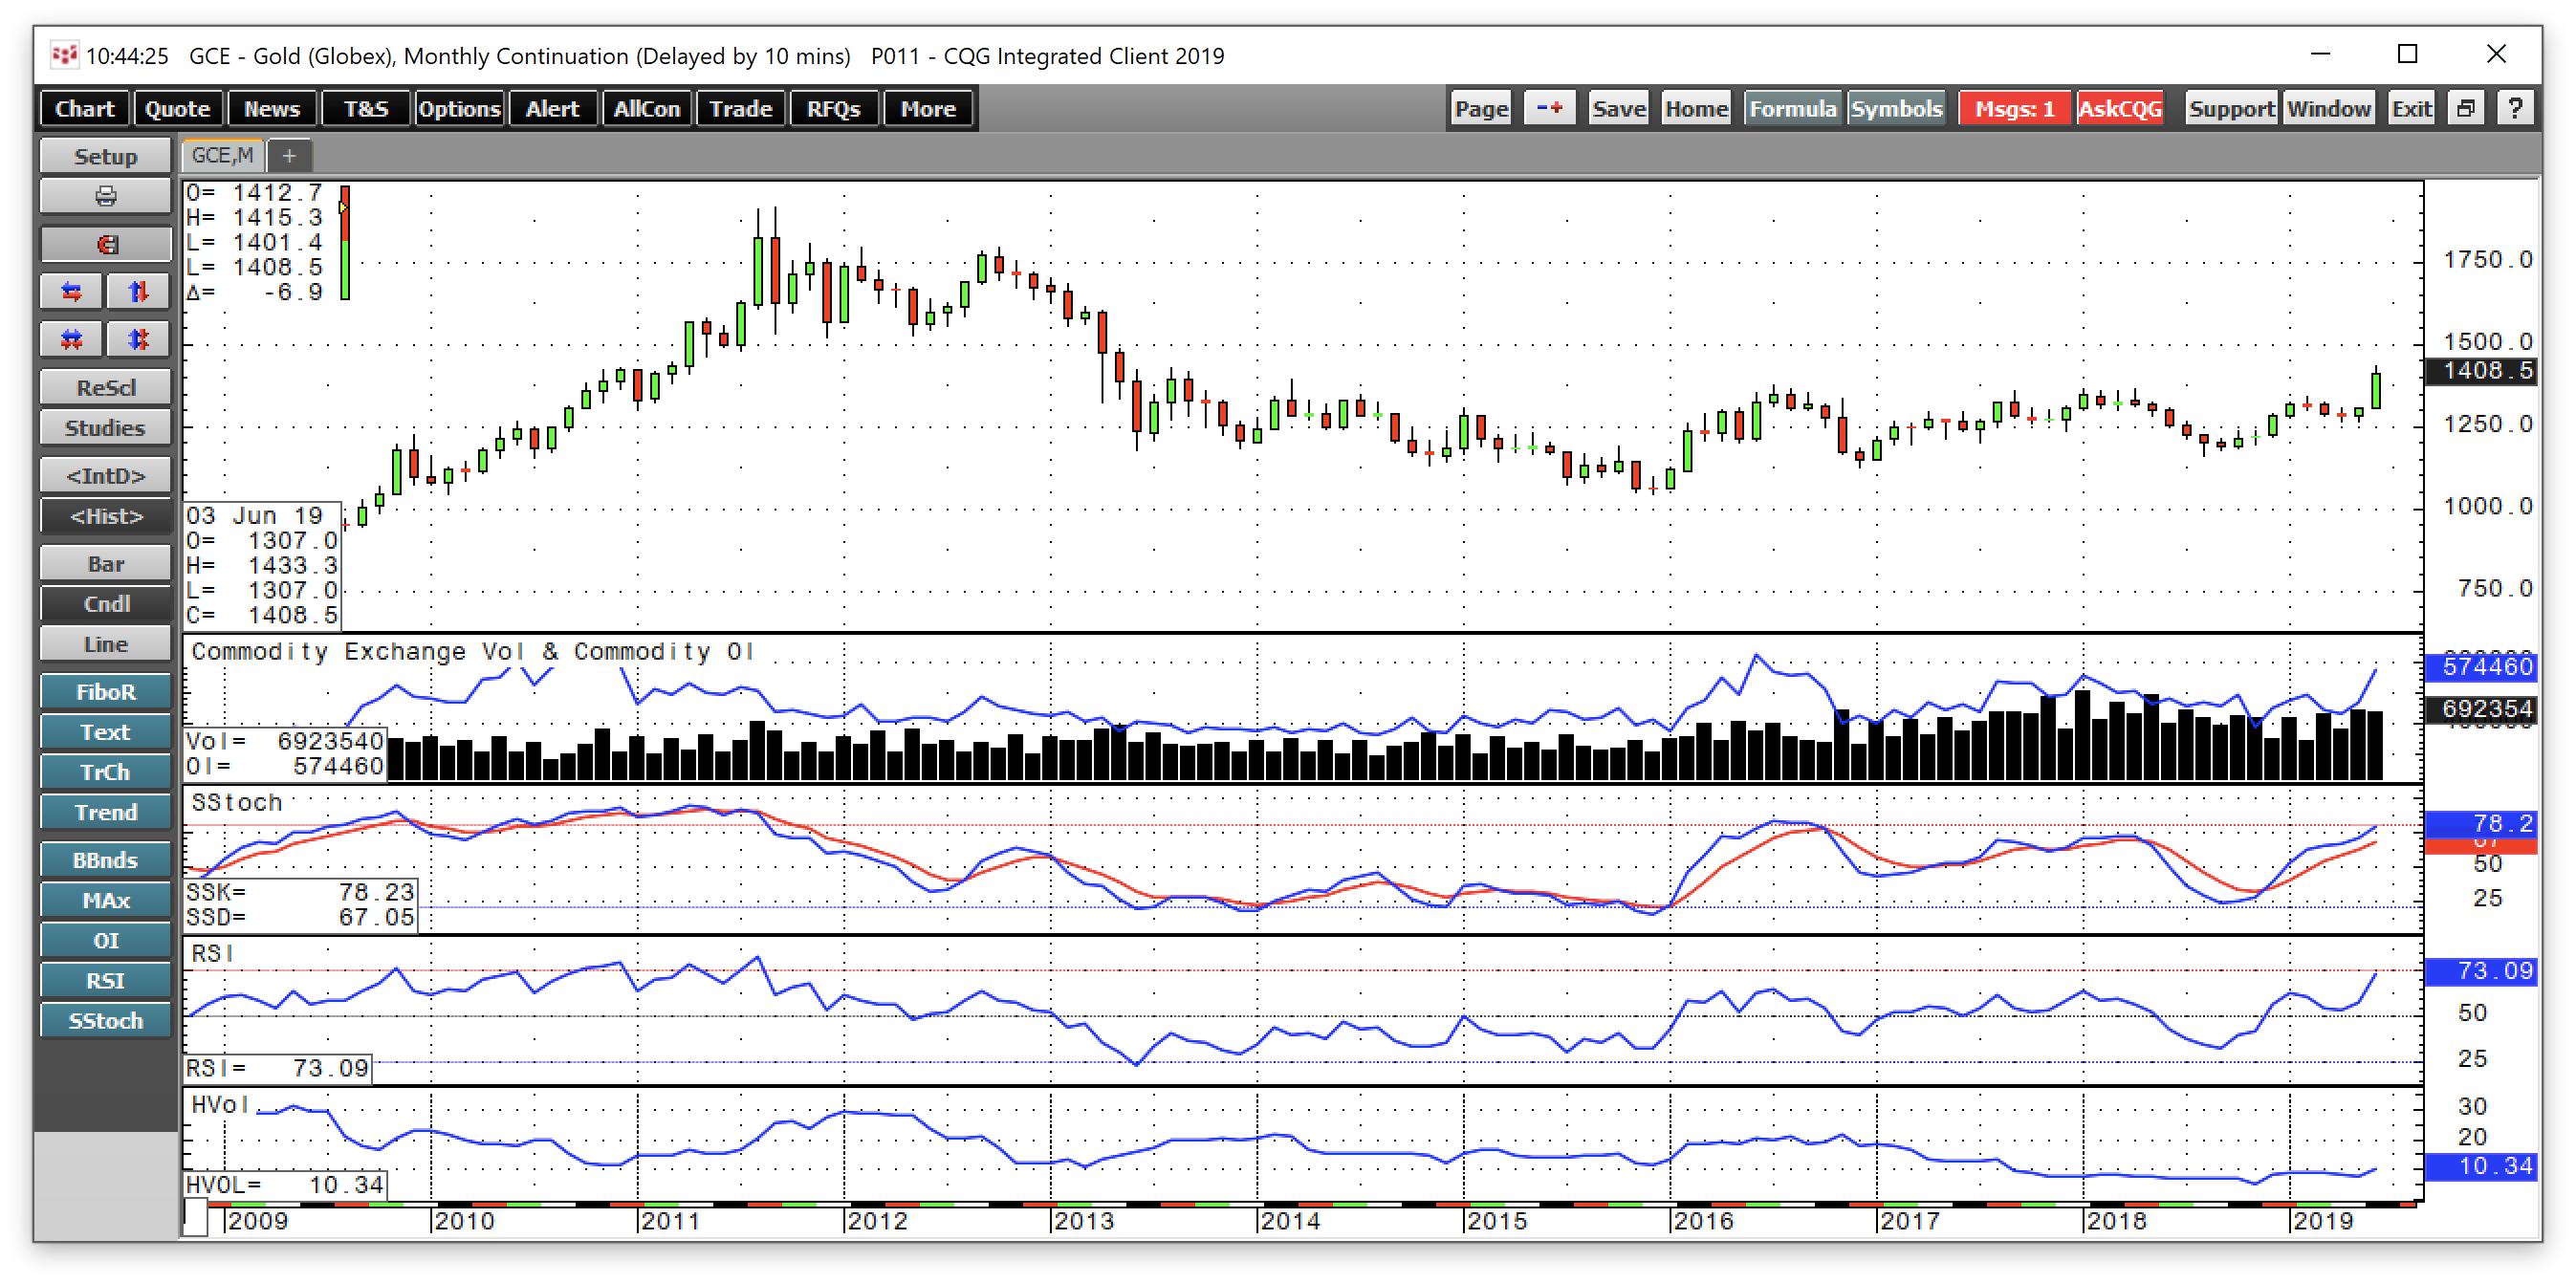
Source: CQG
The monthly chart shows that the price of gold blew through the resistance levels from 2018 and 2016 like a hot knife through butter in the aftermath of the Fed's guidance. The yellow metal rose to a high at $1433.30 on June 25, which was above another technical resistance level dating back to August 2013 at $1428 per ounce. Gold rallied alongside an increase in open interest, which is typically a validation of a bullish trend in a futures market. At the same time, both price momentum and relative strength metrics have risen into overbought territory on the long-term chart. However, monthly historical volatility at 10.32% indicates that the move to the upside has been steady, but there have not been any price spikes that would cause the metric to move to the upside. The next technical level on the upside now stands at the 2012 peak at $1794.80 per ounce.
The rally in gold to the highest price since 2013 has turned resistance levels into support. The new level to watch on the downside is the $1377.50 level, which should attract buying during any corrective moves in the price of the precious metal.
Gold is rallying in all currencies
While a weaker dollar tends to be bullish for the price of gold given the long-term inverse relationship between the greenback and yellow metal, gold has been moving to the upside against all world currencies. The all-time high in gold in dollar terms came in 2011 at $1920.70 per ounce. At the $1408 level on the continuous contract on June 27, the price is over 36% below its record peak. Meanwhile, gold is a lot closer to record levels in other currency terms. 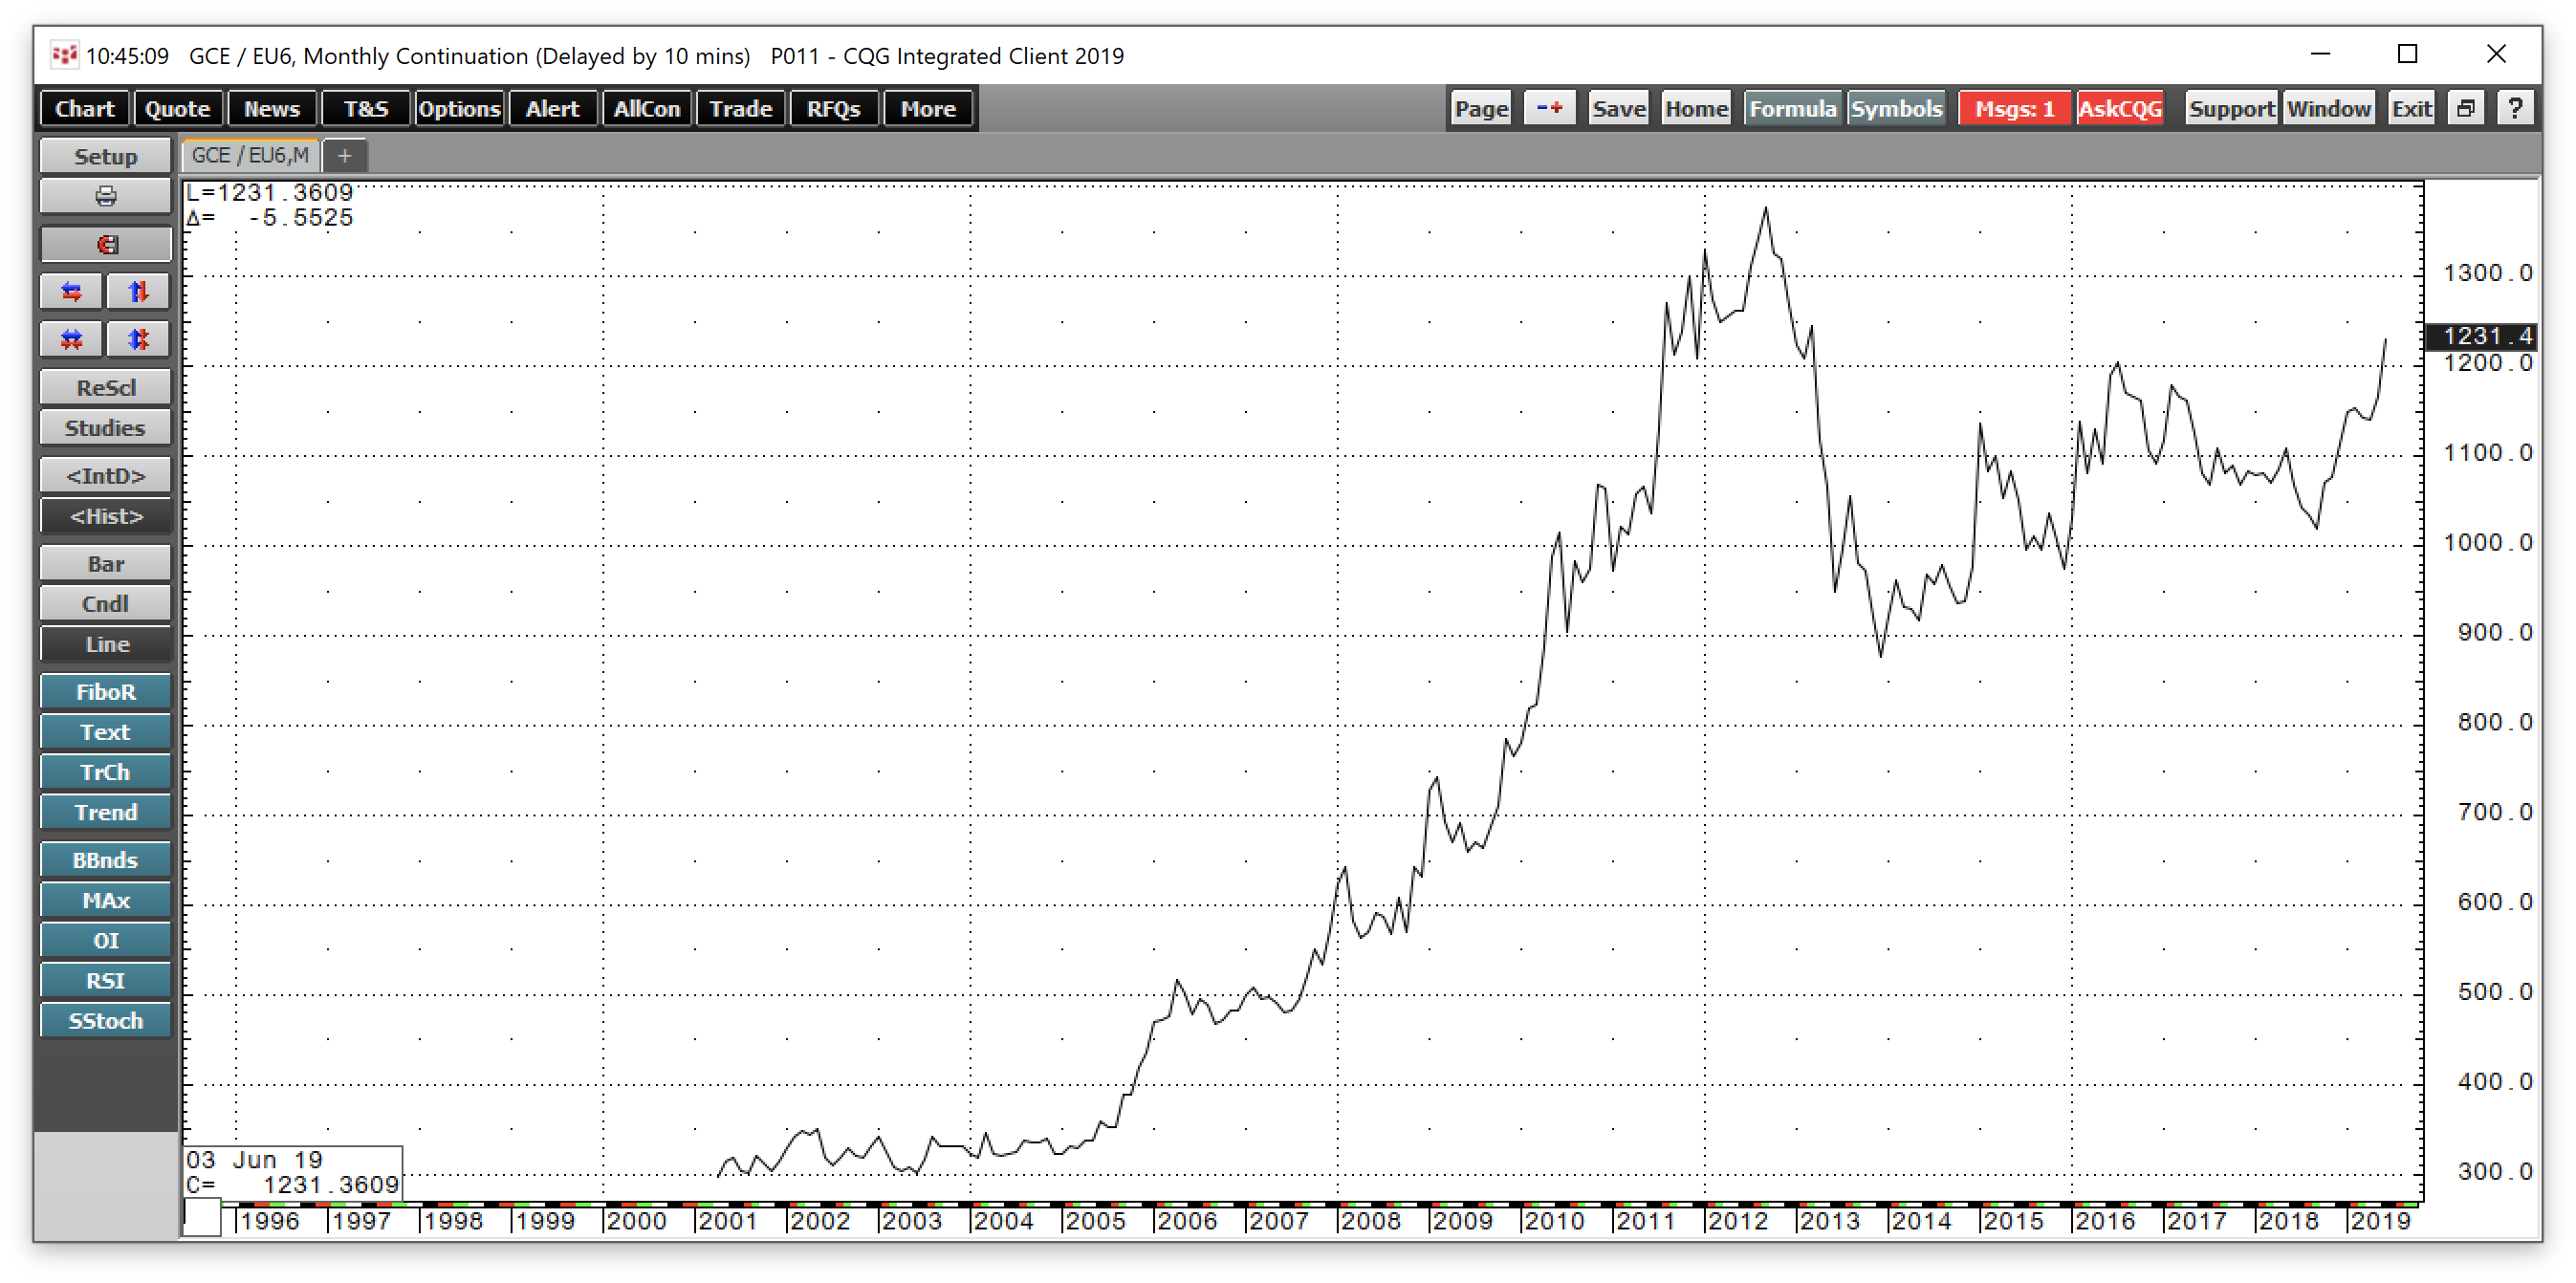
Source: CQG
As the chart shows, gold in euro currency terms was at the E1231.20 level on June 27 with the record peak from 2012 at E1377, around 11.8% above the current price level. 
Source: CQG
At Y150,870 on June 27, gold is only 1.05% below its all-time high at Y152,457 in 2013 in Japanese yen terms. 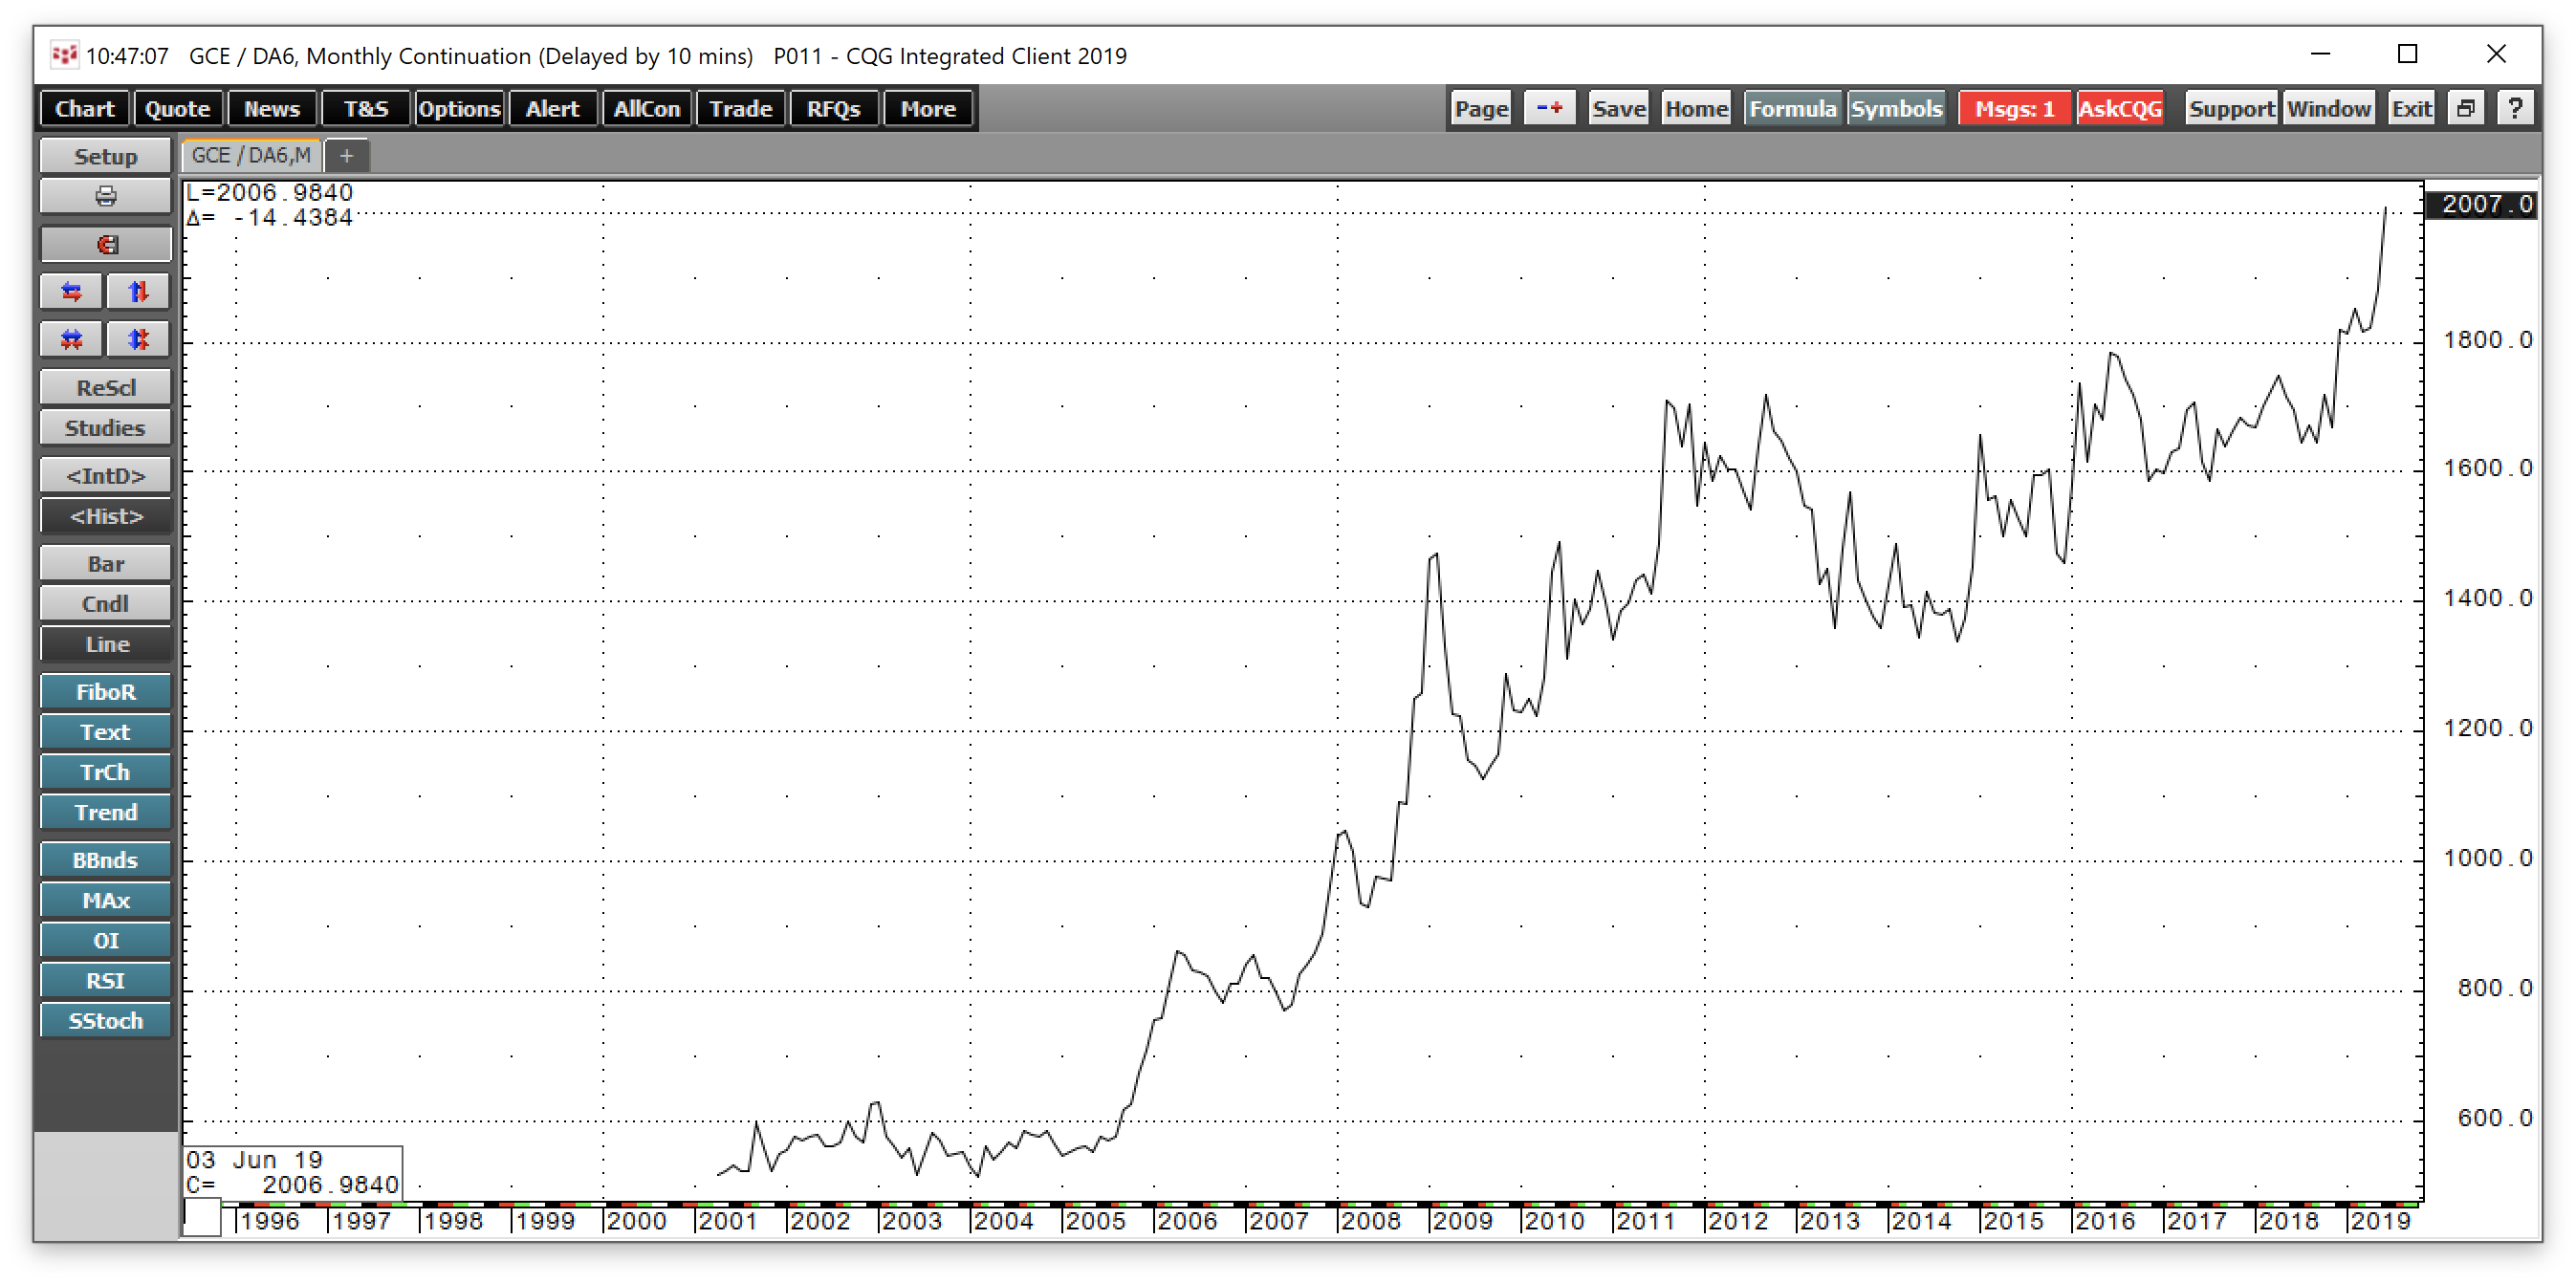
Source: CQG
The monthly chart shows that gold has already surged to a new record level against the Australian dollar at over A$2000 per ounce. The same holds for many other currencies around the world. The Chinese devaluation of the yuan has also put gold at a new all-time peak in yuan terms.
The rise of the price of gold in fiat currencies and the bullish trend that has been in place since the early 2000s is a commentary on the faith and value of legal tender instruments around the world. The dollar, euro, yen, and all other fiat currencies derive their value from full faith and credit of the governments that print the money. Gold is telling us that confidence is evaporating for fiat currencies, and that is nothing new. The only thing that changed recently is that the markets are experiencing another leg to the upside in the gold market and another devaluation of the value of currencies compared to gold.
In another sign of the deteriorating faith in traditional fiat currency instruments, the price of bitcoin has taken off to the upside. 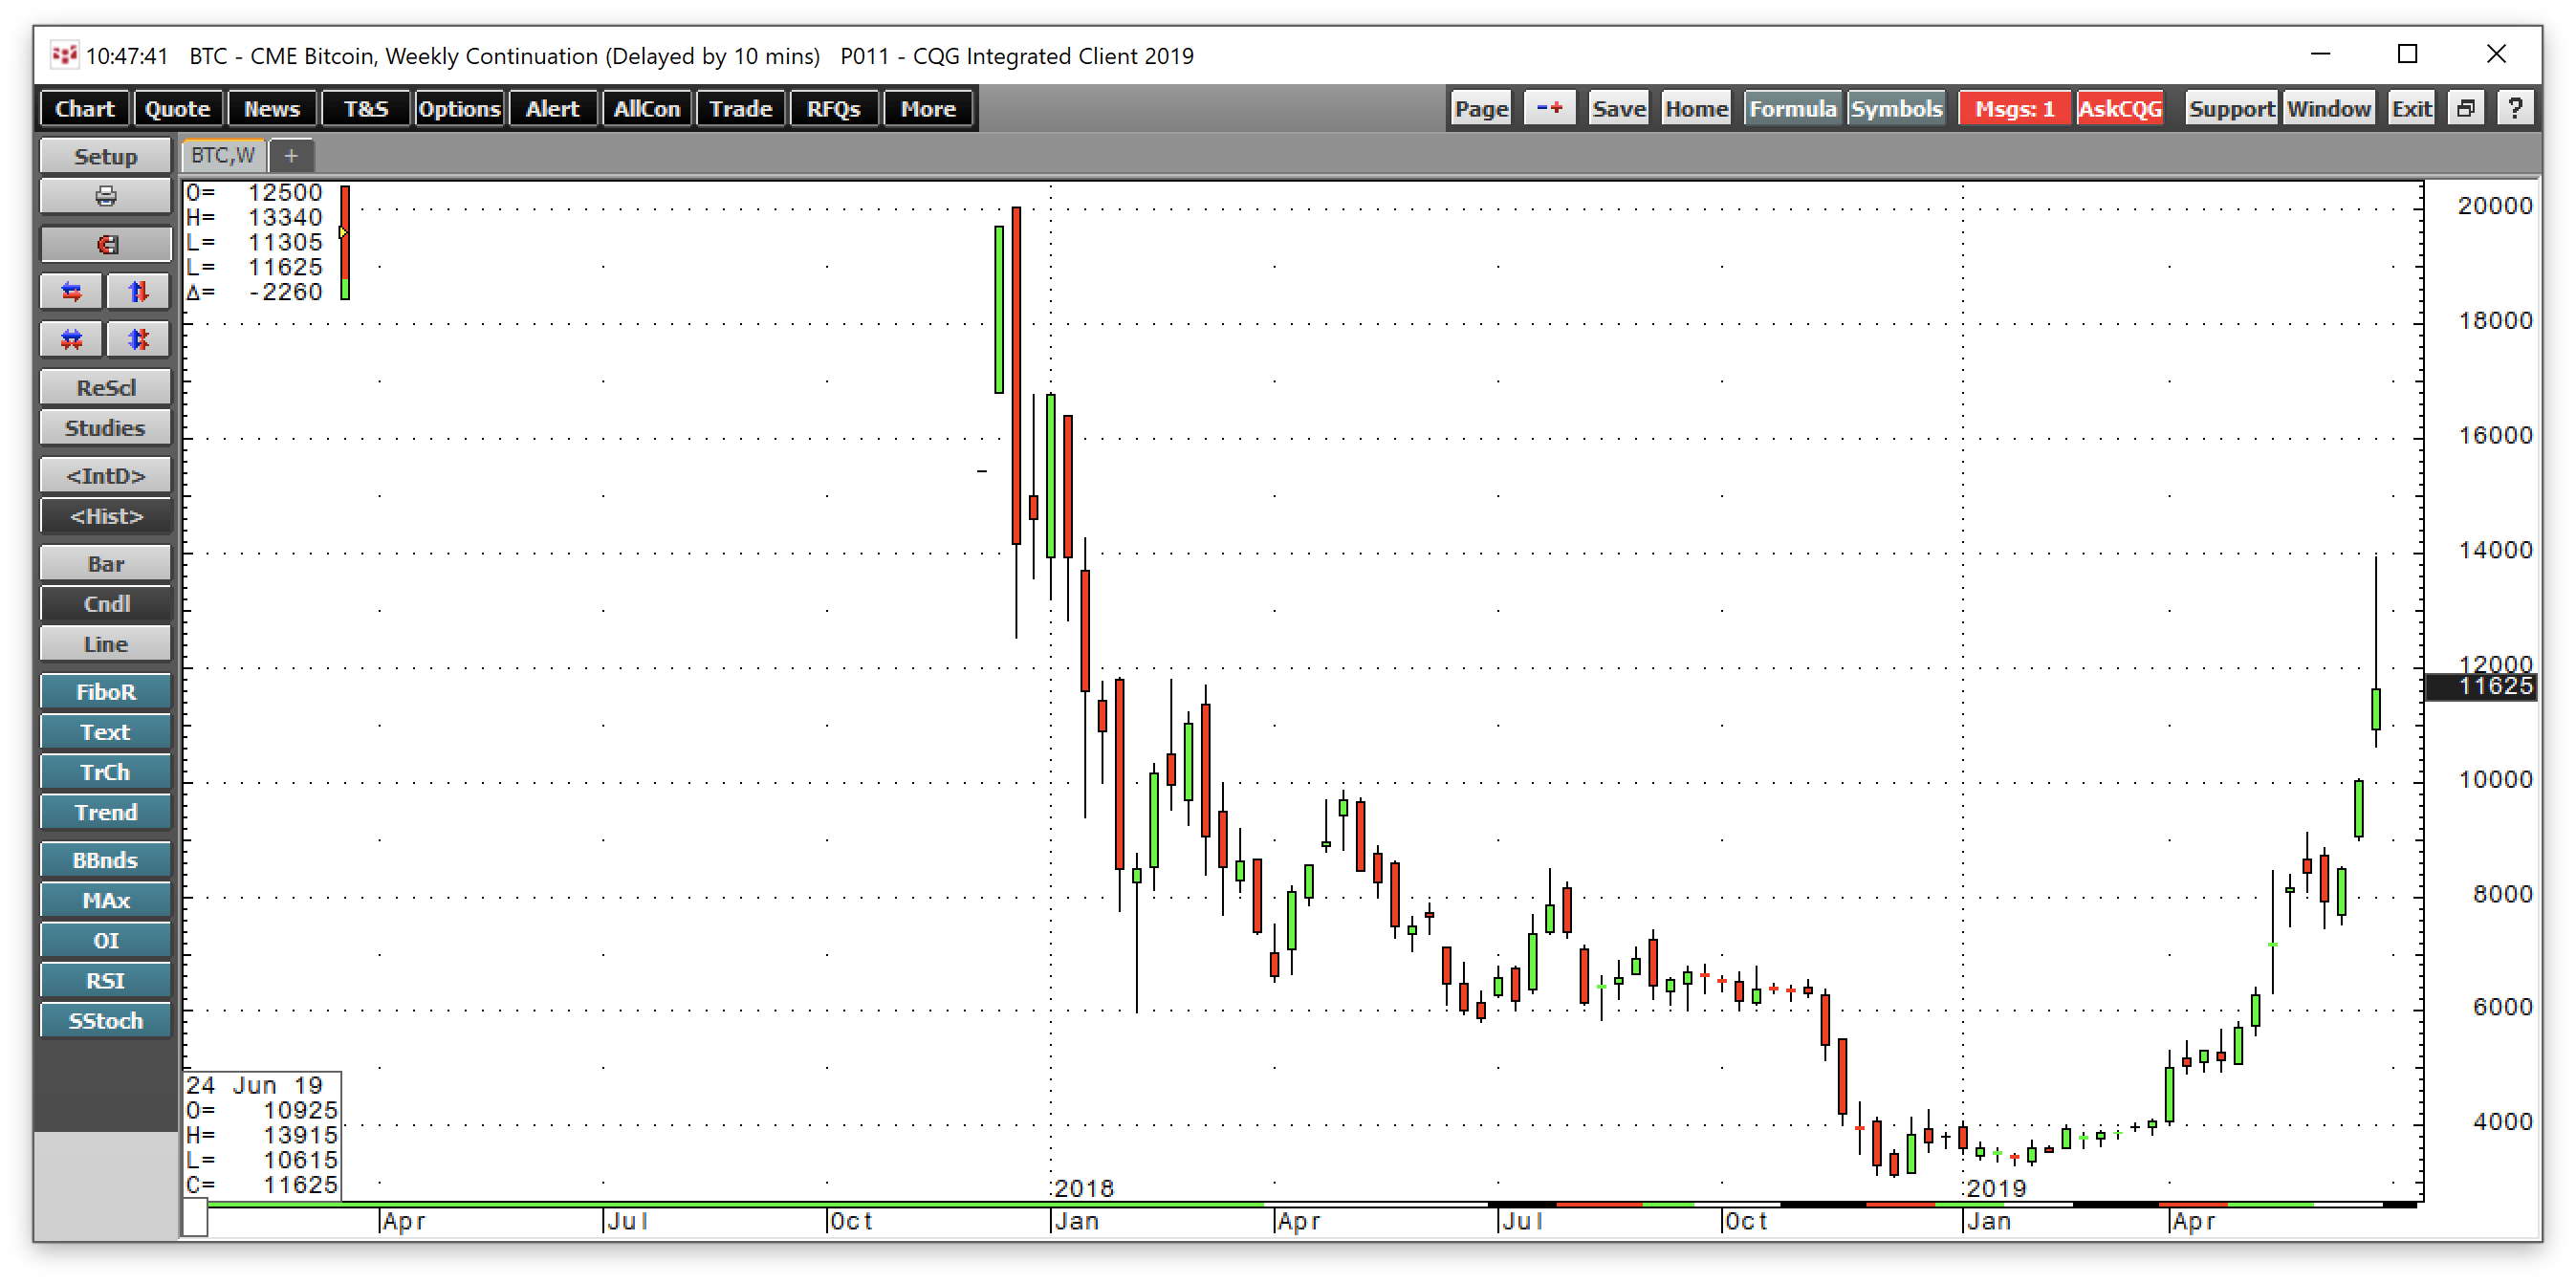
Source: CQG
As the weekly chart of CME Bitcoin futures shows, the price of the digital currency hit a low at $3300 earlier this year and was trading at $11,625 on June 27 after surging to a high at $13,915 earlier in the week. Bitcoin had over quadrupled in value since early 2019 at the high.
A pullback could be nasty, but it would be a buying opportunity
With gold in overbought territory, there are two possibilities over the coming days and weeks. If the Fed ignited a bullish fuse, and the technical break above the 2016 high in dollar-based gold is a significant technical event that attracts herds of buyers to the gold market, we could continue to see higher levels and perhaps, a parabolic move to the upside leading to a blow-off top for the yellow metal. I would not be surprised to wake up one morning and find the price of the yellow metal surged $100 per ounce or higher. However, the overbought condition could result in a corrective move, but buyers will likely appear at the $1377.50 per ounce breakout level in the gold market. Working a trailing stop on long positions in gold is probably a good idea in the current environment. However, if a quick and nasty correction takes the price back to the $1370-1390 level, it could present a golden buying opportunity for those with the courage to stand up and buy the yellow metal given the long-term trend.
UGLD magnifies the price action in gold
If gold is going to continue its ascent, we could be on the verge of a rally that may shock even the most devoted bull. The VelocityShares 3X Long Gold ETN product is an instrument that will act as gold on steroids if the price of the yellow metal continues to appreciate. The fund summary for UGLD states:
The investment seeks to replicate, net of expenses, three times the S&P GSCI Gold index ER. The index comprises futures contracts on a single commodity. The fluctuations in the values of it are intended generally to correlate with changes in the price of gold in global markets.
UGLD has net assets of $111.55 million, trades an average of 84,068 shares each day, and charges an expense ratio of 1.35%. The price of gold rallied from $1274.60 on May 21 to its most recent high at $1442.90 on June 25, a move of 13.2% on the active month August COMEX futures contract. 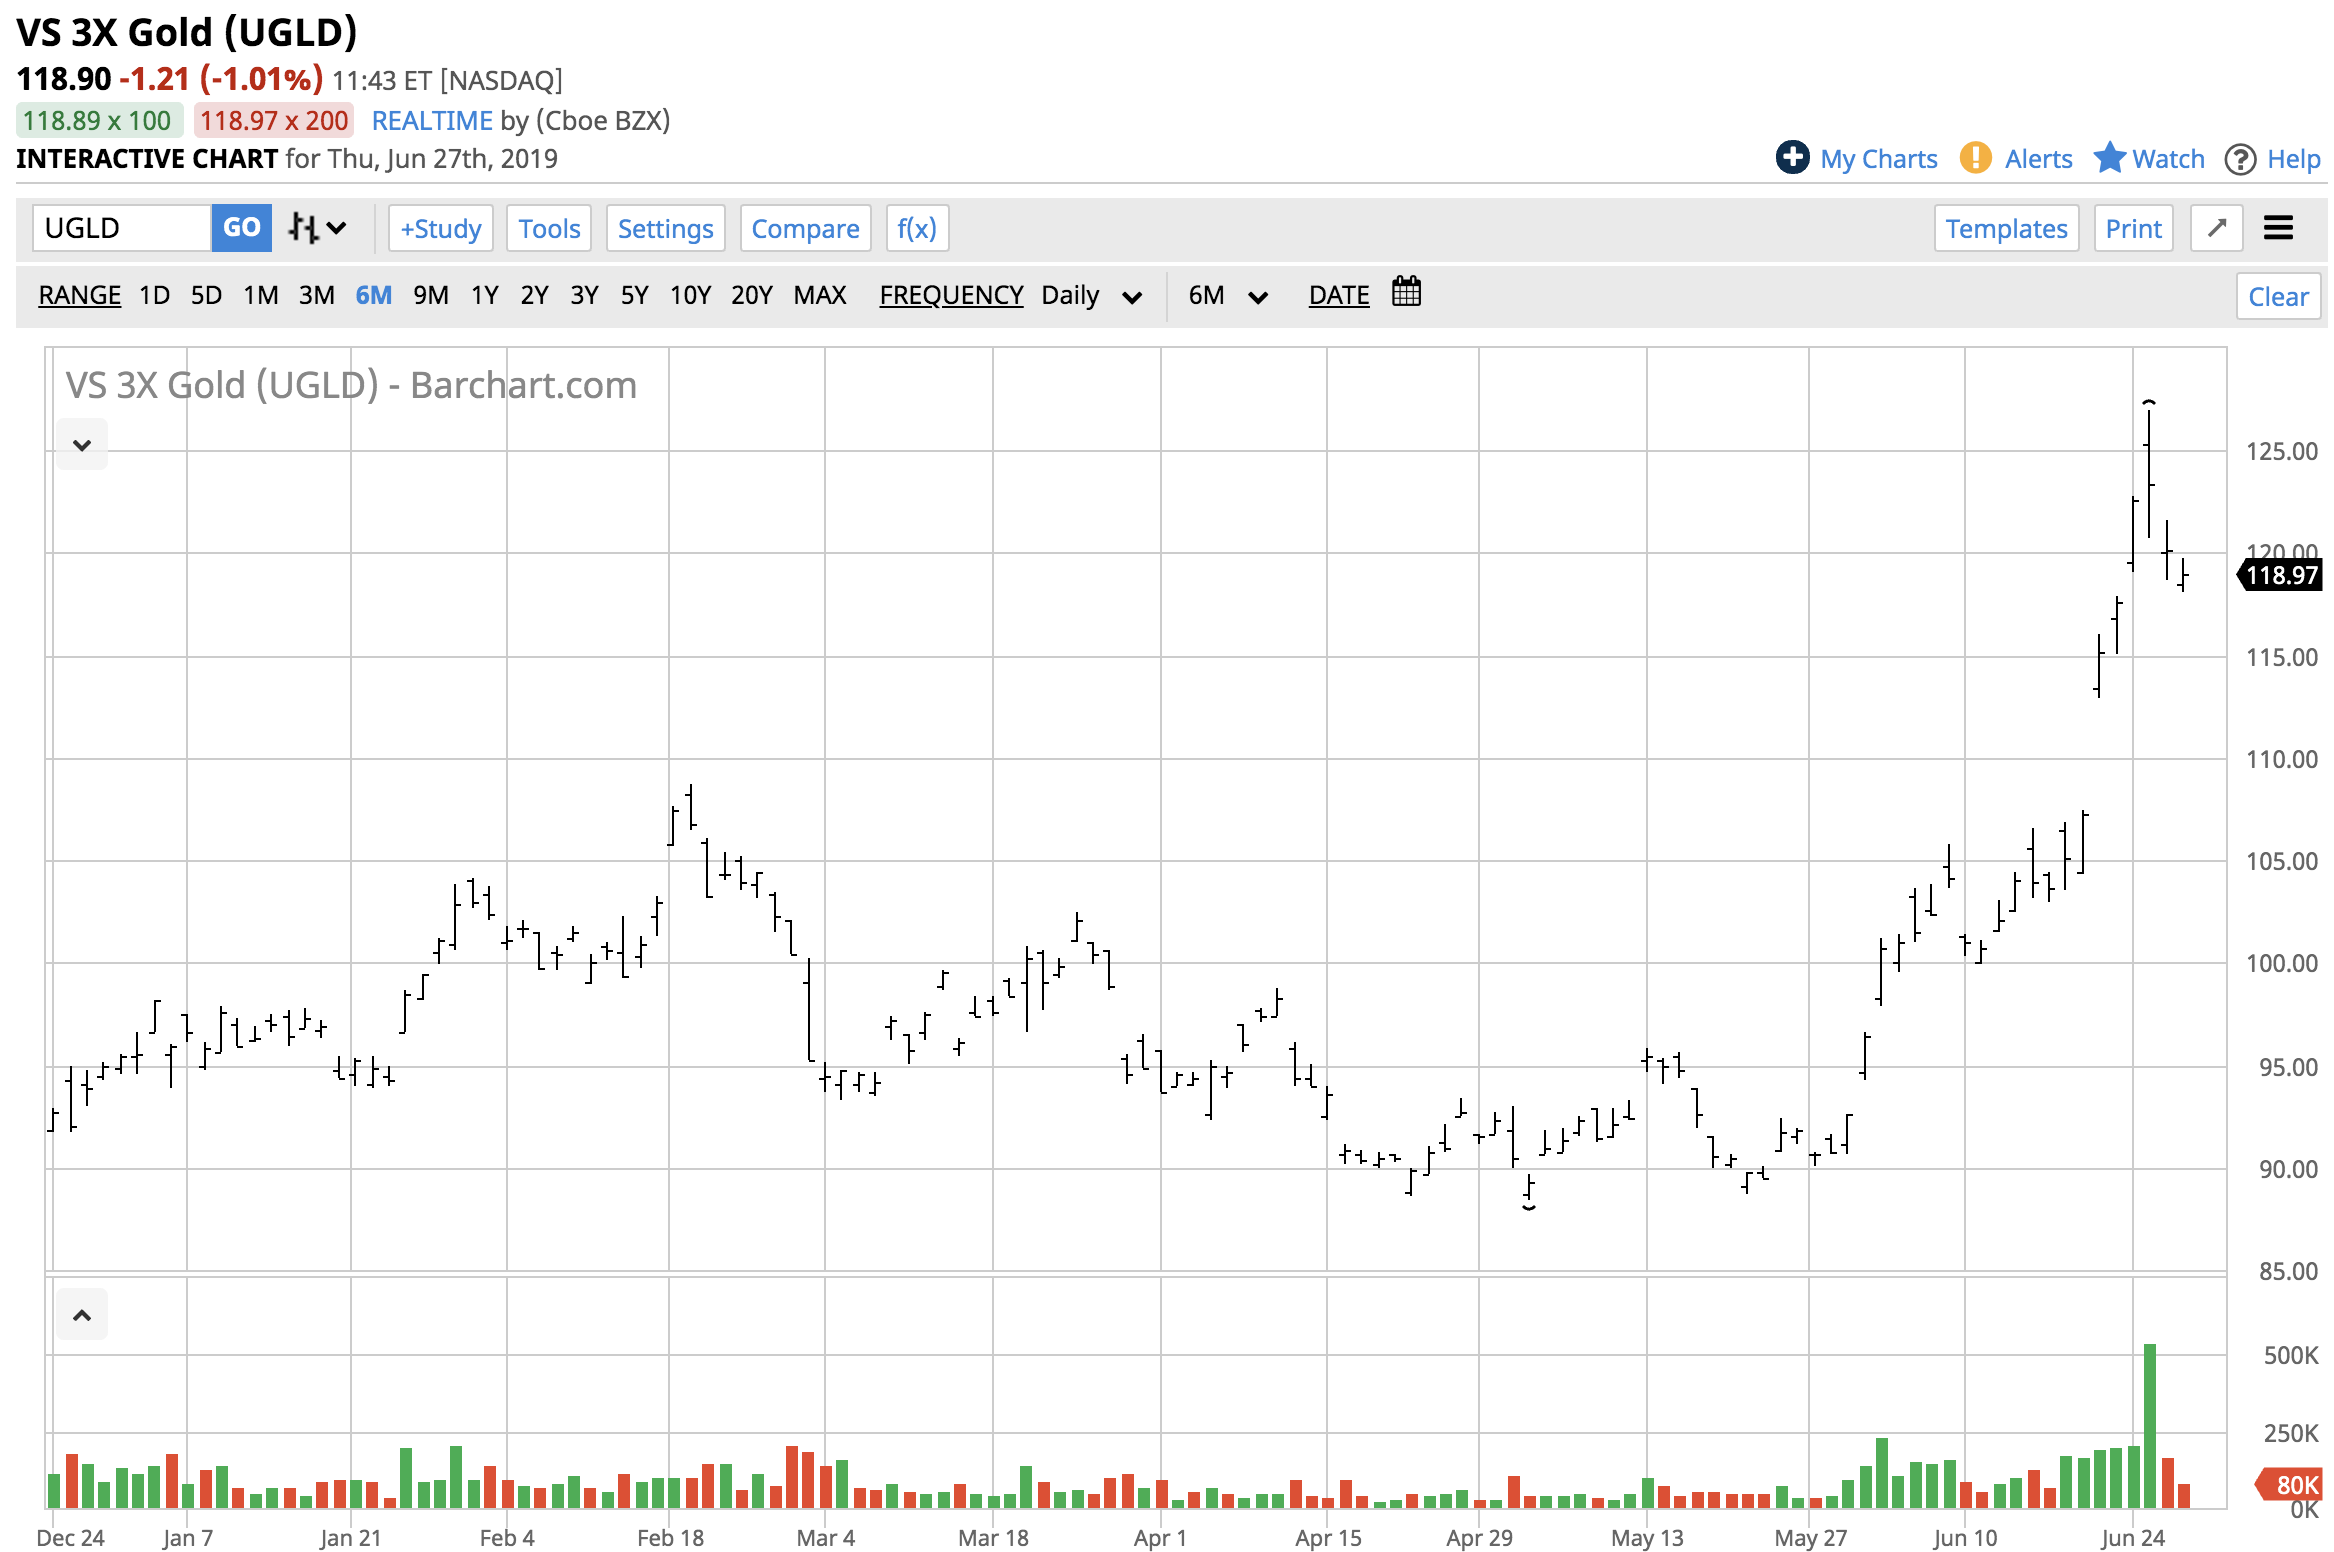
Source: Barchart
The chart shows that UGLD moved from $88.70 to $127.02 per share over the same period, a rise of 43.2%, more than triple the percentage move in the gold futures market.
Leverage comes at a price, which is time decay. If the price of gold moves sideways or lower, the price of triple-leveraged products like UGLD will shrivel up as fast as they rallied from late May until last Tuesday. However, if gold is a rocket ship on a launch pad that is preparing to go parabolic on the upside, UGLD's price would likely rise at a highly accelerated rate.
The Hecht Commodity Report is one of the most comprehensive commodities reports available today from the #2 ranked author in both commodities and precious metals. My weekly report covers the market movements of 20 different commodities and provides bullish, bearish and neutral calls, directional trading recommendations, and actionable ideas for traders. I just reworked the report to make it very actionable!
Disclosure: I/we have no positions in any stocks mentioned, and no plans to initiate any positions within the next 72 hours. I wrote this article myself, and it expresses my own opinions. I am not receiving compensation for it (other than from Seeking Alpha). I have no business relationship with any company whose stock is mentioned in this article.
Additional disclosure: The author always has positions in commodities markets in futures, options, ETF/ETN products, and commodity equities. These long and short positions tend to change on an intraday basis.The author is long gold
Follow Andrew Hecht and get email alerts