Gold in 2019: Lessons for the Year Ahead / Commodities / Gold & Silver 2019

The King is dead, long live the King - 2019 is over,long live the 2020! As tumultuous as they have been, what have we learned aboutthe gold market in the past twelve months? And what can we glean from this knowledgefor the times ahead?
Key LessonsFor Gold Investors from 2019
Today is the last day of2019. It was a good year for the gold bulls, as one can clearly see in thechart below. The price of the yellow metal increased from $1279 to $1474 (as ofDecember 18 – yes, we wrote this article before the festive break). It meansthat gold rose more than 15 percent in2019. The gold bulls cannot complain!
Chart 1: Gold prices(London P.M Fix, in $) from December 2018 to December 2019.
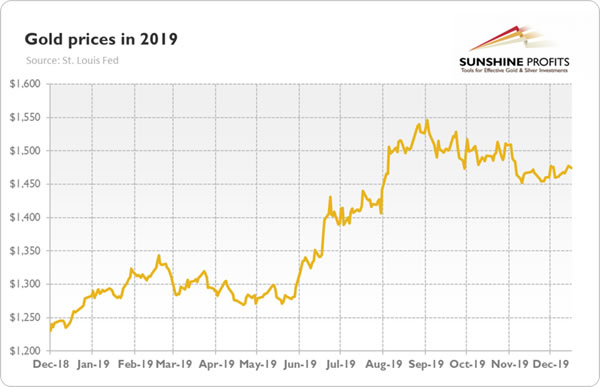
The main driverbehind gold’s success were fears of a U.S. recession and the related dovish U-turn within the Fed, which cut the federal funds rate three timesafter hiking it four times in 2018.
However, it was not surprising. After four hikes in2018, it was more than certain that the Fed’s stance would become more dovishand that the price of gold would then react favorably. What could be lessexpected was that the gold’s appreciation would occur simultaneously with the strengtheningU.S. dollar. As the chart below shows, we have not observed the traditionalstrong negative correlation between the greenback and the yellow metal.Actually, both assets moved in tandemstrongly up during the summer!
Chart 2: Gold prices (yellow line, left axis, P.M.Fix, in $) and the broad trade weighted US dollar index (red line, right axis)from January to December 2019
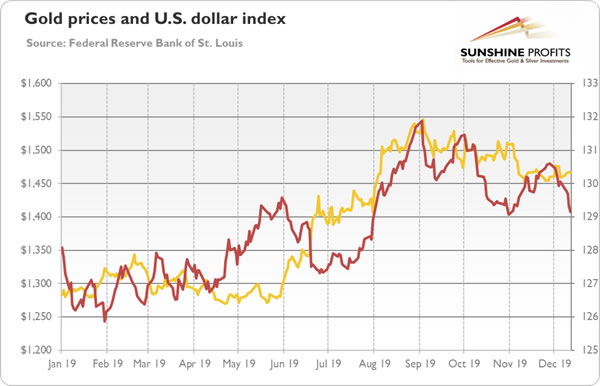
Why? The recessionary fears boosted both theU.S.-denominated government bonds and gold. Although the yellow metal is theultimate safe-haven, the U.S. Treasuries canalso behave like a safe haven, at least when compared to other assets – due tothe large liquidity flows they’re able to absorb. So, as I always repeat, do not mechanically follow gold’s correlations, but alwayslook at the broader macroeconomic context!
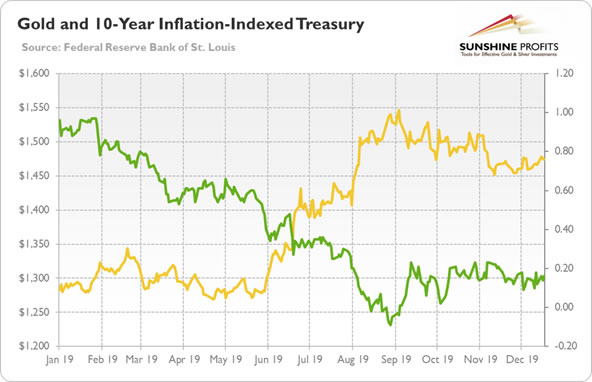
The relationship between gold and the real interest rates seemed tobe stronger in 2019. As one can see in the chart below, the peak in gold pricescorresponded with the bottom in the bond yields. However, the correlationwas far from being perfect. The real rates have been rising since January,while gold remained in a sideways trend until late May. It confirms that gold market is very complex and that gold investors should not count on simpleautomatic reactions.
Chart 3: Gold prices (yellow line, left axis, P.M.Fix, in $) and the yields on 10-year inflation-indexed Treasuries (green line,right axis, in %) from January to December 2019
Implicationsfor Gold in 2020
Gold showed in 2019 that it can shine even when theU.S. dollar appreciates and the stock prices reach new record levels. So, 2020does not have to turn out badly for the gold market. However, the Fed is goingto be neutral or cut interest rates once at most. It means that the U.S.central bank will be less dovish than in 2019. While this needn’t be a disasterfor the yellow metal, investors should acknowledge that gold fundamentals are likely to deteriorate somewhat next year (unless the next crisis occurs). Fundamentals are, of course, noteverything, but it seems to me that gold would welcome some ignition to beat orcome on par with its performance in 2019.
Anyway, tomorrow will be already January which used tobe a positive month for gold prices. So Happy January and the whole 2020! And let all the gold come to you in the NewYear… and in the 2020s!
Thank you.
If you enjoyed the above analysis and would you like to knowmore about the gold ETFs and their impact on gold price, we invite you to readthe April MarketOverview report. If you're interested in the detailed price analysis andprice projections with targets, we invite you to sign up for our Gold & SilverTrading Alerts . If you're not ready to subscribe at this time, we inviteyou to sign up for our goldnewsletter and stay up-to-date with our latest free articles. It's freeand you can unsubscribe anytime.
Arkadiusz Sieron
Sunshine Profits‘ MarketOverview Editor
Disclaimer
All essays, research and information found aboverepresent analyses and opinions of Przemyslaw Radomski, CFA and SunshineProfits' associates only. As such, it may prove wrong and be a subject tochange without notice. Opinions and analyses were based on data available toauthors of respective essays at the time of writing. Although the informationprovided above is based on careful research and sources that are believed to beaccurate, Przemyslaw Radomski, CFA and his associates do not guarantee theaccuracy or thoroughness of the data or information reported. The opinionspublished above are neither an offer nor a recommendation to purchase or sell anysecurities. Mr. Radomski is not a Registered Securities Advisor. By readingPrzemyslaw Radomski's, CFA reports you fully agree that he will not be heldresponsible or liable for any decisions you make regarding any informationprovided in these reports. Investing, trading and speculation in any financialmarkets may involve high risk of loss. Przemyslaw Radomski, CFA, SunshineProfits' employees and affiliates as well as members of their families may havea short or long position in any securities, including those mentioned in any ofthe reports or essays, and may make additional purchases and/or sales of thosesecurities without notice.
Arkadiusz Sieron Archive |
© 2005-2019 http://www.MarketOracle.co.uk - The Market Oracle is a FREE Daily Financial Markets Analysis & Forecasting online publication.