Gold Is Doing Yeoman's Work
The yellow metal is still following the dollar.
Open interest reflects a bullish tone.
$1377.50 is the line in the sand.
Geopolitics say higher.
The U.S. political environment is also bullish for the yellow metal.
Gold is a shiny precious and rare metal that has captured the imagination of people all over the world for thousands and thousands of years. Gold has value because people have always ascribed it to the yellow metal. Gold is a symbol, and ornamental metal, and the ultimate means of exchange. Gold has been around as a currency longer than any of the other foreign exchange instruments in circulation today. Moreover, central banks and monetary authorities around the world hold part of the foreign exchange assets in gold which has a long-standing role as the ultimate reserve asset.
Over the course of history, people have mined and discovered around 165,000 tons of the metal. Today, the official sector holds over 33,600 tons of the precious metal which amounts to over 20% of gold in the world. Gold outlives us all, and even when we buy the yellow metal, we can only hold it for our limited lifetime. Gold transcends the human condition, and humans throughout history covet gold.
While there was a movement in the 1990s to discredit gold as a barbarous relic of the past by central banks, those who sold a healthy chunk of their reserves at the end of the last century are still privately licking their financial wounds. The Bank of England parted ways with around half their holdings at prices below the $300 per ounce level, and at $1345 on Monday, April 16 I bet they wish they could have some of that back.
The yellow metal is still following the dollar
The dollar is the world reserve's currency and is the benchmark pricing mechanism for most commodities prices. Gold has a unique role in the commodities market. The yellow metal has a long history as both a metal or a raw material and a means of exchange. In fact, gold is a means of exchange that predates all of the currency instruments in circulation today as the precious metal's financial role dates back thousands of years. The Bible does not mention the dollar, euro, yen, Swiss franc, and all other currencies in circulation today in either the old or new testaments, but the Bible repeatedly refers to the precious metal in both.
The inverse price relationship between the dollar and gold has caused gold to follow the dollar closely at times, and in 2018, the price of the yellow metal has been moving on almost a tick-for-tick basis against the greenback. 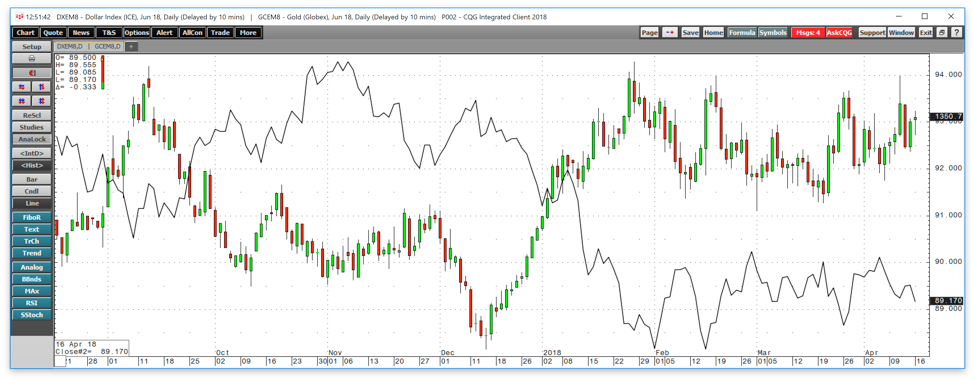
Source: CQG
As the chart of the dollar index (line chart) and COMEX gold futures (candlestick chart) highlights, the inverse correlation has been almost perfect over recent months. The dollar is trading close to its lowest level since 2014 and gold is flirting with its July 2016 peak at $1377.50 per ounce which was the highest point for the yellow metal since 2014.
Aside from the dollar, other bullish factors are impacting the price of the precious metal these days.
Open interest reflects a bullish tone
Open interest is the total number of open long and short positions in a futures market. When the metric increases with price or increases while the price falls, it typically validates a price trend. The theory behind open interest is that an increase in the metric causes more people to come to the market to participate in the price trend. However, when the metric declines either during a rally or a decline, it tends not to validate a current or emerging price trend. When open interest declines, it means that longs and shorts are closing positions and exiting the market. 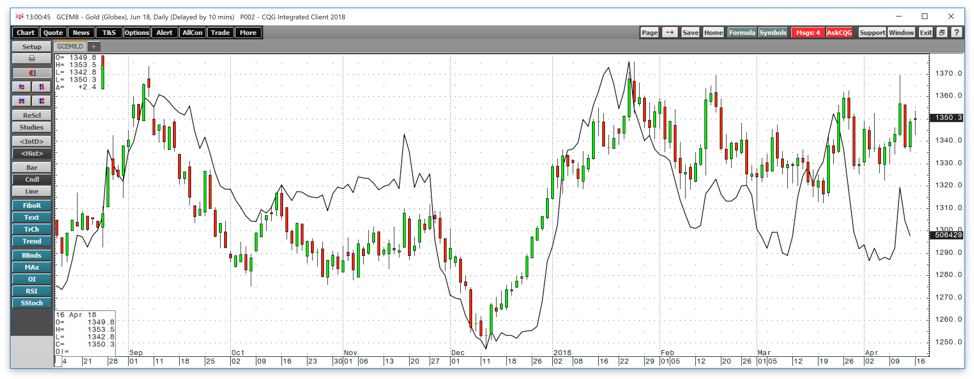
Source: CQG
Open interest in the COMEX gold market over recent months is illustrated via the line chart superimposed over the price of the yellow metal on the candlestick chart. In the case of gold futures, open interest has been rising during rallies and falling during downside corrections which could be a reflection of a bullish tone to the market. The moves in the metric have been nothing but supportive of higher prices.
$1377.50 is the line in the sand
Gold reached its all-time nominal high in September 2011 when the price hit $1920.70 per ounce on the nearby COMEX futures contract. Before 2008, the yellow metal had never traded above the $875 per ounce level, the high dating back to 1980.
Gold declined from the 2011 peak to lows of $1046. 20 in late 2015, but it held the $1000 level and is making higher lows since 2015. 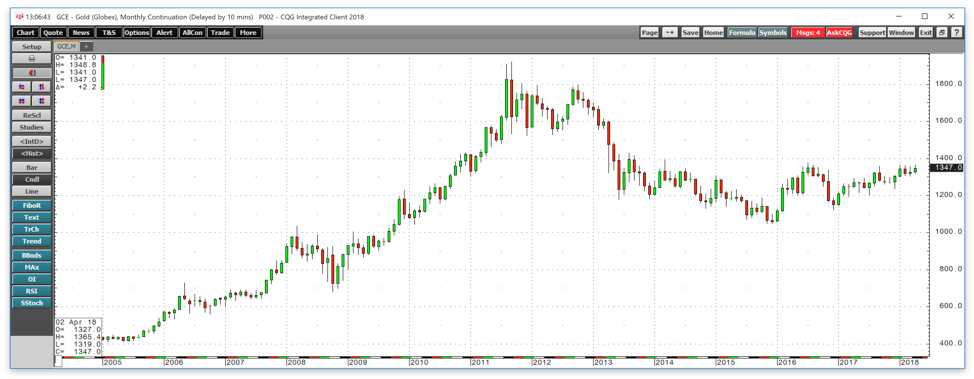
Source: CQG
As the monthly chart illustrates, gold has been trending to the upside as the lows have been at higher levels since 2015. In June 2016 the shock of the U.K. Brexit referendum caused the gold to surge to a high of $1377.50 per ounce, which still stands as a level of critical technical resistance for the yellow metal. In 2018, the range in gold futures has been from lows of $1303.60 to $1365.40 on the nearby COMEX contract. On Monday, April 16 the June futures contract was trading at just over the $1350 level, less than $30 below the price that could lead to a technical break to the upside in the yellow metal.
Above the 2016 peak, the next level of technical resistance stands at $1392.60 per ounce, and above there the next level is at over $1400 per ounce. Gold has not traded above the $1400 level since 2013, but it may be heading there as the political landscape is highly supportive of gains from the current price level of the commodity that also tends to act as a financial instrument during periods of fear and uncertainty.
Geopolitics say higher
Gold can be an excellent barometer of the geopolitical landscape. In 1980, the yellow metal rallied as the Iranian revolution and hostage crisis reached its peak. In 2016, the most recent peak came in the immediate aftermath of the U.K.'s vote to reject the status quo and divorce from the rest of Europe. Periods of uncertainty in the geopolitical world tend to foster price gains in the gold market.
These days, there are almost too many issues facing the geopolitical landscape to mention. In Asia, trade issues with China have the potential to deteriorate into a trade war. North Korea became a nuclear power in 2017, and the Chinese military has continued its expansionary policies in the South China Sea.
At the same time, the relationship between the U.S. and Russia has deteriorated to a post-Cold War low over recent months. Accusations of Russian interference during the Presidential election of 2016, support for the Asaad regime in Syria, a close alliance with Iran in the Middle East, and Russian assassination attempts of former operatives in the U.K. have caused an increase in sanctions and expulsions of diplomats over recent weeks and months.
In the Middle East, the proxy war between Saudi Arabia and Iran in Yemen threatens to spread throughout the region as KSA and their allied Gulf States have blockaded Qatar and tensions are mounting. Last week, Iranian-backed rebels in Yemen fired at least three missiles into Saudi sovereign territory heightening tensions and the potential for an expanding war in the region. With the U.S. behind the Saudis, and Russia backing Iran, the potential for serious and devastating conflict is a growing concern in the region. Moreover, it is likely that President Trump will not recertify the Iran nuclear nonproliferation agreement in coming weeks, which could add to tension in the area. All of these issues and the unknown when it comes to the geopolitical landscape are potentially explosive factors for the price of gold.
The U.S. political environment is also bullish for the yellow metal
On the domestic political front in the United States, the nation remains divided as the 2016 Presidential election was a polarizing event. This year, midterm elections in Congress could shift legislative control back into the hands of the Democrats. At the same time, a special prosecutor, Robert Mueller, and others in the country continue to attempt to undermine and even move towards removal of President Trump. Domestic U.S. politics provide the potential for a continuation of volatility in markets across all asset classes from which gold could benefit in the coming weeks and months. Aside from charges of collusion with Russia during the election of 2016, the President also faces a mounting number of personal scandals from past years that could lead to a period of uncertainty when it comes to political leadership.
I believe that it is a matter of time before one or more of the issues facing the world causes the price of gold to move above its level of technical resistance at $1377.50 per ounce and trades north of the $1400 level. 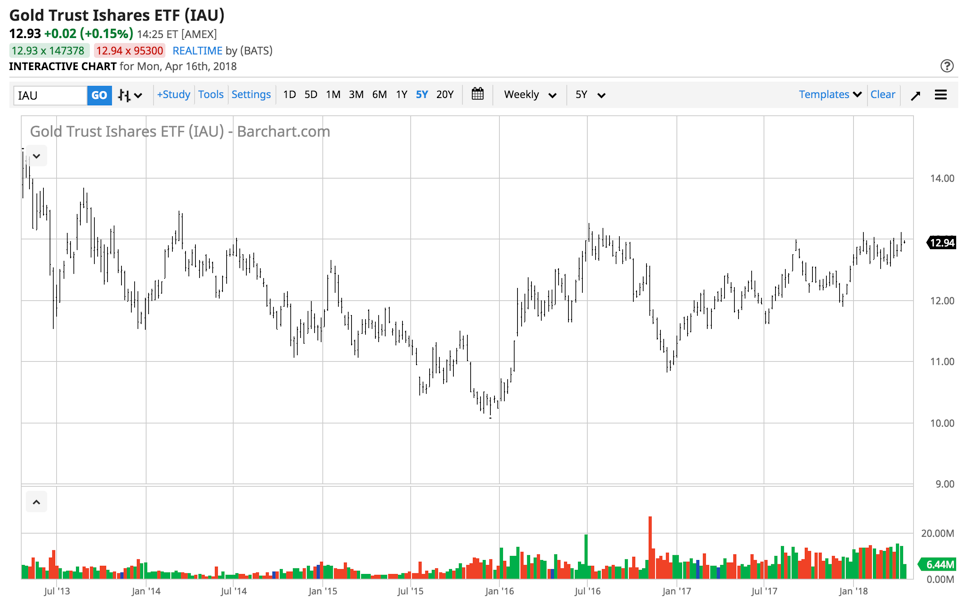
Source: Barchart
The iShares Gold Trust ETF (NYSEARCA:IAU) has $11.55 billion in net assets, an average daily trading volume of almost 13 million shares, and an expense ratio of just 0.25%. While IAU does the same job reflecting price changes in the gold market as GLD, it has a lower expense ratio than GLD which charges 0.40%. IAU is also around one-tenth the size of GLD and was trading at the $12.94 level on April 16. In 2016, when gold hit its most recent peak, IAU traded to $13.25 per share. In 2011, IAU hit its all-time high of $18.63 per share.
There are so many political factors that not only support the price of gold but could ignite the yellow metal on the upside over coming weeks and months. Gold is doing yeoman's work, and IAU could be the perfect vehicle to add to your portfolio during the current period of uncertainty related to future political events.
The Hecht Commodity Report is one of the most comprehensive commodities reports available today from the #2 ranked author in both commodities and precious metals. My weekly report covers the market movements of 20 different commodities and provides bullish, bearish and neutral calls; directional trading recommendations, and actionable ideas for traders. More than 120 subscribers are deriving real value from the Hecht Commodity Report.
Disclosure: I/we have no positions in any stocks mentioned, and no plans to initiate any positions within the next 72 hours.
I wrote this article myself, and it expresses my own opinions. I am not receiving compensation for it (other than from Seeking Alpha). I have no business relationship with any company whose stock is mentioned in this article.
Additional disclosure: The author always has positions in commodities markets in futures, options, ETF/ETN products, and commodity equities. These long and short positions tend to change on an intraday basis.
Follow Andrew Hecht and get email alerts