Gold Is Hanging In There - An Impressive Performance In The Face Of Adversity
Gold falls early in 2018.
History tells us to be careful.
Gold is waiting for silver to validate its strength.
The rate hike is baked inside this gold bar.
Levels to watch and a pair of products for short-term trading.
The dollar index rose to a new high for 2018 on the final day of October when the December futures contract hit a peak at 96.980. The last time that the dollar traded at a higher level was during the week of June 26, 2017.
The higher dollar tends to weigh on the price of commodities, and gold is typically one of the most sensitive metals when it comes to moves in the currency markets. Gold is a hybrid as it has a long history as both a metal or raw material and a means of exchange or currency instrument. While gold edged lower on the day that the dollar index hit its high and traded to a low of $1213.40 per ounce, the Halloween move in the dollar did not do all that much to spook the yellow metal.
The dollar index has backed off its most recent high for 2018, and gold rallied back to the $1230 level on the December COMEX futures contract.
The gold futures market had been making higher lows since reaching a bottom at $1046.20 in December 2015. However, the price action over the summer of 2018 sent the price of the precious metal to a low of just over the $1160 level and broke the back of the bullish trading pattern. Meanwhile, we are coming into a time of the year where precious metals prices tend to move to the downside following a pattern that has been in place since the final month in 2015. However, gold broke a bullish pattern this year, and now it could be in a position to break a bearish one.
With the potential of a significant move in the price of gold brewing over the coming weeks, I have been trading the Velocity Shares 3X Long Gold ETN product (UGLD) and its bearish counterpart (DGLD) to take advantages of increasing volatility in the gold futures market.
Gold falls early in 2018
In 2015, the price of gold began to fall in mid-October. In 2016, the slide took hold in early November, and last year the yellow metal began its descent on early September. The fall season had been a time of the year where selling pressure dominated the gold futures market, but in 2018, the selling came early starting in the spring and picking up a head of bearish steam during the summer months. 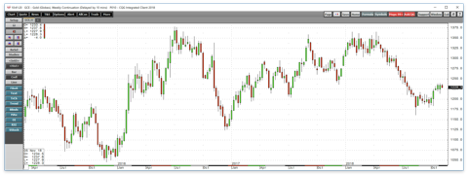
Source: CQG
The weekly chart highlights the departure from the past years in 2018. Gold reached its initial peak in 2018 early in the year in late January when the price rose to $1365.40 per ounce, just $12.10 or under one percent below its July 2016 peak and level of critical technical resistance. After a correction to a low of $1303.60 during the final week of February, the gold futures market worked its way back to precisely the same peak price during the week of April 9. The failure at the same level created a double top formation on the weekly gold chart which led to a deep and dark correction that took the price of gold to a low of $1161.40 in mid-August. The low in gold came as the dollar index rose to its high for the year at 96.865 on the nearby futures contract.
Gold recovered from the mid-August low and is now trading at just under the $1230 per ounce level during the first full week of November. In a sign that things could be different this year, the dollar index's new high last week did not send gold significantly lower and the price held above the $1213 per ounce level on December futures. The last time the dollar made a higher high, gold had tested a price that was $52 lower.
Gold fell earlier than usual in 2018, but we are coming up on a time of the year where caution is necessary as gold has developed an ugly habit of making a low during the final month of the year just before the holiday season.
History tells us to be careful
History often provides us with a guide to seasonality in the world of commodities. In the gasoline market, the price typically rises as the peak driving season approaches in late spring and falls in the leadup to the winter season. The cattle and hog futures tend to rally in the spring as the grilling season gets underway during the final week of May.
Natural gas and energy commodities that experience increased demand during cold seasons often rally as the chilly season approaches. On Tuesday, November 6, the price of nearby natural gas futures that trade on the New York Mercantile Exchange moved to the highest level since February 2016 when they traded at $3.581 per MMBtu as injections from inventories will shift to withdrawals this month.
When it comes to the gold market, the pattern of lows during the final month of the year began in 2015 and repeated in 2016 and 2017. During each of the following years, gold did not trade below the December bottom, until 2018 changed the pattern. Now that December is on the horizon and at the $1230 level gold is almost $70 above the August low, the risk of a repeat of December price carnage in the gold market and a lower low for the year is a clear and present danger for the yellow metal.
While gold has recovered from its lows this summer, it has not received validation from its partner in crime, silver.
Gold is waiting for silver to validate its strength
The price action in the silver market has been a problem for gold. While the yellow metal fell to a low in mid-August and recovered, silver kept on falling.
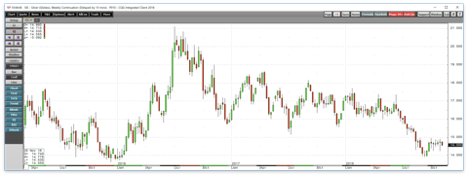
Source: CQG
Gold fell to just over $1160 per ounce on the lows in 2018 which was the lowest price for the metal since the first week of 2017. However, silver fell to its nadir for the year during the week of September 10. As the weekly chart illustrates, silver fell to a low of $13.91 which was the lowest level since early 2016 and dangerously close to its critical technical support level at $13.635 from December 2015 which was the lowest price since way back in 2009.
Silver has continued to underperform gold since the September low as the metal fell to its lowest price compared to gold in a quarter of a century.
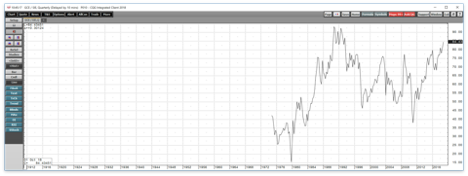
Source: CQG
As the quarterly chart of the price of gold divided by the price of silver shows, the number of ounces of silver required to purchase an ounce of gold at over 84 has not been this high since 1993. Weakness in the price of silver is typically a bearish sign for the precious metals sector.
After the price of gold declined to the $1160 level, it rose above the $1200 level in early October and has not returned below. However, silver has breached the $15 per ounce barrier on the upside which stands as a warning for the gold market.
In the world of precious metals, investment demand is the critical component that determines the path of least resistance for prices. The lack of buying in the silver market, which has a long history of moving more on a percentage basis than gold, could be telling us that the precious metals do not have enough investment winds behind their sales to stage a recovery or even hold their current price levels as the bearish month of December approaches.
The rate hike is baked inside this gold bar
One of the primary reasons why gold and silver prices moved lower during the final month of each year since 2015 has been that the U.S. Federal Reserve began tightening credit in December 2015.
The first Fed Funds rate hike of 25 basis points came during the final month of 2015, and the next was in December 2016. Higher rates in the U.S. have supported the value of the dollar versus other world currencies. Higher rates also increase the contango in the gold market making it more expensive to carry inventories and long positions in the yellow metal. Therefore, rate hikes in the U.S. weighed on the price of precious metals during the final month of each year. Ironically, the anticipation of a rate hike has done more damage to the gold price over the past years than the event. The price of gold has tended to rally in the aftermath of a rate hike announcement from the Fed. After one rate hike a piece in 2015 and 2016, the Fed acted three times in 2017 which only pushed gold what was a higher low last December.
At the June FOMC meeting, the central bank lit what turned out to be a bearish fuse for the gold market when it added a fourth 25 basis point rate hike to their agenda for 2018. In hindsight, the announcement took the price of gold to its lows for this year and broke the pattern of higher bottoms.
This year, economic data and a more hawkish approach to monetary policy have removed all doubt over the Fed's intention for their December meeting. By the end of 2018, the Fed Funds rate will stand at 2.25-2.50% after a total of nine 25 basis points rate hikes since liftoff from zero in late 2015.
The Fed expressed concern the ongoing trade dispute between the U.S. and China could cause inflationary pressures to rise. At the same time, the Trump administration favors a weak dollar policy to make U.S. goods more competitive in global markets. Therefore, gold and silver have a lot to consider these days as they decide if they will follow the trading pattern of recent years or break the trend of lows at the end of the year.
Levels to watch and a pair of products for short-term trading
Chart patterns are often made to be broken, and we found that out in July when gold fell below its December 2017 bottom. We are coming into the time of the year where selling has dominated the gold market sending it to an annual low, but there is no guaranty that 2018 will turn out to be anything like the prior three years.
I like the recent price action in the gold market, but silver's activity is a reason for concern. Therefore, I am going with the flow of buying or selling in the precious metals sector over the coming weeks. In gold, I will be watching $1200 and $1160 on the downside, and $1246, $1265, and $1300 on the upside. Silver's critical levels stand at $13.91 and $15.07 as we head towards the end of 2018.
The Velocity Shares 3X Long Gold ETN product (UGLD) is a short-term trading tool that turbocharges results on the upside in the gold market. The fund summary for the ETN states:
The investment seeks to replicate, net of expenses, three times the S&P GSCI Gold index ER. The index comprises futures contracts on a single commodity. The fluctuations in the values of it are intended generally to correlate with changes in the price of gold in global markets.
UGLD created triple-leverage with futures and options positions which suffer from decay over time. Therefore, they are only appropriate for short-term forays into the gold market. 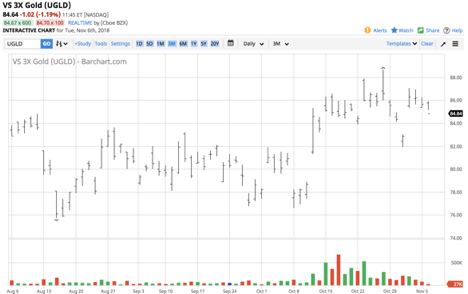
Source: Barchart
On October 31 nearby COMEX gold futures fell to a low of $1213.40 and rose to a high of $1239.30 on November 1, a rise of 2.1%. Over the same period, UGLD rose from $81.93 to a high of $87.05 or 6.3%, triple the move in the COMEX futures.
UGLD and its inverse ETN DGLD are highly-geared products for those who seek leverage without entering the world of futures. However, caution is necessary when using both of these market tools as the decay causes reverse splits over time which can quickly turn them into eggs that will never hatch in your nest egg if held too long. UGLD has net assets of $128.4 million and trades an average of over 118,000 shares each day. DGLD has net assets of $19.41 million and trades over 87,500 shares on average each day. UGLD and DGLD offer reasonable liquidity and tight bid-offer spreads.
I will be trading from the long and short sides of the gold market over the coming weeks using futures and the UGLD and DGLD ETF products.
So far, gold's performance in the face of adversity has been impressive. The new high in the dollar last week and approaching rate hike by the Fed have not pushed the price of the yellow metal lower even though silver continues to languish at under the $15 per ounce level. Right now, I am on the long side of the market in precious metals but will quickly reverse and go the other way if the flow starts to look like December 2018 will turn out to be a repeat of the past three years.
The Hecht Commodity Report is one of the most comprehensive commodities reports available today from the #2 ranked author in both commodities and precious metals. My weekly report covers the market movements of 20 different commodities and provides bullish, bearish and neutral calls; directional trading recommendations, and actionable ideas for traders. More than 120 subscribers are deriving real value from the Hecht Commodity Report.
Disclosure: I/we have no positions in any stocks mentioned, and no plans to initiate any positions within the next 72 hours.
I wrote this article myself, and it expresses my own opinions. I am not receiving compensation for it (other than from Seeking Alpha). I have no business relationship with any company whose stock is mentioned in this article.
Additional disclosure: The author always has positions in commodities markets in futures, options, ETF/ETN products, and commodity equities. These long and short positions tend to change on an intraday basis.
Follow Andrew Hecht and get email alerts