Gold: Is It A Bull Trap?
Based on the VC PMI, we are coming into this week with gold having a bullish weekly trend momentum.
If gold closes below $1294, it would negate this bullishness to neutral.
The monthly S1 was at $1338, which has been completed, while the S2 level, if we go into a blow-off acceleration phase, is $1356.
We are waiting now for the market to close below $1338 to activate a short signal.
If we close below $1313, it would activate for the VC PMI the buy 1 (B1) level of $1307 to the buy 2 (B2) of $1296.
As we look at the Mean Reversion Trading report published in Seeking Alpha's Marketplace on February 15 regarding gold, it looks like gold, as of Tuesday the 19th, 7:09 am, as I write this report, has completed the targets based on the Variable Changing Price Momentum Indicator (VC PMI). The report said if you are long coming into this week, to take profits between $1324 and $1330. Gold is trading last at $1338.40 and it has not only completed the short-term targets but is now completing the intermediate targets. As gold has reached $1338, we have activated the monthly or longer-term targets of sell 1 (S1) at $1338 of the monthly VC PMI report published on February 1.
Courtesy: ema2trade.com
Bullish Gold Market
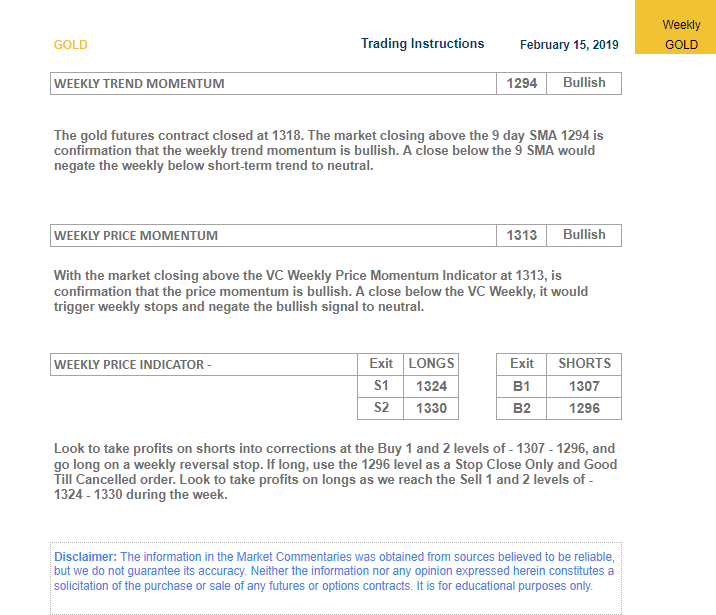
The weekly report that we published told us, since the market closed Friday at $1318, that we are coming into this week with a bullish weekly trend momentum. The VC PMI artificial intelligence algorithm tells us that if the price fails to be bullish, the VC PMI gives us the other side of the trade. If gold closes below $1294, it would negate this bullishness to neutral.
Weekly Targets
The second filter, the Weekly Price Momentum Indicator is at $1313. With Friday's close above this at $1318, it is a bullish indicator for the market. This level tells you where to place a protective stop. If the markets were to close below $1313 sometime this week, this bullish pattern would be negated. It also gives us targets that, based on the fact that the market closed above $1318, if you are coming in long this week, you should take profits at the S1 level of $1324 to the sell 2 (S2) level of $1330. If you're long, look to take profits on longs as we reach S1 and S2 during the week. As the market opened this morning, those targets had been completed by 7:13 am (Tuesday morning).
Monthly Targets
We also refer to the targets on the monthly VC PMI filter, especially when the weekly targets have been met. The previous report on the monthly S1 was at $1338, which has also been completed with a high of $1338.70. The S2 level, if we go into a blow-off acceleration phase, is $1356. I suggest that if you have been riding the long side of the market, you should go flat or neutral. In the meantime, what we are seeing is that all the targets have been accomplished for the short and intermediate term.
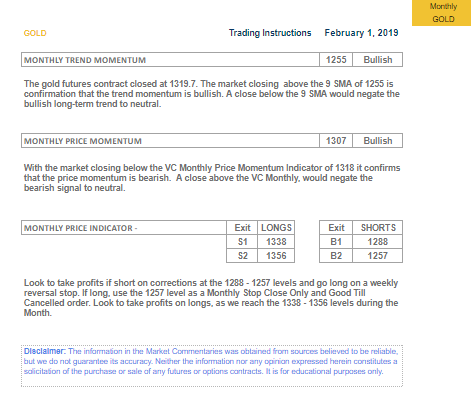
Waiting For A Short Signal
We are waiting now for the market to close below $1338 to activate a short signal. if the market reaches $1356, we would be looking for a reversion on a close below $1356, which would activate a short signal from $1356. Then the artificial intelligence in the VC PMI is telling us to look for a reversion from the $1338 to $1356 levels based on the February gold contract. Then take profits and start hedging if you want to stay long.
Protective Stops
The protective level coming into this week is $1313, which would be your first level as a stop. The $1294 level is the second level below that for a protective stop. The protective levels should be executed on a closing basis only.
Buying Back In
If we close below $1313, it would activate for the VC PMI the buy 1 (B1) level of $1307 to the buy 2 (B2) of $1296. I want to point out that if the market reverts back down to $1307, that also would correspond to the average price on a longer-term basis for the monthly report. If that occurs, it would be a harmonic relationship between the short and longer-term trigger points and an ideal time to enter a long position after a correction occurs.
The VC PMI Automated Algorithm
We use the proprietary Variable Changing Price Momentum Indicator (VC PMI) to analyze the precious metals markets. The primary driver of the VC PMI is the principle of reversion to the mean ("Mean Reversion Models of Financial Markets"; "The Power of Mean Reversion in Factor-Based Investing"), which is combined with a range of analytical tools, including fundamental logic, wave counts, Fibonacci ratios, Gann principles, supply and demand levels, pivot points, moving averages, and momentum indicators. The science of Vedic Mathematics is used to combine these elements into a comprehensive, accurate, and highly predictive trading system.
Mean-reversion trading seeks to capitalize on extreme changes in the price of a particular security or commodity, based on the assumption that it will revert to its previous state. This theory can be applied to both buying and selling, as it allows a trader to profit on unexpected upswings and buy low when an abnormal low occurs. By identifying the average price (the mean) or price equilibrium based on yesterday's supply and demand factors, we can extrapolate the extreme above this average price and the extreme below it. When prices trade at these extreme levels, it is between 90% and 95% probable that prices will revert back to the mean by the end of the trading session. I used this system to analyze the gold and silver markets.
Strengths And Weaknesses
The main strength of the VC PMI is the ability to identify a specific structure with price levels traders can execute with a high degree of accuracy. The program is flexible enough to adjust to market volatility and alerts you when such changes take place, so one can adjust strategies accordingly. Such changes include when the market breaks out of a consolidation phase or a trend accelerates. Such volatility usually happens when the market has produced a signal at the S2 or B2 level, and the market closes above or below these extreme levels.
The day trading program then confirms that a higher fractal in price has been identified and the market will move significantly higher, although the same principle applies if the market falls significantly. By the price closing above the S2 level, it indicates that the buying demand is greater than the supply. This means that the market has found support for the next price fractal. Conversely, the price closing below the B2 level indicates that the selling pressure has met demand greater than supply at the extreme below the mean, and prices should revert back to the mean.
The basic concept of the VC PMI is that the program trades the extremes of supply and demand based on the average price daily, weekly, and monthly.
The strongest relationship we find in the algorithm is when the daily price is harmonically in alignment with the weekly and monthly indicators. We call this "harmonic timing." Such an indication produces the highest probability (90%) that the price will revert from these levels to its daily, weekly, or monthly average.
Disclaimer
The information in the Market Commentaries was obtained from sources believed to be reliable, but we do not guarantee its accuracy. Neither the information nor any opinion expressed herein constitutes a solicitation of the purchase or sale of any futures or options contracts. It is for educational purposes only.
For more information on Mean Reversion Trading, try a free two-week trial of our MarketPlace service: Mean Reversion Trading.
Disclosure: I/we have no positions in any stocks mentioned, and no plans to initiate any positions within the next 72 hours. I wrote this article myself, and it expresses my own opinions. I am not receiving compensation for it (other than from Seeking Alpha). I have no business relationship with any company whose stock is mentioned in this article.
Follow Equity Management Academy and get email alerts