Gold: Is It Time To Panic?
Despite gold's decline the past two weeks, the metal remains firmly above its 20-month moving average.
The metal continues to trade in a large base for the past several years, and the key for the bulls is taking out $1,365/oz once and for all.
Bullish sentiment has retreated on this pullback, and is now back to more subdued levels near 50% bulls.
Just two weeks ago we had nearly every gold bug discussing how $1,500 - $1,600 by next year was a certainty, but it's amazing what price can do for sentiment. Over the past ten days, trading sentiment had gone from a fear of missing out and a stampede into miners to disgust for being in, and a frenzy to figure out where support is. Of course, we've seen proof of this in the percent of bulls in the gold market with the reading dropping from 90% to 55% in just eight days. So is it time to panic, and did we see the highs for 2018, or is this just a healthy correction designed to shake the tree a little? Let's take a closer look.
While this pullback in gold has been relatively minor at just 4%, the Gold Juniors Index (GDXJ) where most gold investors take up residence has had a more violent slide the past week. The index is down 11% in just seven trading days, and many individual names have given up half of February's gains. If gold has seen its highs for the year, then last week is just a preview of what's to come. There's never any guarantees, and it can be more challenging to have conviction in ranges, but I'm less inclined to worry here as we've seen minimal technical damage.
Taking a look at sentiment first in the below chart, we can see that bullish sentiment is in a free-fall the last two weeks and is resting right near its key sentiment moving average. There's no promise that sentiment has to make a U-turn here and hold, but generally, it hasn't been a bad time to own gold if this moving average has been trending up. Despite the drop of 35% bulls over the past week, the slope of the sentiment moving average has not changed course in the slightest. Based on the slope of gold's sentiment moving average remaining positive for the time being, we still have a trend of more bulls entering the market which is a silver lining for now.
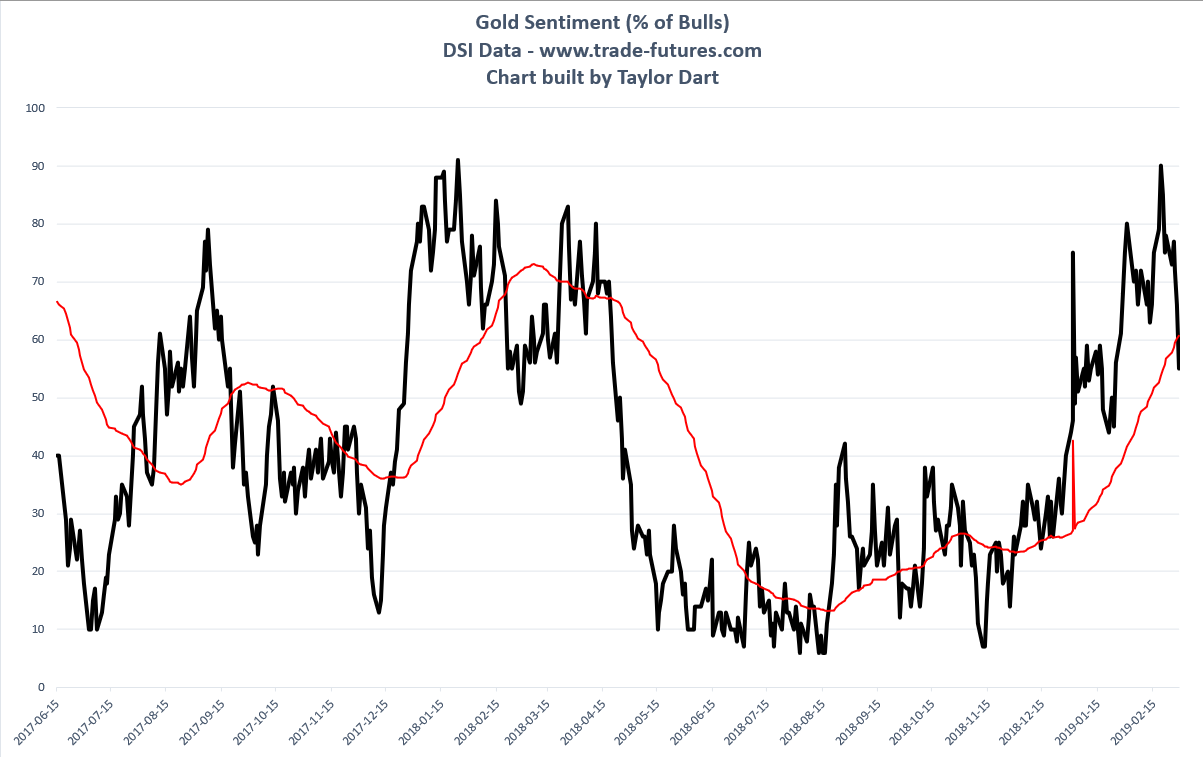 (Source: Daily Sentiment Index Data, Author's Chart)
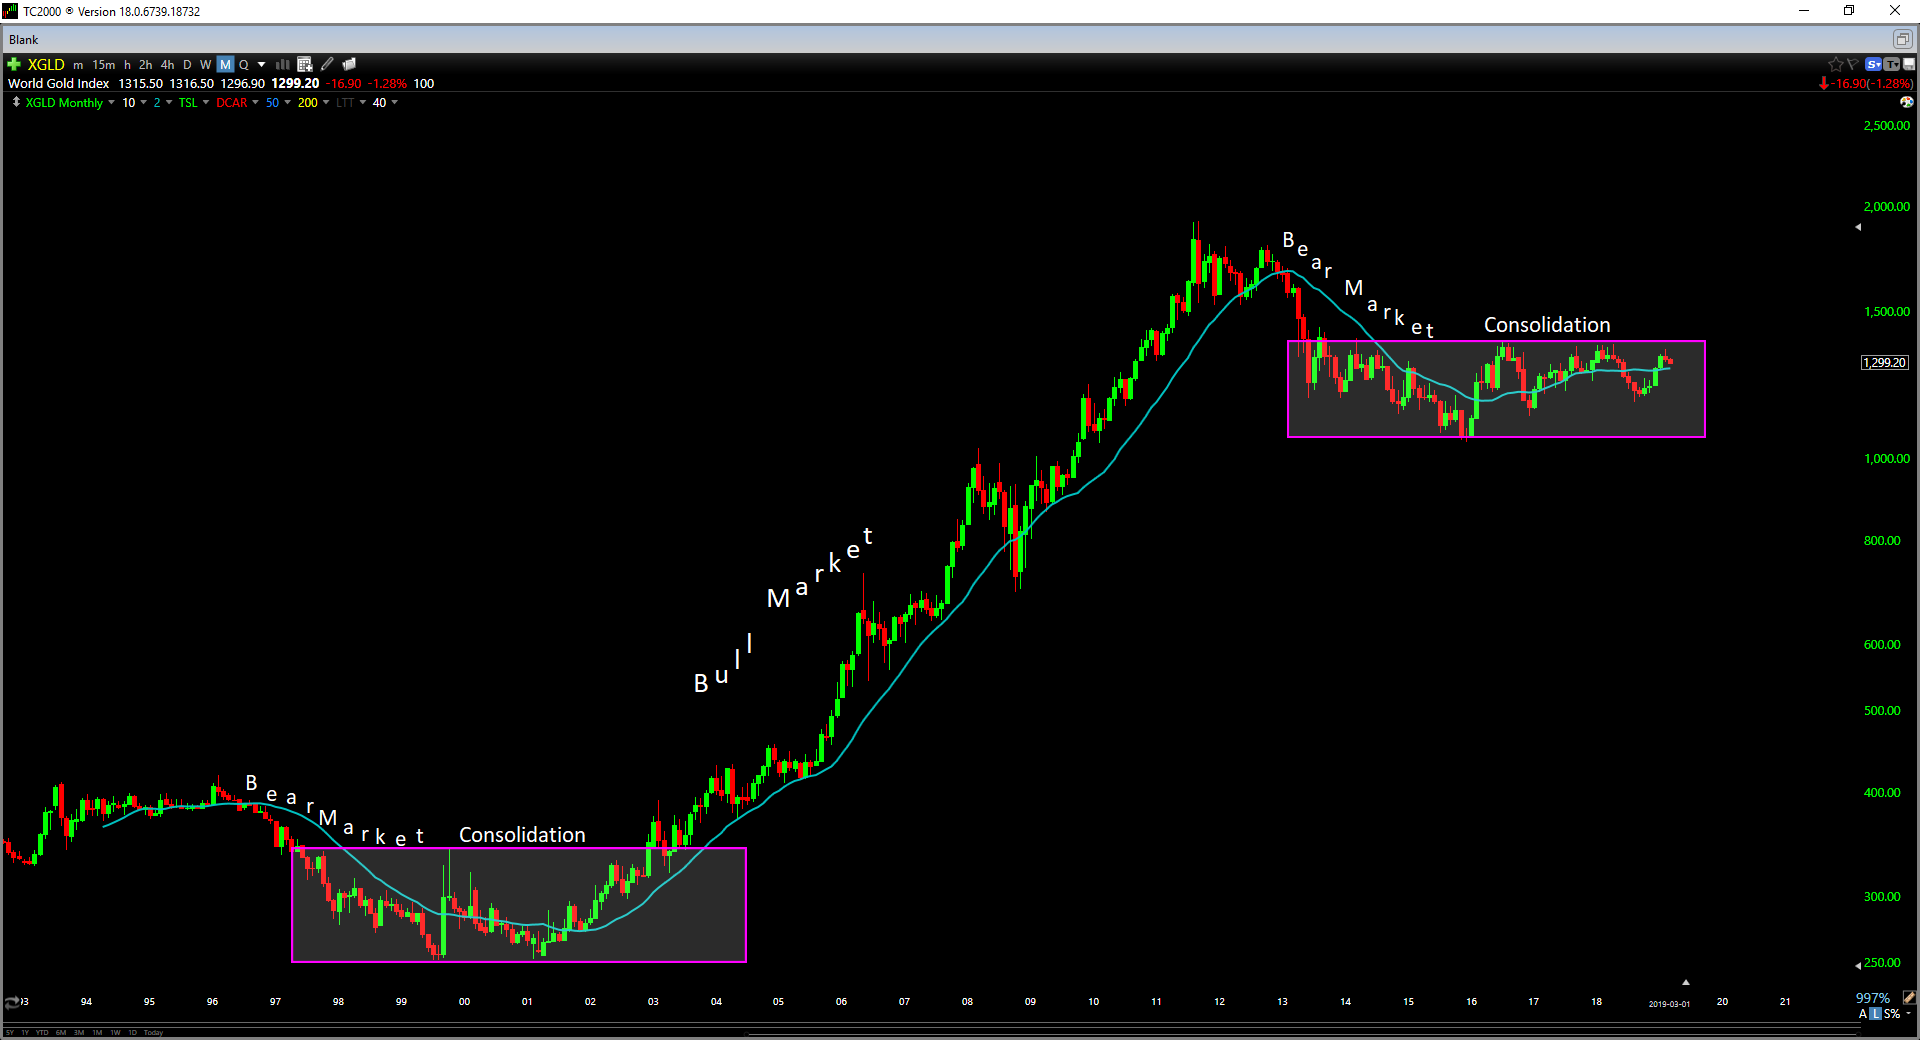
Moving over to the technicals, we can try and get a better idea of where we are. By looking at a long-term view of the metal, it should be no surprise that the past few years have been frustrating. Gold began a new secular bear market in 2011, had a brief bull market in 2016, and is now bouncing back and forth within its consolidation zone. There have been hundreds of articles the past two years discussing why we should absolutely be holding miners, so we don't get left behind, but rarely are investors "left behind" when a market is just trading within a range.
 (Source: TC2000.com)
The truth of the matter is that being long miners from 2017 through 2019 was a massive opportunity cost as they lost 30% of their value, with some names dropping over 70% like Eldorado (EGO), New Gold (NGD), and Hecla Mining (HL). While the market has not made much progress since Q2 2017, it has at least seen a positive return.
 (Source: Author's Photo)
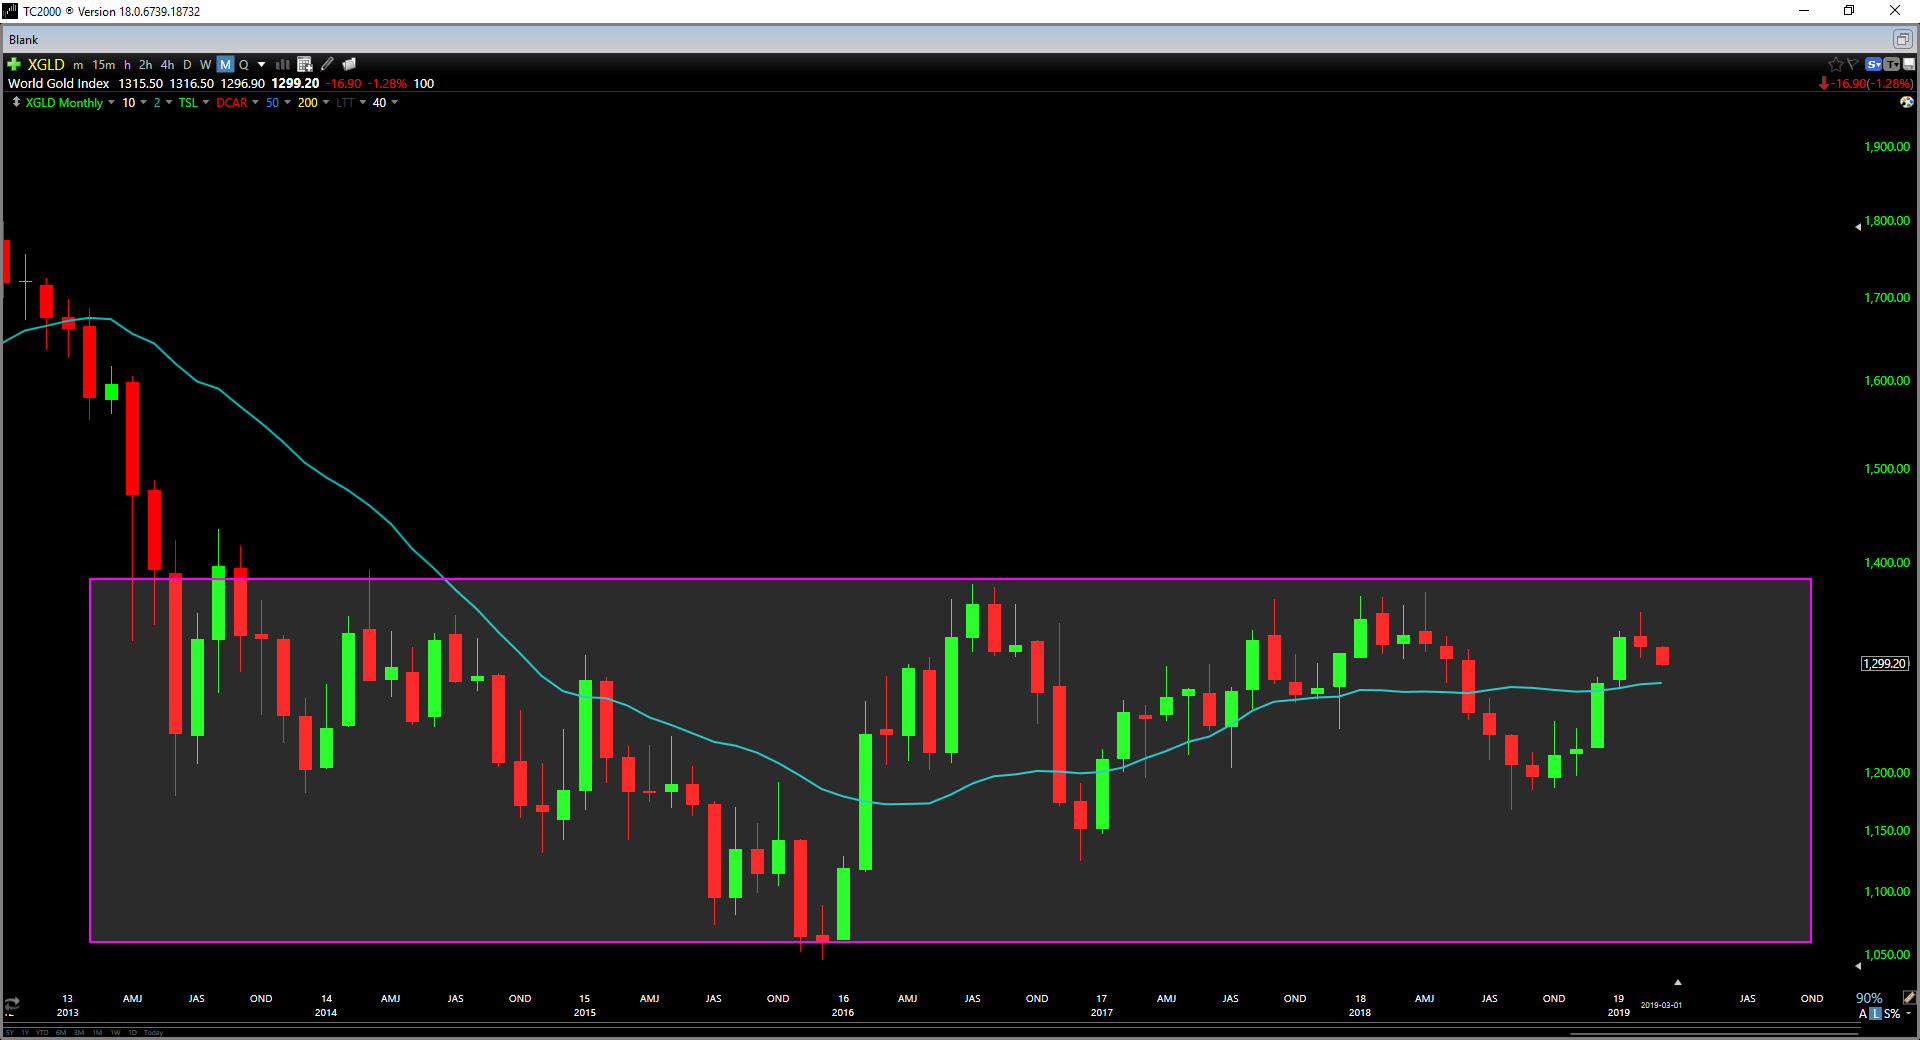
So what is the monthly chart of gold telling us? We're in a range, we're going sideways, and no side really has the edge here. The real battle lies at $1,365, and this is the key to likely starting a new bull market in gold. Unfortunately for the bulls, the bears have built a brick wall of resistance here and maul the bulls each time they attempt to scale this level.
 (Source: TC2000.com)
The good news for the bulls is that they are back above the 20-month moving average, and also above the 200-day moving average. This is a positive development as of the past couple months, and as long as the bulls defend $1,270 on a monthly close, they have the benefit of the doubt for the intermediate trend.
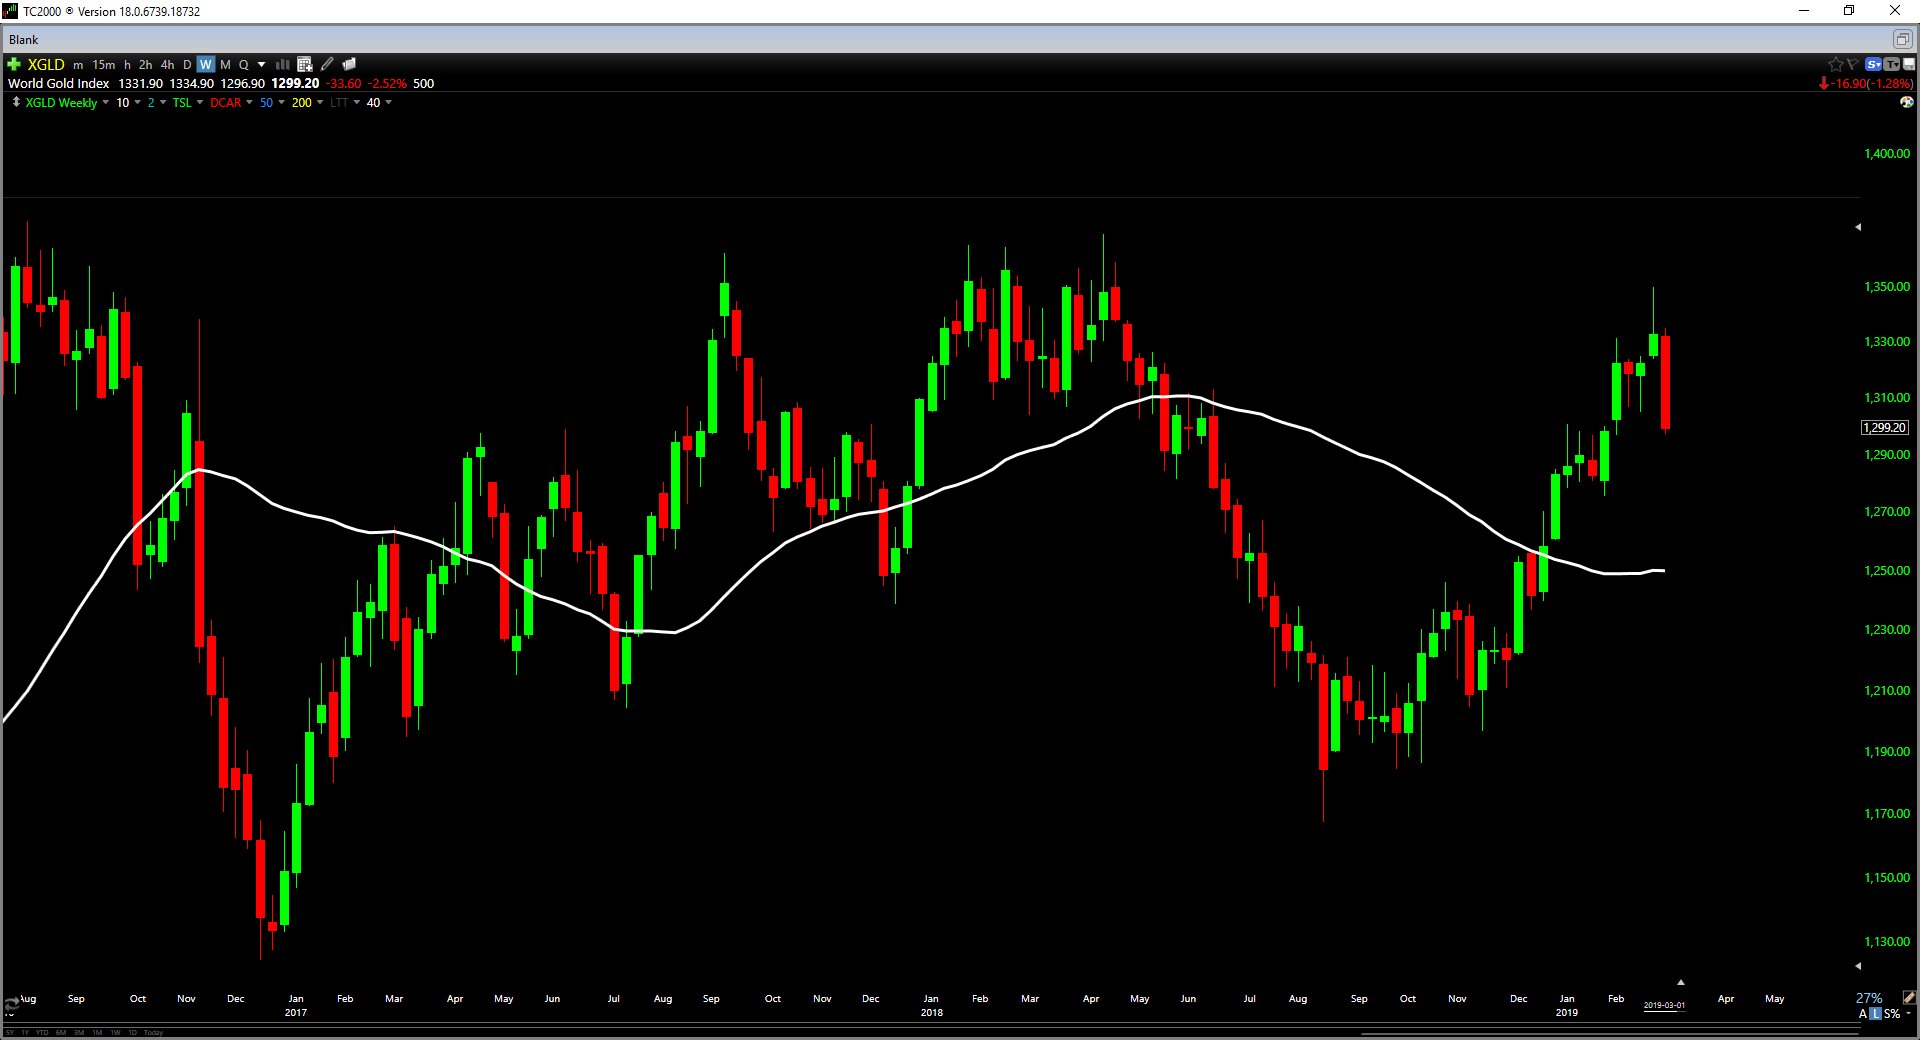
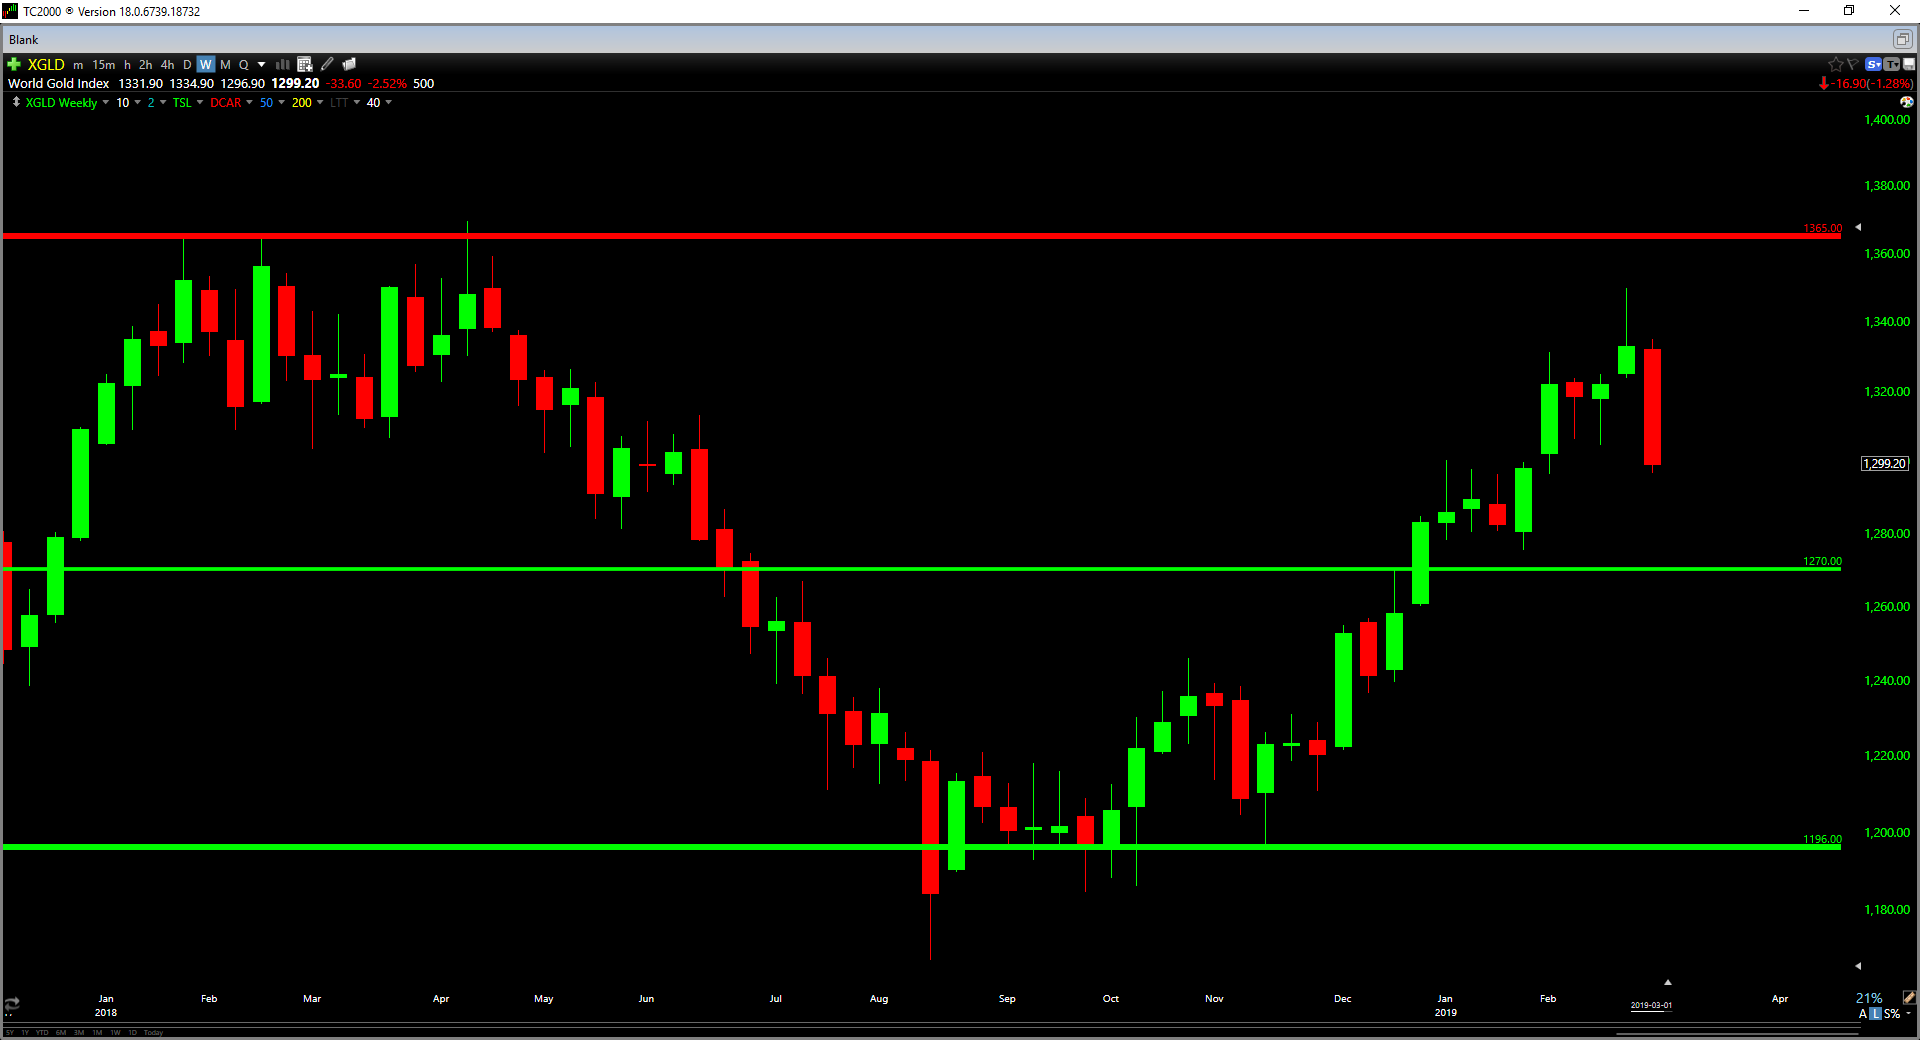
Moving to a weekly chart, the bulls finished the week back below the psychological 1,300/oz level, but they are still a few percent above support. As long as the bulls can defend $1,274/oz on a weekly closing basis, the weekly chart will remain bullish. A weekly close below $1,274/oz would not be ideal for the bulls and would begin to suggest this rally is a little suspect. The next strong support below $1,274/oz if that level is broken on a weekly close is $1,196/oz.
 (Source: TC2000.com)
As long as the bulls can defend $1,274/oz on a weekly close, we can give them the benefit of the doubt and consider this pullback to be an overdue correction in the uptrend. This means there's no reason to rush to sell out positions, though it's, of course, essential to own the better miners as the worst ones can barely stay afloat even with a sideways gold price.
 (Source: TC2000.com)
Based on the fact that gold remains in a range, I see no reason to be overweight miners here. While I have started positions in a few different miners in Q4 of last year and last month, miners as a group still make up just below 10% of my portfolio. I have no problem with dipping my toe in the water, but I still believe that it makes more sense to overweight general market leaders vs. miners until there's confirmation a new bull market in gold has started. The US Markets remain in bull markets, but gold remains in a consolidation zone, and I want to be overweight the strongest markets and underweight the lagging ones. If gold were to put in a monthly close above $1,365/oz, I would have no problem increasing my exposure to miners, but we're not there yet. I much prefer to react and adjust when the facts are on the table vs. predict and tie up money on what I think might happen.
 (Source: TC2000.com)
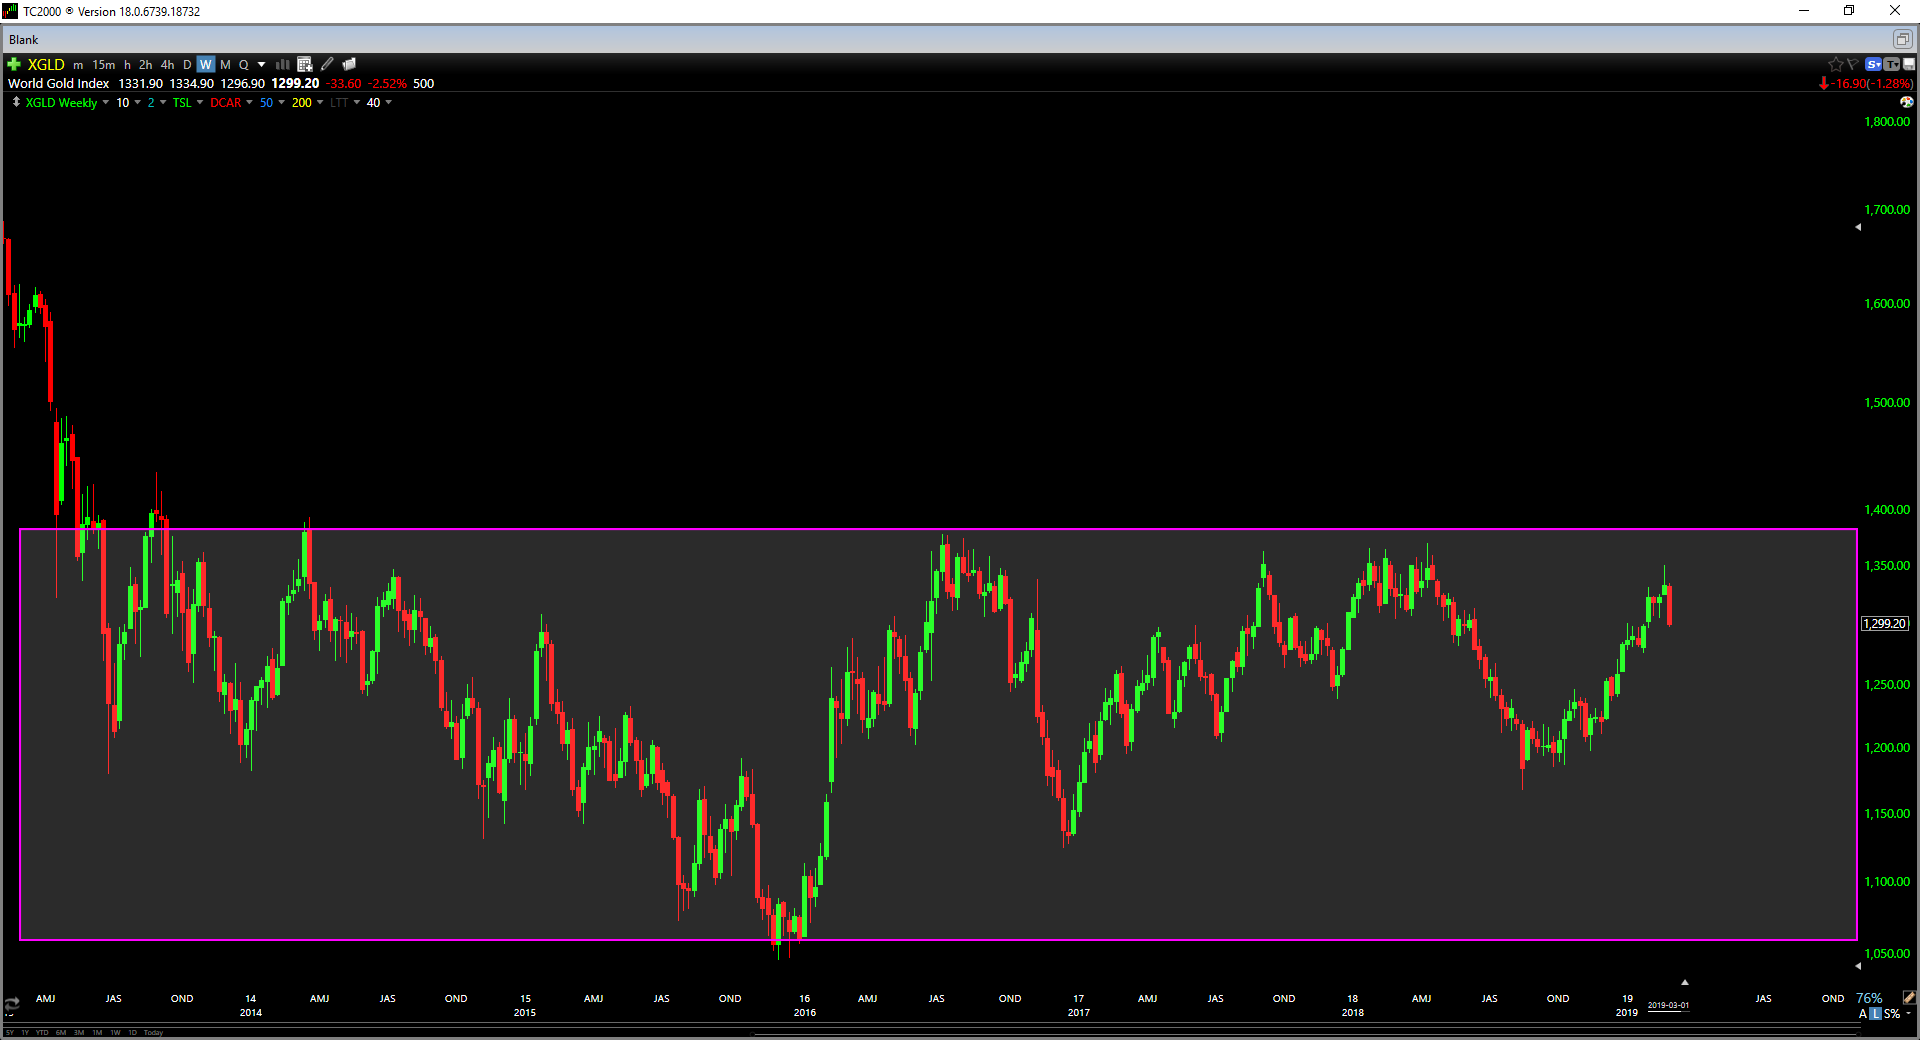
Based on the 40-year chart shown above, a resolution to this range is likely due in the next year or two, but we still don't know which way this thing breaks. If I had to bet I would say it resolves to the upside, but I don't position myself based on my feelings. There will be plenty of money to be made if we see a break and follow-through above $1,365, but until then, there are opportunities elsewhere that institutional money is flowing on a weekly basis.
In summary, the bulls remain in control of the medium-term trend here despite this pullback, but the real fireworks aren't going to start until we get through $1,365/oz. I remain long a few miners, but my exposure remains low for now. If the facts change, I will be the first to adjust, but for now, some exposure makes sense, but all-in seems unnecessary. There are nearly a hundred companies that are both fundamentally and technically stronger than even the best miners, and until that changes, I'll be keeping the majority of my chips spread out there.
If you liked this article, please consider following me for future updates!
Disclosure: I/we have no positions in any stocks mentioned, and no plans to initiate any positions within the next 72 hours. I wrote this article myself, and it expresses my own opinions. I am not receiving compensation for it (other than from Seeking Alpha). I have no business relationship with any company whose stock is mentioned in this article.
Editor's Note: This article covers one or more microcap stocks. Please be aware of the risks associated with these stocks.
Follow Taylor Dart and get email alerts