Gold Is Shaking Out The Latecomers
Gold's decline is necessary preparation for next phase of the recovery.
Improving China, copper outlooks support gold's longer-term uptrend.
Sellers are in control of gold's short-term trend for now, however.
Gold's broke a psychologically important trend line last week, announcing the commencement of its first real "correction" since November. The resulting flurry of commentaries on gold's future direction, many of them ending with a question mark, has already abated much of the enthusiasm for the metal that was ubiquitous prior to last week. Gold is clearly in the process of shaking out the latecomers to the bullish party, a process that will likely require several more days to complete. In today's report, however, we'll examine the signs that support gold's intermediate-term (3-9 month) recovery continuing once the latest shakeout has ended.
The gold price signaled that its immediate-term (1-4-week) upward trend was in the process of reversing earlier last week when its 15-day moving average was violated on a closing basis. This can be seen in the following graph depicting the recent performance of the April 2019 gold futures contract. The 15-day MA is the trend line used in this report to verify gold's immediate-term direction.
More importantly than this trend line, though, is the 50-day moving average, which many traders and investors implement as part of their decision making process. For that reason, the 50-day MA carries a much bigger psychological significance since it's programmed into countless trading algorithms and charting software packages. Whenever gold prices close above or below the 50-day MA for the first time in many weeks, it can create a self-fulfilling trend reversal by accelerating a move in the prevailing direction of prices. That was clearly the case on Friday when the gold price violated its 50-day MA, as evidenced by the above-average trading volume that accompanied the downside move (see chart below).
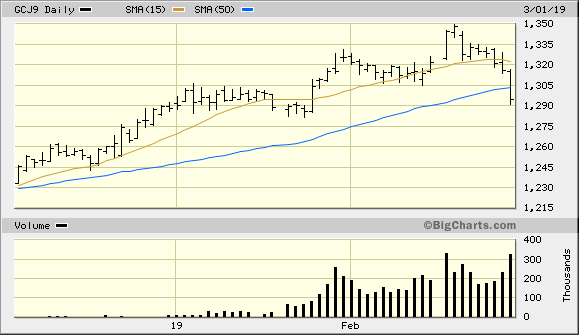
Source: BigCharts
Now that the gold price is under its 50-day MA on a weekly closing basis for the first time in over three months, there has already been a large degree of speculation as to whether its recovery since last year's bottom has ended. While the jury is still out on this question, the weight of technical and fundamental evidence suggests that gold is still in good hands and its intermediate-term recovery will likely continue once the latest shake-out has concluded. Let's review some of that evidence.
One of the biggest indications that gold's big-picture outlook remains strong is the resurgence in recent months of gold's biggest consumer, China, which consumes approximately 984 metric tons of the metal per year. China's improving manufacturing and economic outlooks for the coming year are reflected in the steady gains of its yuan currency, as well as its benchmark stock average - the Shanghai Composite Index. The Shanghai Composite is shown below, and you can clearly see the huge strides China's equity market has made since last year's slump. China led the global market lower last year on the uncertain trade outlook. However, with negotiations underway between China and the U.S. over ending the tariffs, stocks have apparently priced in an amicable resolution to the trade war.

Source: BigCharts
By ending the trade dispute, gold will eventually profit from the increased consumption from trade-reliant nations such as China, India, and other gold-loving industrialized countries. Also supporting a bullish outlook for China - and gold - in 2019 is the fact that Beijing is leading toward a more accommodative economic and monetary policy. As Guild Investment Management's Tim Shirata recently observed concerning China:
Last year, it began to shift back towards stimulus, and has been gradually implementing policies to stimulate credit growth, support lending to small and medium-sized businesses, and now to reduce some constraints on capital markets and bolster the role they play in the domestic economy."
Gold's longer-term prospects have largely risen and fallen with China's economic growth, as partially reflected by the major trends in the Shanghai Composite Index in the last 10 years. With the outlook for China's manufacturing sector on the mend, gold consumption and investment demand should see a corresponding increase in the months ahead. This should also prevent gold's latest correction from turning into an outright reversal of its six-month-old recovery.
Another indication that the China-led global manufacturing outlook is looking brighter is provided by one of the most economically sensitive of all commodities, namely copper. China has been among the world's biggest consumers of copper for two decades. Copper sentiment is also closed connected to the global economic outlook, with China playing an outsize role in this regard. A steadily rising trend in copper prices can therefore be attributed, in most cases, to a bullish outlook for the global economy. Copper's energetic performance so far this year belies a vastly improved global outlook for the foreseeable future. As the graph below testifies, the red metal has completely recovered all of its former losses from the last eight months. Significantly, this includes last summer's copper price levels from when the U.S.-China trade war first began.
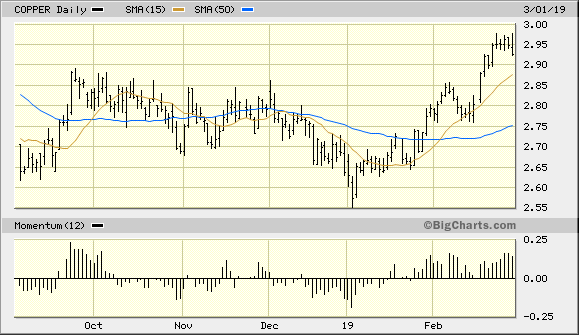
Source: BigCharts
The trend of the copper price, moreover, has a leading implication for the intermediate-term gold price trend. While not a perfect one-to-one leading indicator for gold, prolonged strength in the copper price is nonetheless a sign that metals demand in general is increasing. And what bodes well for copper sooner or later bodes well for other metals used in industrial applications, including gold and silver.
Returning to gold's technical picture, now that the widely-followed 50-day trend line for the gold futures price has been violated, at what price might the decline find support? That's the question most gold investors and traders are asking right now. While the answer to this question is strictly conjectural, a logical guess would be the next most important trend line of psychological significance. That of course would be the 200-day moving average, which most traders and investors are familiar with. In the April gold futures contract, the 200-day MA can be seen at around the $1,265 level.
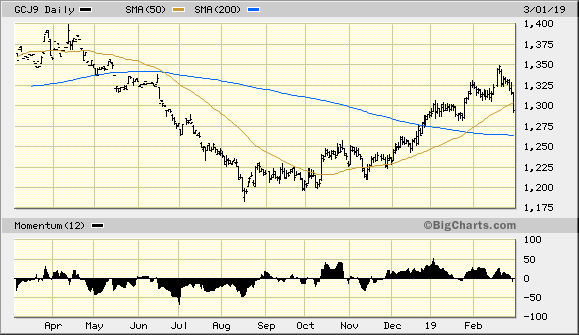
Source: BigCharts
Although the 200-day MA should not be considered a "magic bullet," it wouldn't be surprising to see the gold price test this important trend line and quickly find support somewhere near it. In the past, gold's 200-day MA has served as a turning point for the metal's intermediate-term price trends. In fact, last year's gold bear market was formally announced by a decisive close below the 200-day MA in May, followed by a failed test of that same moving average in June (see above chart). As long as gold's 200-day MA remains inviolate on a weekly closing basis, it can be assumed that the multi-month recovery in the metal is still alive and that the bulls still ultimately control the intermediate-to-longer-term trend.
Turning our attention to the gold-tracking vehicle used in this report, the iShares Gold Trust (IAU) confirmed a short-term sell signal on Mar. 1 when it violated my recommended stop-loss slightly under the $12.50 level. This puts me back on the sidelines and in a cash position as we await the next confirmed immediate-term bottom for gold. IAU also closed below its 50-day moving average (blue line, below) on a weekly basis for the first time since November. This puts IAU's intermediate-term trend in question, although I still expect the gold ETF to recovery by later this month once the latest "shake-out" of the latecomers to the market has ended.
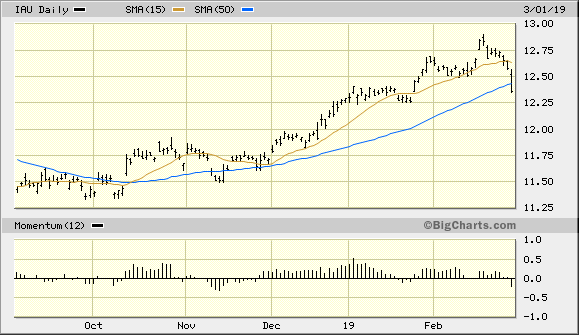
Source: BigCharts
Based on the global economic considerations for gold's leading consumers as discussed here, there are still reasons for believing that gold's big-picture trend remains bullish. From a technical perspective, gold's multi-month recovery can be considered to be still alive as long as the yellow metal price remains above its psychologically significant 200-day moving average. However, with the immediate-term trend now no longer supporting a rally, traders should be defensive while longer-term investors should hold off on making new purchases of the metal until we have a confirmed bottom in the gold price. A cash position is currently warranted for short-term-oriented participants, as mentioned above.
Disclosure: I/we have no positions in any stocks mentioned, and no plans to initiate any positions within the next 72 hours. I wrote this article myself, and it expresses my own opinions. I am not receiving compensation for it (other than from Seeking Alpha). I have no business relationship with any company whose stock is mentioned in this article.
Follow Clif Droke and get email alerts