Gold: Is The $1,300 Level Next?
The price momentum or average gold price is $1,283, and the market closing above it, activated the S1 of $1,298 and S2 of $1,306.
If we come back down below $1,299 after completion, you will probably be stopped out and go neutral.
If it goes down below $1,283, after making it up to the targets at S1 and S2, it would activate B1 of $1,274 and B2 of $1,260.
Looking Back
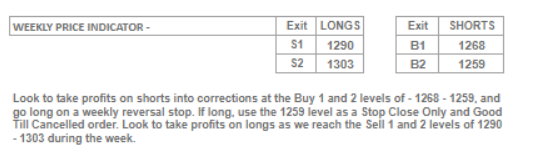
We published a report on Seeking Alpha on April 22, 2019, called "Special Gold Alert: Is the $1,456 Handle Possible in 2019?" In that report, we looked at price relationships in gold in the structure of the supply and demand levels that is identified by the Variable Changing Price Momentum Indicator (VC PMI) artificial intelligence. It identifies the average price and two levels above the average price, the sell 1 (S1) and sell 2 (S2) levels, and two extreme levels below the mean, which are the buy 1 (B1) and buy 2 (B2) levels. In the report, we said that $1,281 was the average price, and if the market came down below $,1281, it would activate the extreme levels below the mean.
Quoting from the report: "The B1 level as we come into next week is $1,268, which is the extreme level below the mean of $1,281, and the buy 2 (B2) level is $1,259. The B1 level is the 1-to-1 relative implied volatility, which automatically identifies for you that when the price touches this level, there's a 90% probability that the price will revert back to $1,281. If it touches the B2 level there's a 95% probability that a reversion will occur back up to $1,281, which is the average price for this coming week. If we close above $1,281, it activates the S1 level above the mean of $1,290 and S2 of $1,303."
When the VC PMI identifies a bearish trend or a bearish price momentum, it activates the extreme levels below the mean. In this case, if the market comes down to $1,268, it activates the B1 level. If you're short, cover your shorts and reverse to the long side.
A Specific, Precise Methodology
We teach our subscribers this specific methodology to follow the price as it activates the pivot levels or levels of demand. In this case the B1 level of $1,268. Prospectively, our members or traders get this information ahead of time and are prepared to activate the trigger points which we teach in our elite Live Trading Room.
The first time the market comes down to $1,268, the methodology says that if you are short to cover your position and go neutral. Then you wait for the market to close above or below that level, which activates the trigger point. In this case, the B1 level as we came into this week is the extreme level below the mean of $1,281. The B2 level is $1,259. The B1 is one-to-one relative implied volatility, which tells you that if the price touches that level, there's a 90% probability that the price will revert back to the mean of $1,281.
If we look at the low made on April 23 of $1,267.90, it activated the B1 level. The price closing above $1,268 activated the buy trigger point, automatically reversing the signal from short to an active long signal confirming the 90% probability that the price should revert back to the mean of $1,281. If short, we recommended that you cover at $1,268. If you got the signal, you then went long at $1,268, and your first target was $1,281. You then went neutral again and waited for the price to close above it. If it closed above it, it activated the extreme levels above the mean.
In the April 22 report, we said, "If we close above $1281, it activates the S1 level above the mean of $1290 and the S2 of $1303." The high that was made on the 26th was at $1,290.90 and gold closed at $1,288.40.
A $13/ounce Profit
If we review the movement of the algorithm, if you came into this past week short, covered at $1,268, reversed and went long with your first target at $1,281, you did well. A close above $1,281 activated the target of $1,290, which was completed on Friday. This shows the accuracy of the artificial intelligence underlying the VC PMI, which uses the relative implied volatility of the market to identify targets above and below the mean.
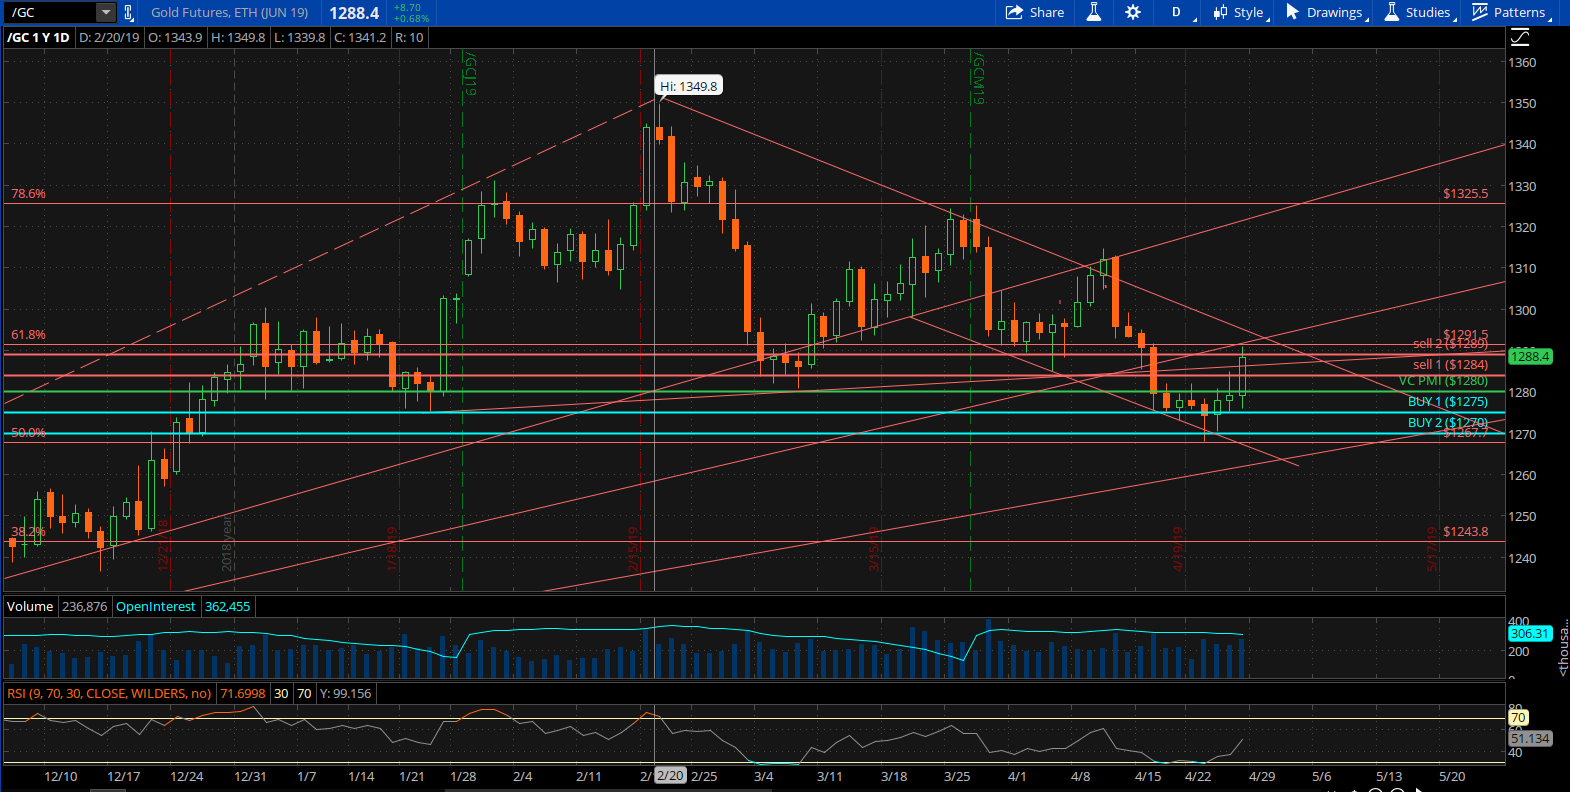
In our charts, green highlights the average price, while red highlights supply and blue demand.
After meeting the target of $1,268, gold reversed and met the target of $1,281, which was a phenomenal return for a trade. A $13 move per ounce in the price of gold. From $1,281 to $1,290 is a $9 move per ounce in gold. The VC PMI structure allowed you as a day trader as of Friday to complete two trades totaling $22 per ounce, which, based on one futures contract, equals a $2,200 profit. The great thing about the algorithm is that it can be used in other instruments, derivatives, options, stocks, indexes or ETFs with the same probabilities. You can activate any of these derivatives using the futures signals prescribed by the VC PMI.
Investors and Speculators: How to Use Stops
We have a user make a comment about JNUG, which I am long, and asked how to buy into the position, as well as whether I would risk the position down to zero. It's important to point out, that, as a self-directed individual, you need to identify your trading objectives and your trading plan first. Once you decide on a certain amount of capital to work with, select a market and decide as a self-directed trader whether you want to speculate or invest on the trade.
These are two major strategies that need to be defined in detail. If you speculate, you are looking for short-term trading opportunities and then you have to ask: How do I manage that risk? This is what we are talking about when we use stops. After 30 years in the business, the Equity Management Academy's CEO and chief trader, Patrick MontesDeOca said, "stops are for fools," especially if you use straight stops.
Markets are driven like magnets toward stops to be taken out. Often once a market takes out your straight stop, it will reverse back to the same level it was before. The artificial intelligence of the VC PMI suggests that when you use stops, don't use straight stops, use a time frame close. If you are a day trader, use the 15-minute bar chart, and only use stops on the close of that 15-minute signal. This has proven to be in the majority of cases more accurate than being stopped out constantly, which occurs to most short-term traders.
Harmonic Convergence
When you are investing on the trade and we are coming into what we call a harmonic convergence, in the report we wrote: "The annual moving average of $1,251 identified above comes very close to the B2 weekly level of $1,259," MontesDeOca said. The $1,251 continues to be the average price for 2019. "So I believe we are looking at a potentially harmonic alignment developing between the weekly and the annual levels that has a very high probability that the market reversion to the mean will unfold."
When the VC PMI identifies these levels of harmonic convergence, this is usually a time for you to become an investor, not a speculator. You can speculate to see the market's reaction until it gets to these levels where the alignment takes place harmonically in all three trends (daily, monthly and yearly), which signifies that there's a change in the major underlying trend occurring. In this case, the VC PMI identified that the trend is in the level of accumulation of demand - B1 is at $1,261, which is where you should cover your shorts, reverse and go long. This is how specific the VC PMI is in providing entry and exit levels for trades.
JNUG
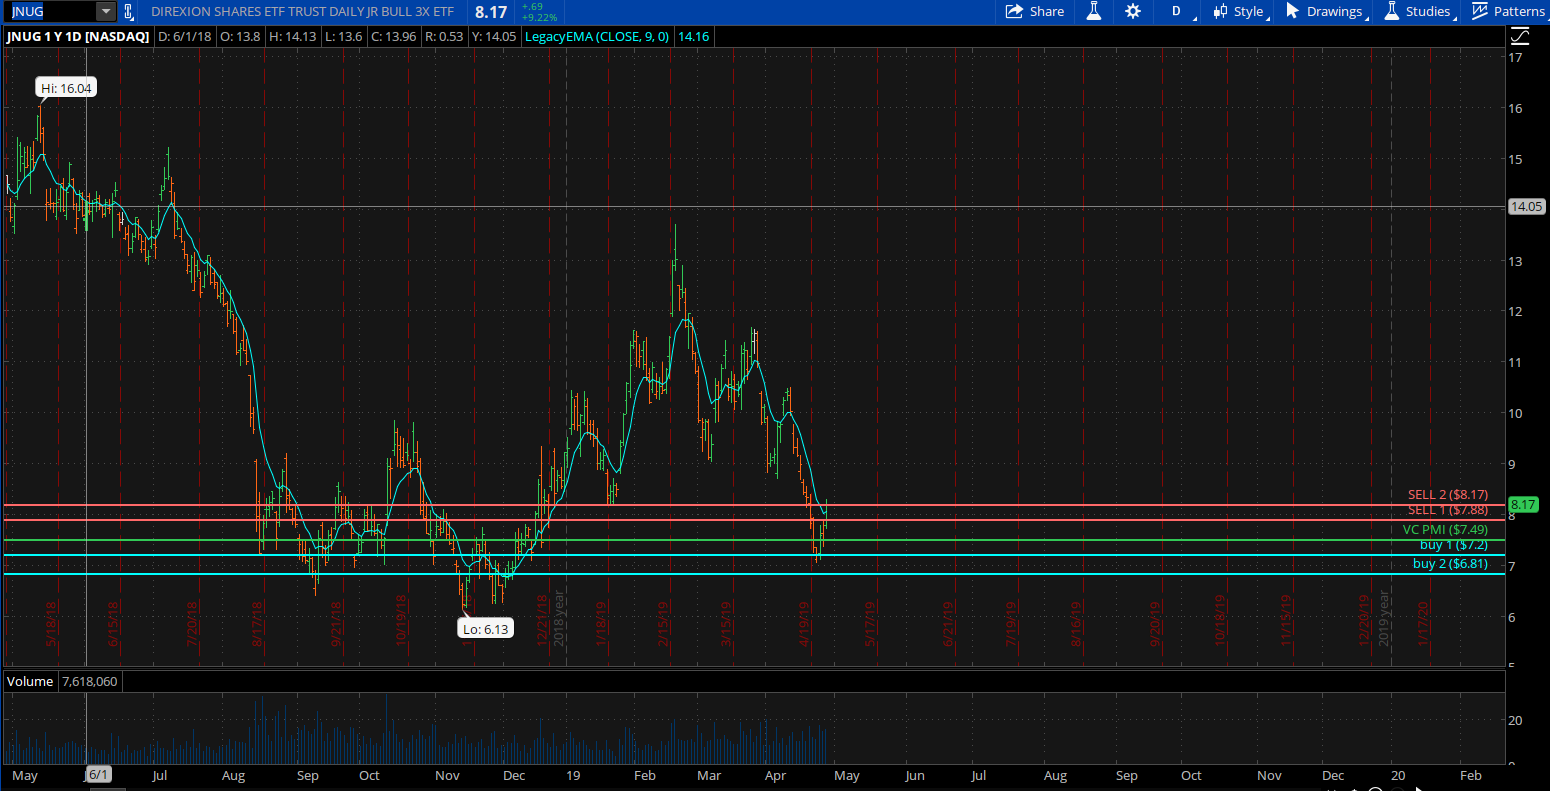
When you are investing and using the harmonic convergence, you can afford to buy an asset, an ETF such as JNUG. A short-term to inter-mediate trading instrument. When the market was trading around $1,268, JNUG was trading around $7 a share. When gold reverted through $1,281 and got up to $1,290, JNUG moved up to a high of $8.29 on Friday. A gain of 18.4%.
Overview
The Direxion Daily Gold Miners Index Bull and Bear 3X Shares seek daily investment results, before fees and expenses, of either 300% or 300% of the inverse (or opposite) of the performance of the NYSE Arca Gold Miners Index. There's no guarantee the funds will meet their stated investment objectives.
These leveraged ETFs seek a return that is 300% or -300% of the return of their benchmark index for a single day. The funds should not be expected to provide three times or negative three times the return of the benchmark's cumulative return for periods greater than a day.
The difference is that JNUG is a very volatile ETF, so it can produce some amazing results, but also can go against you by a larger percentage than the majority of one-on-one assets or ETFs you would be able to buy without leverage. Direxion funds make it available now for traders to speculate without margin by buying these ETFs as dollar per share.
One advantage of an ETF like JNUG, is if you buy 10,000 shares, you can scale out of your position by selling some of your position bit by bit over time. If you own one futures contract, you would have to sell it all. JNUG allows you to hold it overnight, too. Furthermore, when the VC PMI identifies a harmonic convergence, there's really no need to use a stop. You have the luxury of holding onto your ETF until it reaches your price, as in the case above.

The VC PMI identifies simultaneously the structure you can use for each of these derivatives that are based on the price of gold. They allow you to manage your risk according to your size and the type of speculator or investor that you are.
Looking Ahead
First Filter
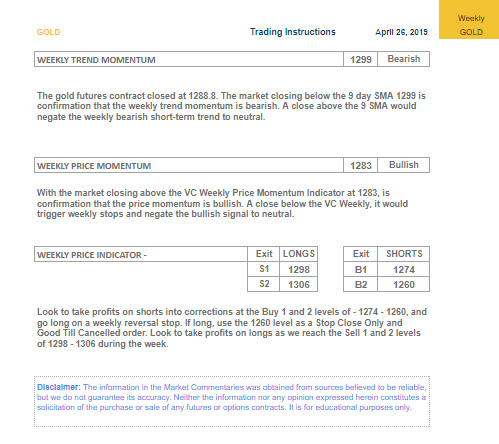
Looking forward into next week, we see that the gold market closed on Friday at $1,289. The market closing below the nine-day moving average of $1,299 confirms that the weekly trend momentum is bearish coming into next week. The artificial intelligence of the VC PMI also says that if the market closes above $1,299, the trend momentum will negate this bearishness and return to neutral. This is the first measure of reversion you can use coming into next week.
Second Filter
The weekly price momentum is at $1,283 coming into next week. With gold closing above $1,283, we are coming into next week with a bullish price momentum. It activates the S1 level of $1,298. S2 is at $1,306. If we come down below $1,283, the signal would go neutral and the bullish price momentum would be negated.
Third Filter
A second close below $1283 would activate the B1 level of $1274 to the B2 level of $1260. The artificial intelligence even tells us that if you are long, you should take profits at $1,298, then wait. If the price then closes below $1,298, it would activate the weekly short trigger point, with a target of $1,283. If we close below $1,283, it would activate the B1 level of $1,274 to the B2 level of $1,260.
The VC PMI Automated Algorithm
We use the proprietary Variable Changing Price Momentum Indicator (VC PMI) to analyze the precious metals markets and several indices. The primary driver of the VC PMI is the principle of reversion to the mean ("Mean Reversion Models of Financial Markets," "The Power of Mean Reversion in Factor-Based Investing"), which is combined with a range of analytical tools, including fundamental logic, wave counts, Fibonacci ratios, Gann principles, supply and demand levels, pivot points, moving averages, and momentum indicators. The science of Vedic Mathematics is used to combine these elements into a comprehensive, accurate, and highly predictive trading system.
Mean reversion trading seeks to capitalize on extreme changes in the price of a particular security or commodity, based on the assumption that it will revert to its previous state. This theory can be applied to both buying and selling, as it allows a trader to profit on unexpected upswings and buy low when an abnormal low occurs. By identifying the average price (the mean) or price equilibrium based on yesterday's supply and demand factors, we can extrapolate the extreme above this average price and the extreme below it. When prices trade at these extreme levels, it's between 90% (Sell 1 or Buy 1 level) and 95% (Sell 2 or Buy 2 level) probable that prices will revert back to the mean by the end of the trading session. I use this system to analyze the gold and silver markets.
Strengths and Weaknesses
The main strength of the VC PMI is the ability to identify a specific structure with price levels traders can execute with a high degree of accuracy. The program is flexible enough to adjust to market volatility and alerts you when such changes take place, so one can adjust strategies accordingly. Such changes include when the market breaks out of a consolidation phase or a trend accelerates. Such volatility usually happens when the market has produced a signal at the S2 or B2 level, and the market closes above or below these extreme levels.
The day trading program then confirms that a higher fractal in price has been identified, and the market will move significantly higher, although the same principle applies if the market falls significantly. By the price closing above the S2 level, it indicates that the buying demand is greater than the supply. This means that the market has found support for the next price fractal. Conversely, the price closing below the B2 level indicates that the selling pressure has met demand greater than supply at the extreme below the mean, and prices should revert back to the mean.
The basic concept of the VC PMI is that the program trades the extremes of supply and demand based on the average price daily, weekly, and monthly.
The strongest relationship we find in the algorithm is when the daily price is harmonically in alignment with the weekly and monthly indicators. We call this "harmonic timing." Such an indication produces the highest probability (90%) that the price will revert from these levels to its daily, weekly, or monthly average.
To learn more about how the VC PMI works and receive weekly reports on the E-mini, gold and silver, check out our Marketplace service, Mean Reversion Trading.
Disclosure: I am/we are long JNUG. I wrote this article myself, and it expresses my own opinions. I am not receiving compensation for it (other than from Seeking Alpha). I have no business relationship with any company whose stock is mentioned in this article.
Follow Equity Management Academy and get email alerts