Gold Junior Miners: A Bearish Push Is Coming to Move Them Lower / Commodities / Gold and Silver Stocks 2022

Let's not be confused by the temporaryUSDX weakness. Junior miners are faint and we can expect them to decline againsoon.
Apriland May Replay?
Although history doesn’t repeat itself tothe letter, it rhymes. At least that’s what tends to happen in the financialmarkets.
In today’s analysis, I’ll explain why Ithink we’re about to see another example of the above in the case of juniormining stocks. There’s a technique that suggests one thing, but there’s alsoanother that suggests that a 1-to-1 analogy wouldn’t be as good a fit, as aslight deviation from it.
So far, the situation in the GDXJ – aproxy for junior mining stocks – has been similar to what happened in thesecond half of April and early May.
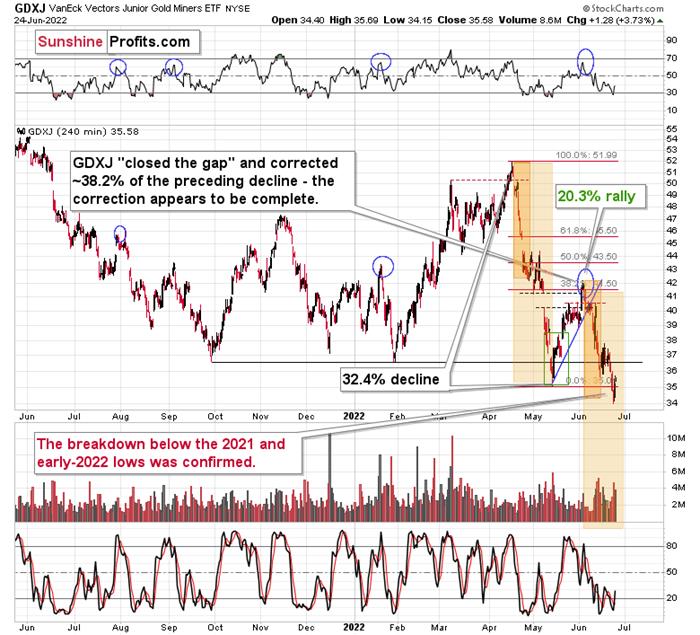
I even marked those similar periods withorange rectangles. We saw a small consolidation right after the end of thesmaller rectangle, so history had already proved to be repeating itself.
However, let’s see what happeneddifferently. This time, the initial decline (so the smaller rectangle) was notas steep as it was in April, and the following consolidation was shorter andnarrower, too.
What does it tell us? No, I don’t meanthe obvious “well,it’s not identical” here. The price moves are smaller either becausethe entire current short-term downswing is smaller (so, a smaller initial partand then a smaller final part would together create a smaller version of whatwe saw in April and May), or because this time, the structure of the price moveis going to be a bit different.
If the latter is the case, it means thatthe decline can actually be bigger thanwhat we saw in April-May, not smaller.
Looking at the charts featuring gold andthe general stock market, we can tell that the latter of the abovescenarios is more likely being realized.
Why? Because junior miners are weakrelative to both: gold and the stock market.
Did gold move to new 2022 lows recently?Or below its 2021 lows?
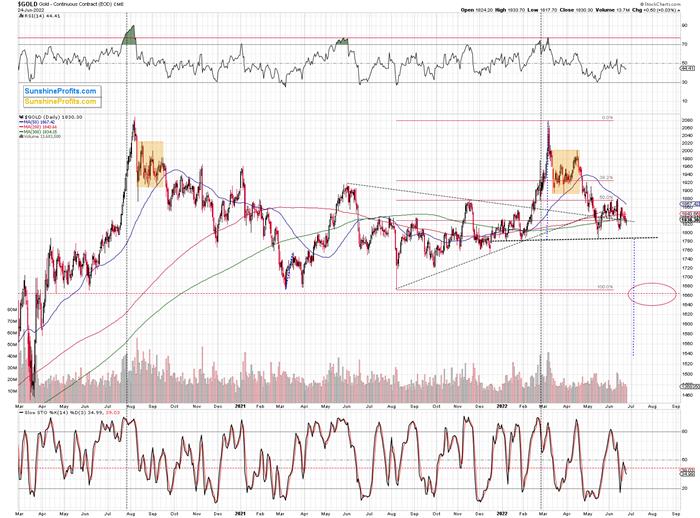
Nope, it’s not even particularly close tothose levels. In fact, golddidn’t even move below its recent lows on Friday.
What about the general stock market – didit slide profoundly recently? If it did, it might have explained juniors’weakness, as both juniors and the general stock market are relatively highlycorrelated (compared to how correlated is the general stock market is withother parts of the precious metals sector).
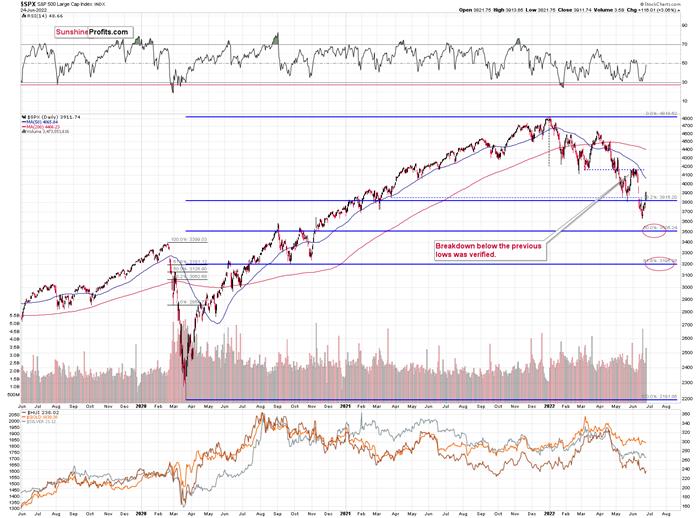
Actually, the general stock marketrallied last week, and it invalidated its previous breakdown below the recent and 2021 lows. In fact, the S&P 500Index was up by over 6% last week!
Was GDXJ up by over 6% too? No. It wasdown by over 3%, and profits on our short positions in juniors have increasedonce again.
Thejuniors are weak. Period.
This tells us that it’s more likely thatthe deviation from the history that is not repeating itself to the letter willbe toward something more bearish than the 1:1 analogy would be.
Does it complicate the outlook oranalysis right now? Actually, it’s the opposite, because the above perfectlyfits what was visible on broader charts all along!
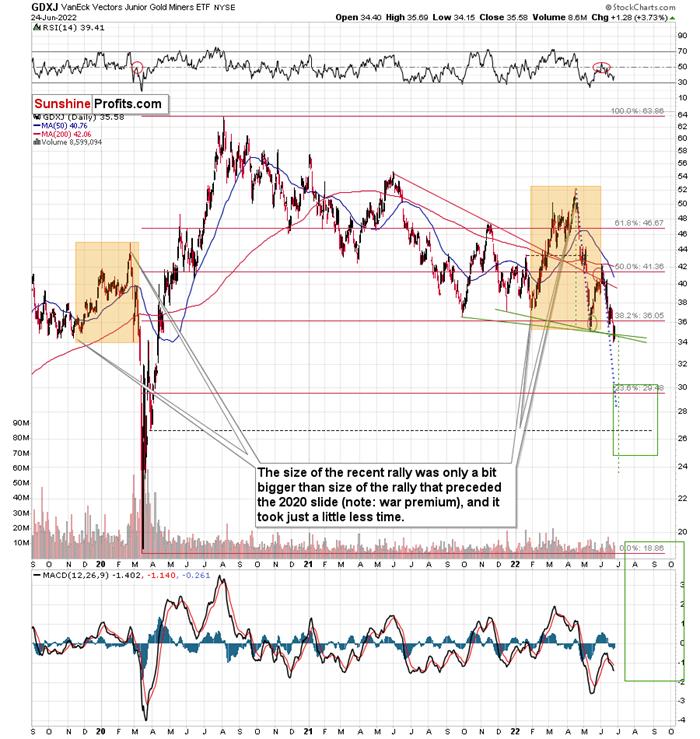
Ipreviously explained that the next target for the GDXJ is likely around the$26-27 area.
That’s below the 1:1 analogy-based targetthat would be at “just” $28 as the blue, dotted lines would indicate.
Additionally, please note that the GDXJis likely about to complete a head-and-shoulders pattern. Actually, it doesn’t matter if we use the late-2021 rally as the leftshoulder or the late-2021 – early-2022 one, as the early-2022 rally is stillthe head, and the target based on the formation is the same in both cases. Imarked the neck levels with green, solid lines, and I marked the downsidetarget based on the potential formation with green, dashed lines – it’sslightly below $24.
The formation is only “potential” at thistime, as we would need to see a confirmed breakdown below the neck level to saythat the formation is complete. This would mean a breakdown below ~$34.
Giventhe kind of weakness that we saw in junior miners recently, it seems that wewon’t have to wait too long for the above to take place.
Speaking of time, the month is ending,and this might ring some bells…
TheUSDX Tendency
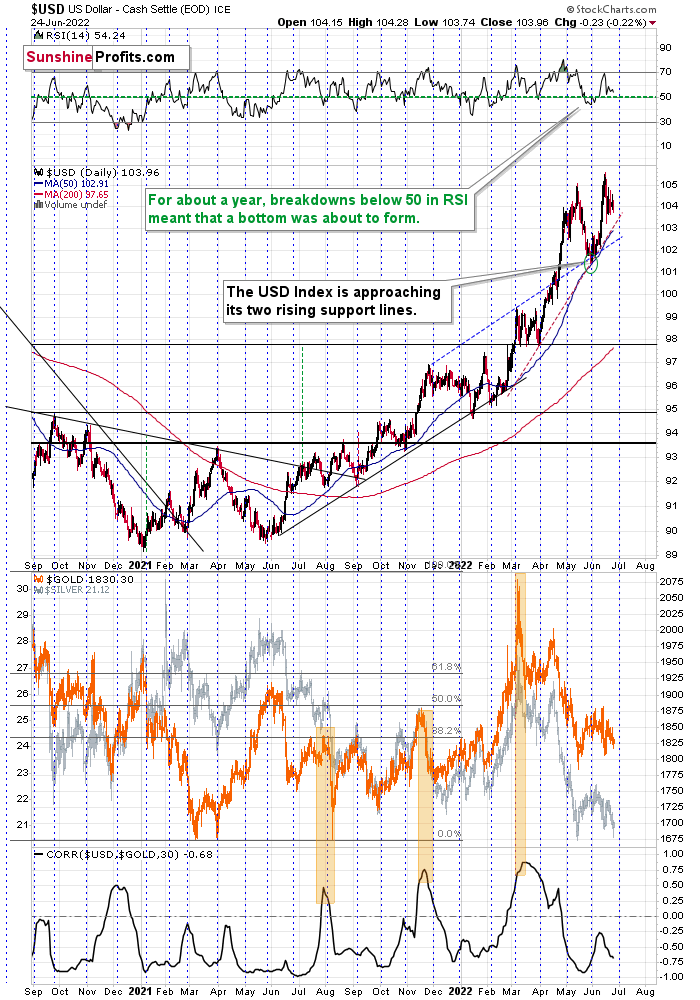
The USD Index tends to turn around at theturn of the month, usually bottoming out at that time. For example, thathappened about a month ago and three months ago.
The month ends this Thursday. Thistendency works on a near-to basis, so the exact bottom might or might not formon Thursday, but it doesn’t seem that we’ll need to wait for this bottom forlong.
Based on junior’s weakness, we see thatthey just “can’t wait” to move lower, and the above USD Index chart tells usthat they are likely about to get a bearish push.
Let’s not forget about the forest whilelooking at trees. The recent brief decline in the USD Index is likely just ahandle of a cup-and-handle pattern that – when completed – is likely to takethe USD Index much higher.
Most importantly, the entirecup-and-handle pattern (so basically the May-now performance) is a big handleof a much bigger cup-and-handle pattern that you can see on the long-term USDIndex chart.
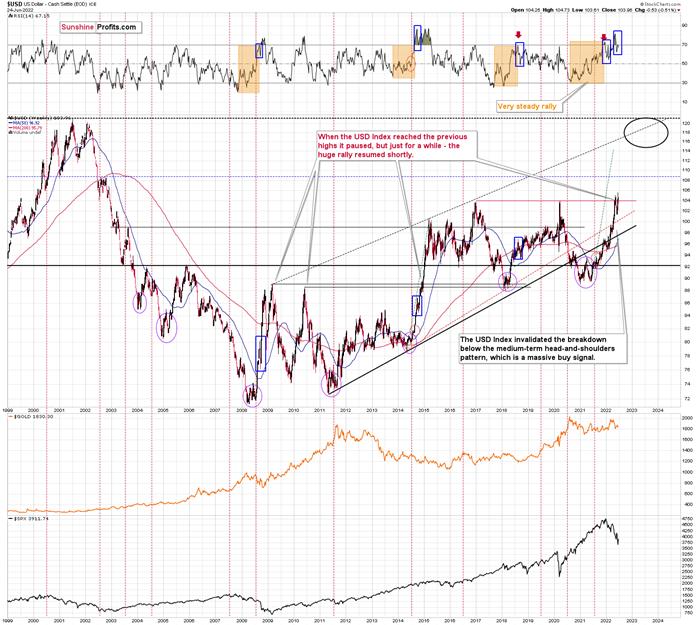
This means that once the USD Index breaksand confirms the breakout above the previous highs (and it’s likely to do so inthe near future), it’s likely to soar.
Thisis bearish for the precious metals market – extremely so. Gold’s back-and-forth movement is likely about to end, just likejunior miners are indicating. Gold’s next important stop (not the final end ofthe entire medium-term decline, though) is likely to be at its 2021 lows orclose to them.
Thank you for reading our free analysistoday. Please note that the above is just a small fraction of today’sall-encompassing Gold & Silver Trading Alert. The latter includes multiplepremium details such as the targets for gold and mining stocks that could be reached in the next few weeks. If you’dlike to read those premium details, we have good news for you. As soon as yousign up for our free gold newsletter, you’ll get a free 7-day no-obligationtrial access to our premium Gold & Silver Trading Alerts. It’s really free– sign up today.
Przemyslaw Radomski, CFA
Founder, Editor-in-chief
Toolsfor Effective Gold & Silver Investments - SunshineProfits.com
Tools für EffektivesGold- und Silber-Investment - SunshineProfits.DE
* * * * *
About Sunshine Profits
SunshineProfits enables anyone to forecast market changes with a level of accuracy thatwas once only available to closed-door institutions. It provides free trialaccess to its best investment tools (including lists of best gold stocks and best silver stocks),proprietary gold & silver indicators, buy & sell signals, weekly newsletter, and more. Seeing is believing.
Disclaimer
All essays, research and information found aboverepresent analyses and opinions of Przemyslaw Radomski, CFA and SunshineProfits' associates only. As such, it may prove wrong and be a subject tochange without notice. Opinions and analyses were based on data available toauthors of respective essays at the time of writing. Although the informationprovided above is based on careful research and sources that are believed to beaccurate, Przemyslaw Radomski, CFA and his associates do not guarantee theaccuracy or thoroughness of the data or information reported. The opinionspublished above are neither an offer nor a recommendation to purchase or sell anysecurities. Mr. Radomski is not a Registered Securities Advisor. By readingPrzemyslaw Radomski's, CFA reports you fully agree that he will not be heldresponsible or liable for any decisions you make regarding any informationprovided in these reports. Investing, trading and speculation in any financialmarkets may involve high risk of loss. Przemyslaw Radomski, CFA, SunshineProfits' employees and affiliates as well as members of their families may havea short or long position in any securities, including those mentioned in any ofthe reports or essays, and may make additional purchases and/or sales of thosesecurities without notice.
Przemyslaw Radomski Archive |
© 2005-2019 http://www.MarketOracle.co.uk - The Market Oracle is a FREE Daily Financial Markets Analysis & Forecasting online publication.