Gold Juniors Index: Are The Bulls Asleep At The Wheel?
The Gold Juniors Index broke below key support last week at $30.20.
At the same time as this is occurring, the Gold Miners Bullish Percent Index is also showing signs of weakness.
These developments do not bode well for the index medium-term, and I continue to remain underweight the sector.
After a reasonable start to the year for the Gold Juniors Index (GDXJ), the bears have reared their ugly heads once again to crash the party. The index has gone from a positive return of 5% at the end of Q1 to a negative return for the year as we head into the back half of April. During previous dips, the bulls showed up almost immediately to play defense, and this was a sign that they were prepared to put up a fight. Unfortunately, this time around, it seems like they're busy sleeping at the wheel. The Gold Juniors Index broke below critical support at $30.20 last week and has also dropped back below its 200-day moving average like it wasn't even there. While an oversold bounce is undoubtedly possible after seven down days in a row for the index, the bears have now established a key resistance line at $31.55 that the bulls will need to reclaim on a weekly close to ease this new bout of selling pressure. I continue to remain underweight to the sector with only one miner in my Canadian Portfolio, and none on the US Market currently.

(Source: ShutterStock.com, Author's Photo)
Up until earlier last month, we were seeing a subtle change of character in the mining sector with the bulls showing up with gnashing teeth to thwart any raids by the bears. Any pullbacks of 7-10% were followed by strong pushes higher almost immediately, and each dip was occurring at a successively higher low. Since the February 20th high, the index has seen a slight change of character that's been confirmed with the lethargic weekly close on Friday. The index has now established a lower low, and this has invalidated the prior uptrend that began on January 2nd. As we can see in the below chart, the subtle differences in character are apparent, especially after the lower low put in on Thursday's close. The bad news for the bulls is that this technical weakness is showing up with an emergence of new 52-week lows in the sector. While GDXJ's inclusion of silver miners is to blame for this, it does not bode well for the sector medium-term. The fact that the Gold Miners Bullish Percent Index is also under pressure is not an ideal development. Let's take a closer look below.
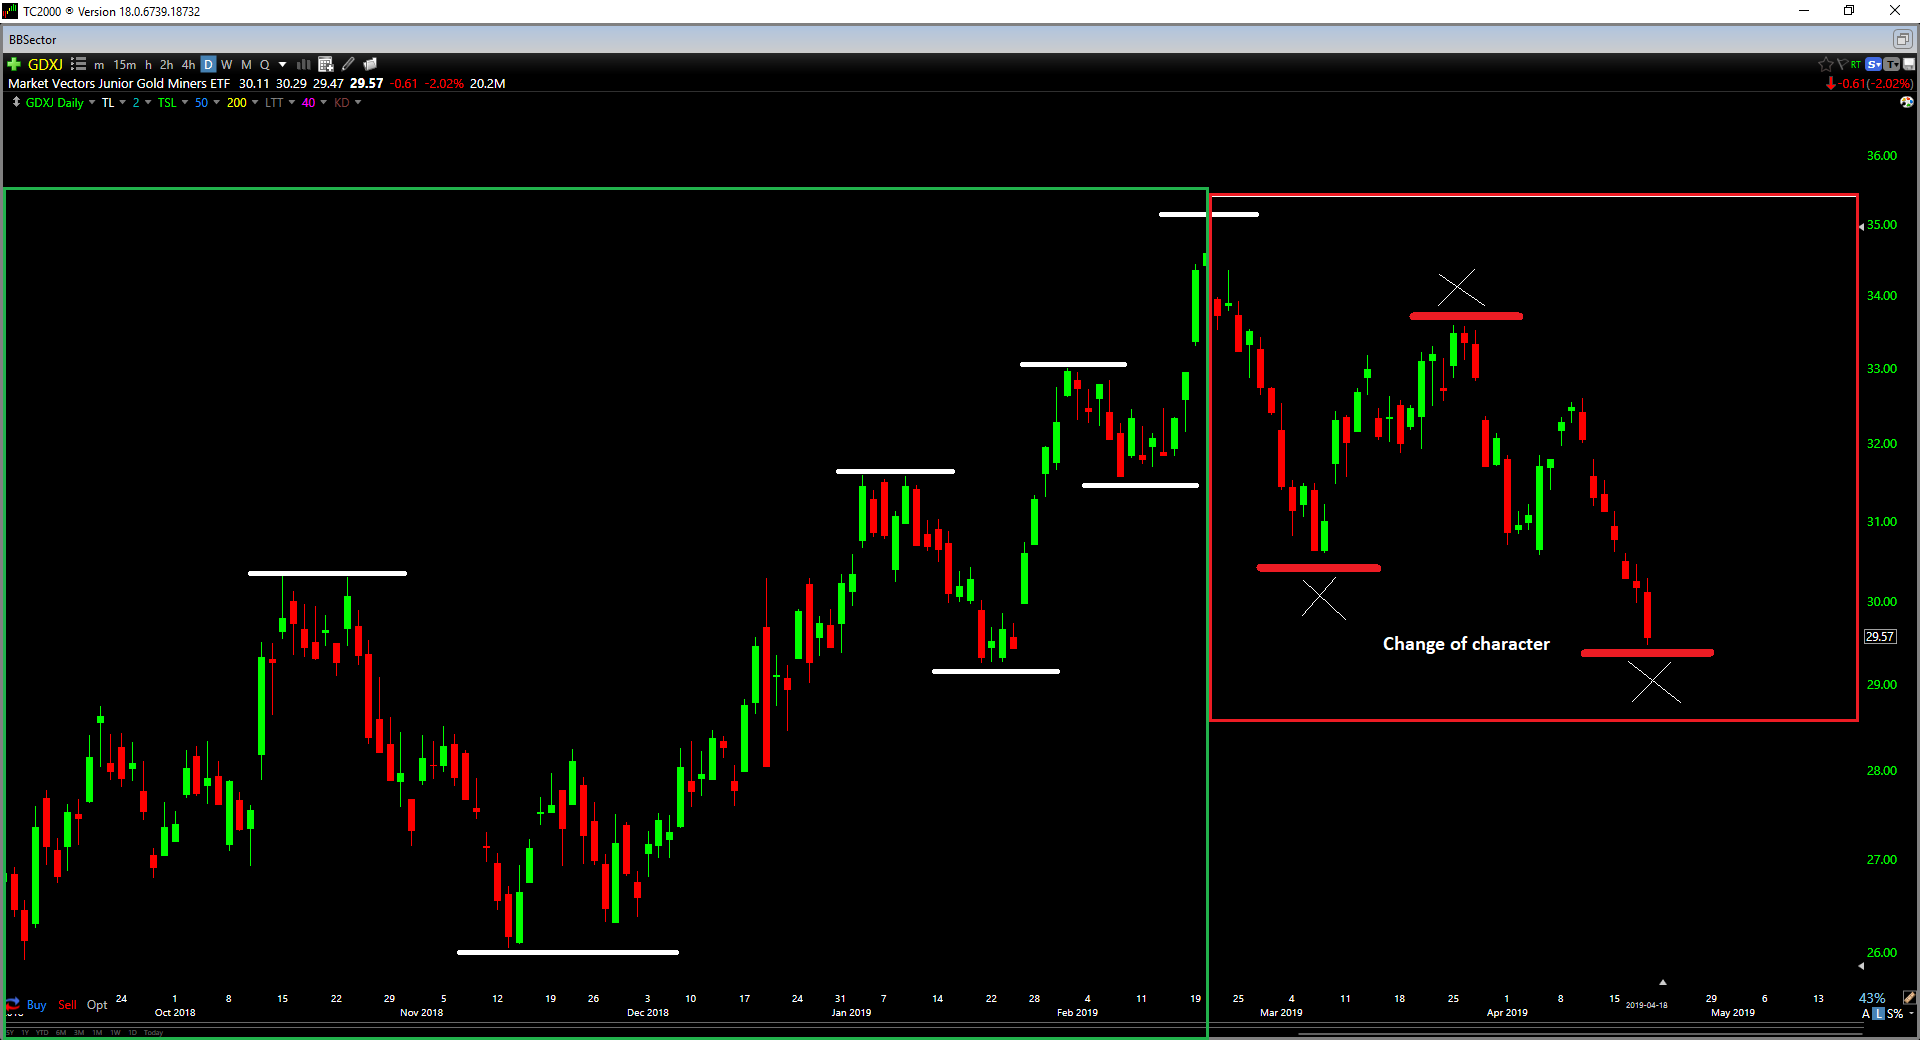
(Source: TC2000.com)
Miners Bullish Percent Index
Taking a look at the Gold Miners Bullish Percent Index, the index fell below its 50-day moving average (blue line) earlier this week and has been unable to climb back above it so far. While drops below this key moving average can often be whipsaws when the bullish percent index is at low readings, it tends to be a more reliable indicator from the 45%+ level. As we can see from the below chart, the index's drop below this moving average in March last year was followed by another high, but this rally was short-lived, and selling pressure remained strong followed this March violation after what was a brief bounce.
We saw the same thing occur March 2017 when the market soared off of its lows, broke the 50-day moving average, and then the Gold Juniors had a rocky remainder of the year. This most recent drop beneath the 50-day moving average is not a death knell for the index by any means, but it is an adverse development short-term.
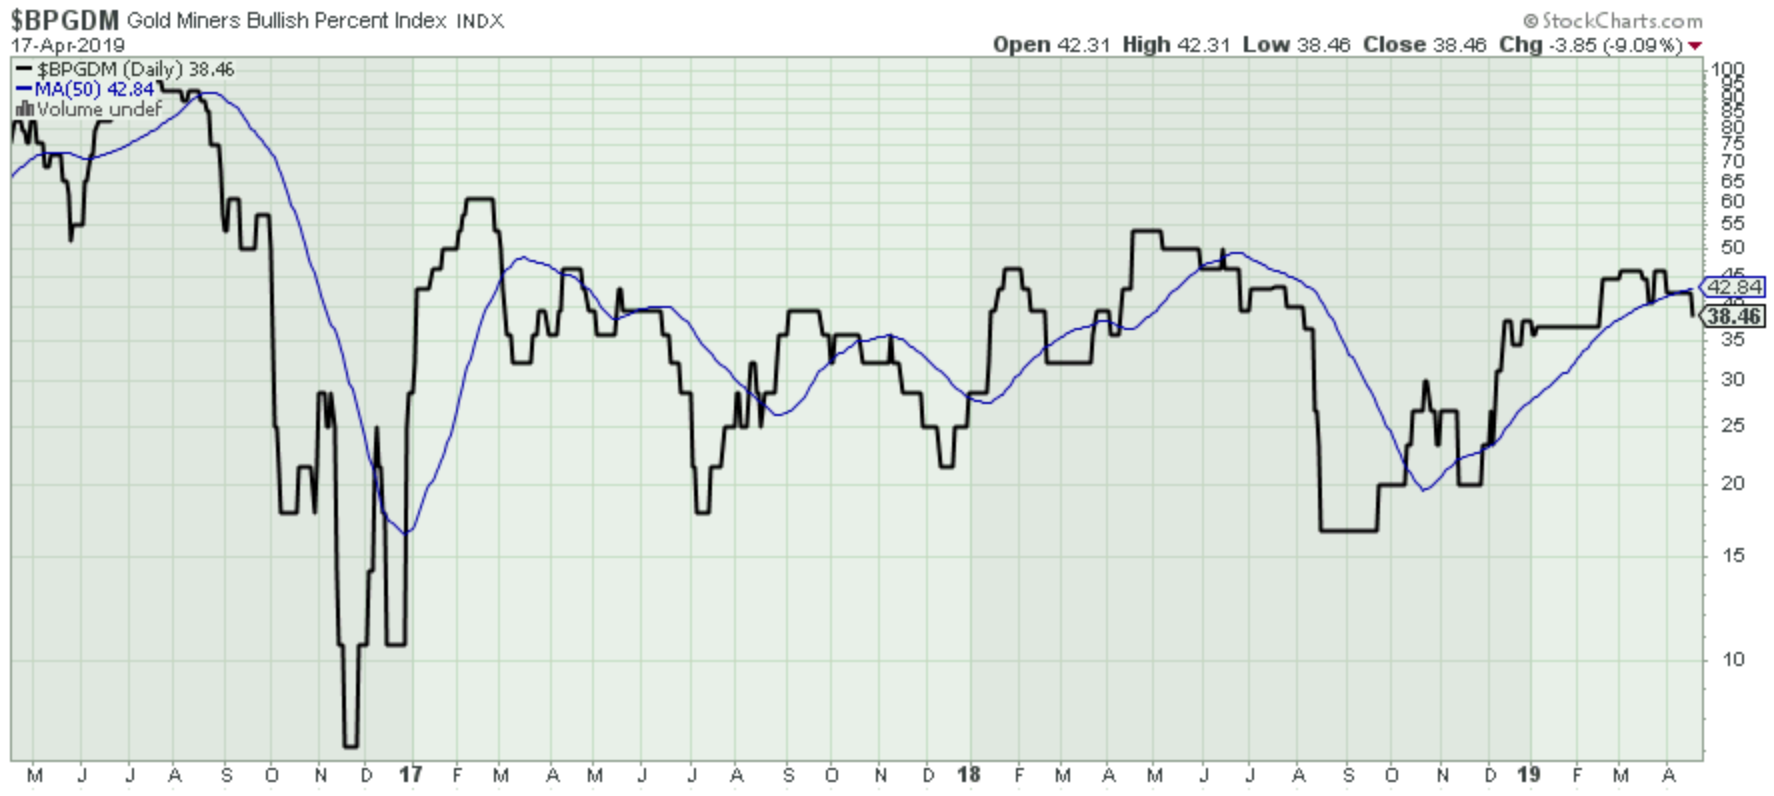
(Source: StockCharts.com)
New 52-Week Lows
In addition to weakness in the Miners Bullish Percent Index, we've got four constituents of GDXJ breaking down from multi-month consolidations to 52-week lows, and another two continuing to slide to new lows. While an argument can be made that three of these six stocks are silver miners, the fact is that they are still constituents and contribute to the performance of the index. I do not choose who gets included in the index, and it's unfortunate that the make-up of the index consists of silver miners and serial laggards. The six stocks making new 52-week lows are Hecla Mining (HL), Coeur Mining (CDE), McEwen Mining (MUX), Guyana Goldfields (OTCPK:GUYFF), Gold Standard Ventures (GSV) and Fortuna Silver (FSM). The good news for the index is that fortunately these six names only comprise 4% of the index. The bad news is that it can be a red flag when an index more than 10% off of its lows is seeing a sudden spike in new 52-week lows. I would not consider this a huge deal at this point, but attention will have to be paid to New Gold (NGD), Gold Resource Corp (GORO), Endeavour Mining (OTCQX:EDVMF) and IamGold (IAG) which are the group currently hanging out right near 52-week lows. If these four names were also to put in daily closes at 52-week lows, this would then be more than 10% of the index hitting new 52-week lows.
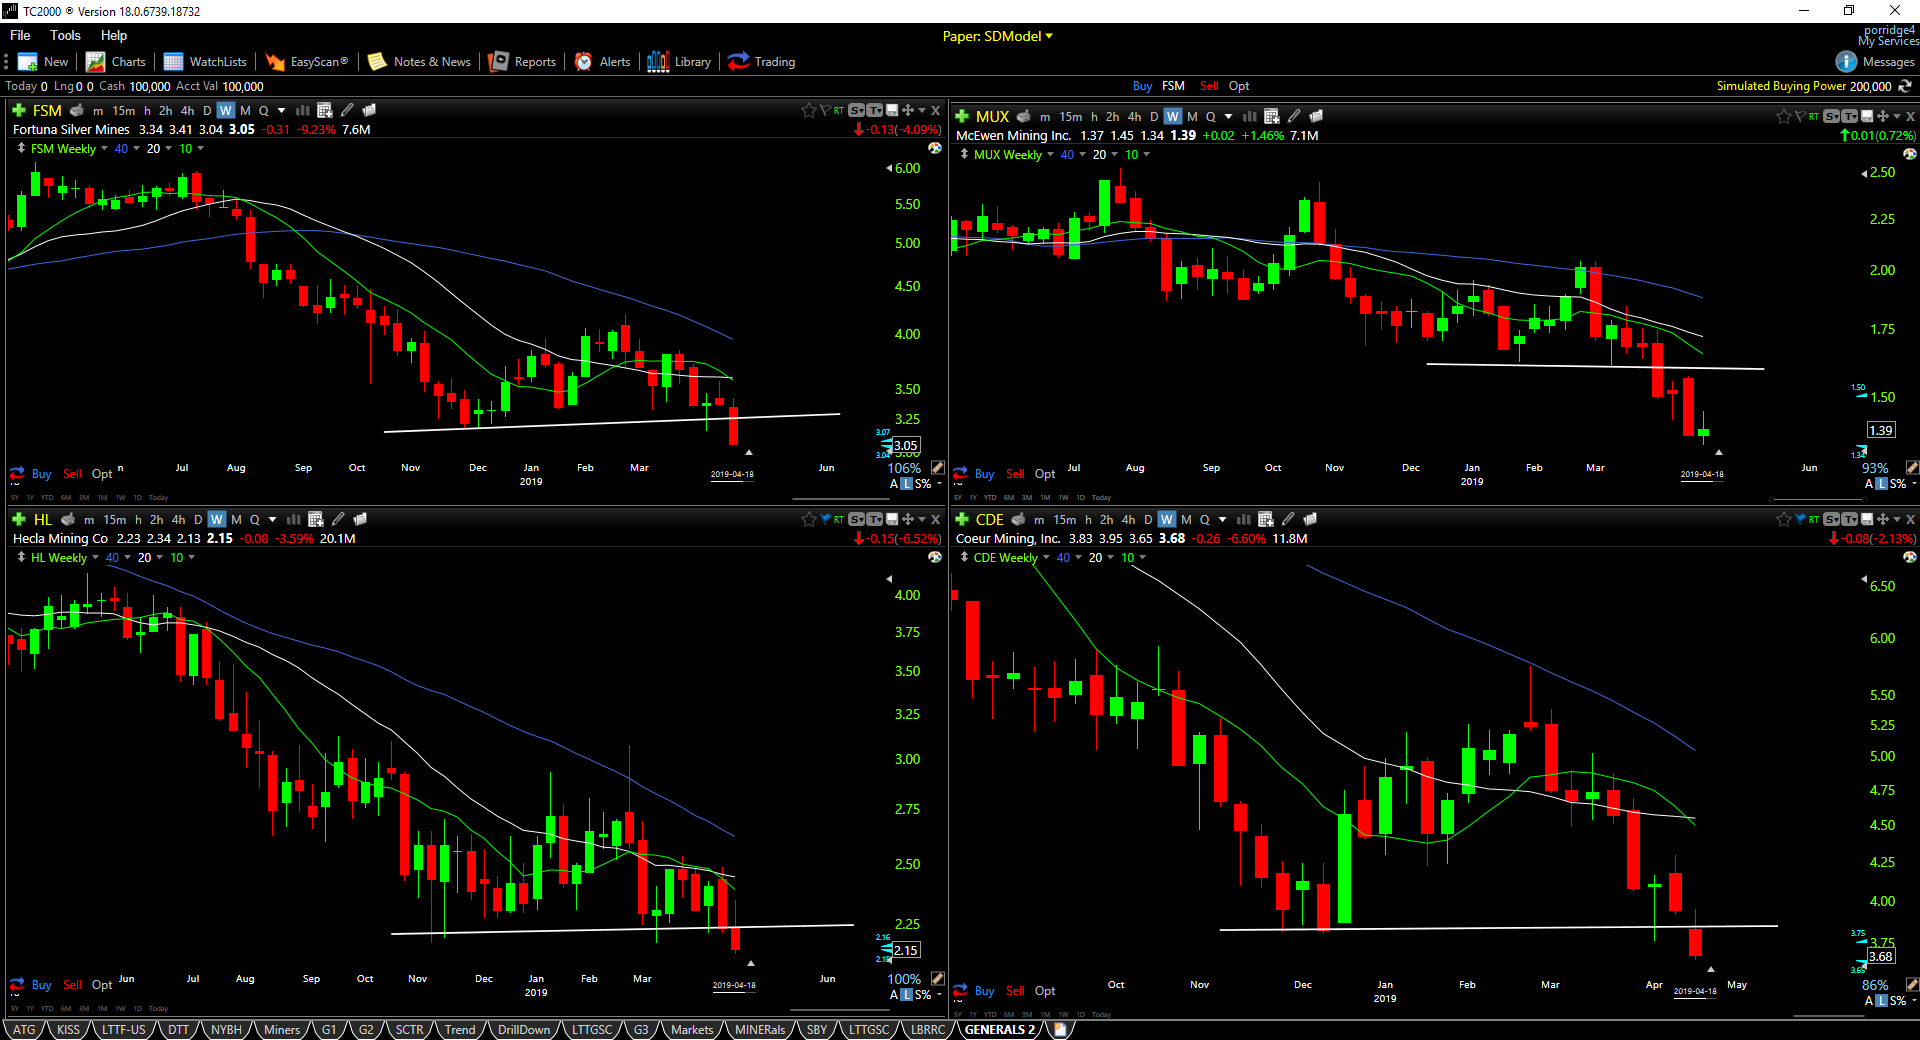
(Source: TC2000.com)
We can see some evidence of what I've discussed above in the below chart of the Gold Miners New Highs-New Lows Percent. This indicator was trending up and making higher lows in November through December and then managed to spend nearly three months above the zero line, which was a positive sign. Since February however, this indicator is now making lower lows and lower highs and hanging out below the zero line.
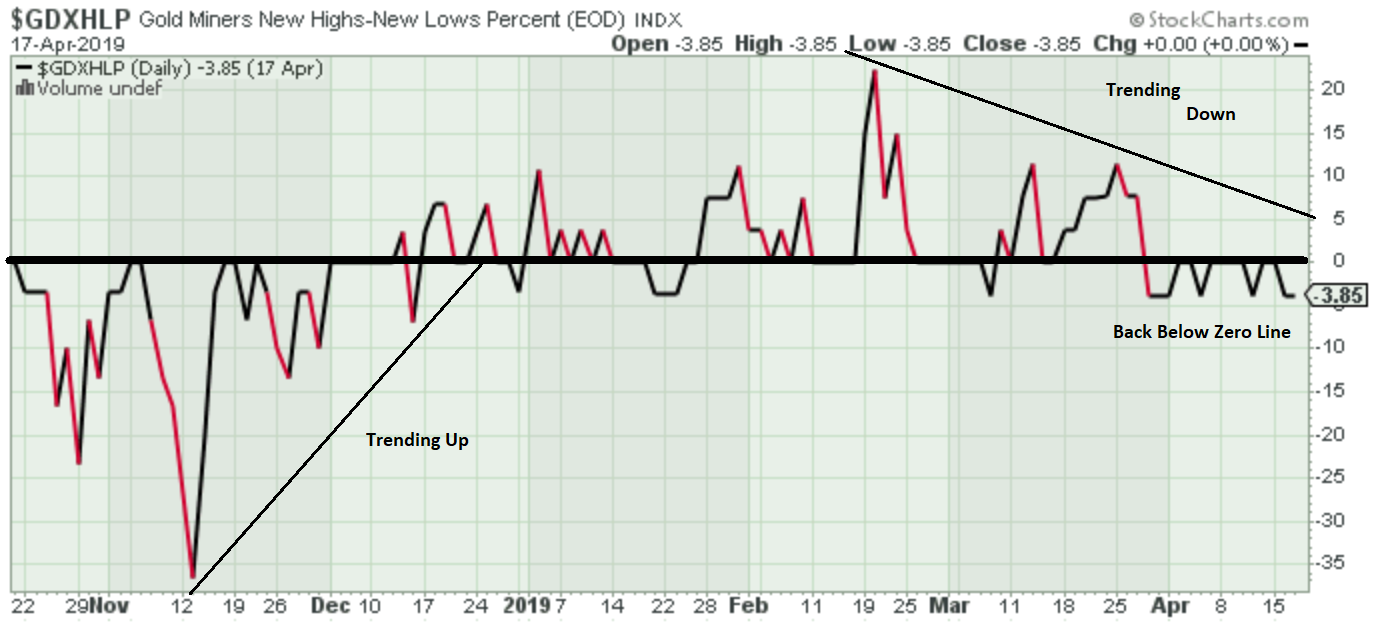
(Source: StockCharts.com)
Breadth
Finally, moving on to a breadth standpoint, we also see a change of character here. The below chart I've built is data I follow daily which tells me how many miners of a diversified basket I've chosen are closing above their 50-day moving averages. The index is comprised of over 40 of the most liquid miners and is, therefore, a very reasonable sample size. As we can see in the below chart, the percent of miners above their 50-day moving averages has continued to slide since February. The strongest sectors in the market rarely spend more than a few consecutive days below the 50% level, and we were seeing immediate bounce backs from below this level (green line) in March and early April. Over the past two weeks, however, we've seen the index continue lower to a current reading of roughly 10% of miners above this key moving average. Whether we like it or not, this is an evident deterioration in breadth and at the minimum an adverse change of character. This does not mean we can't resolve this, and it's certainly possible to see some mean reversion, but I will be watching the 50% level above going forward to see if it becomes new resistance.
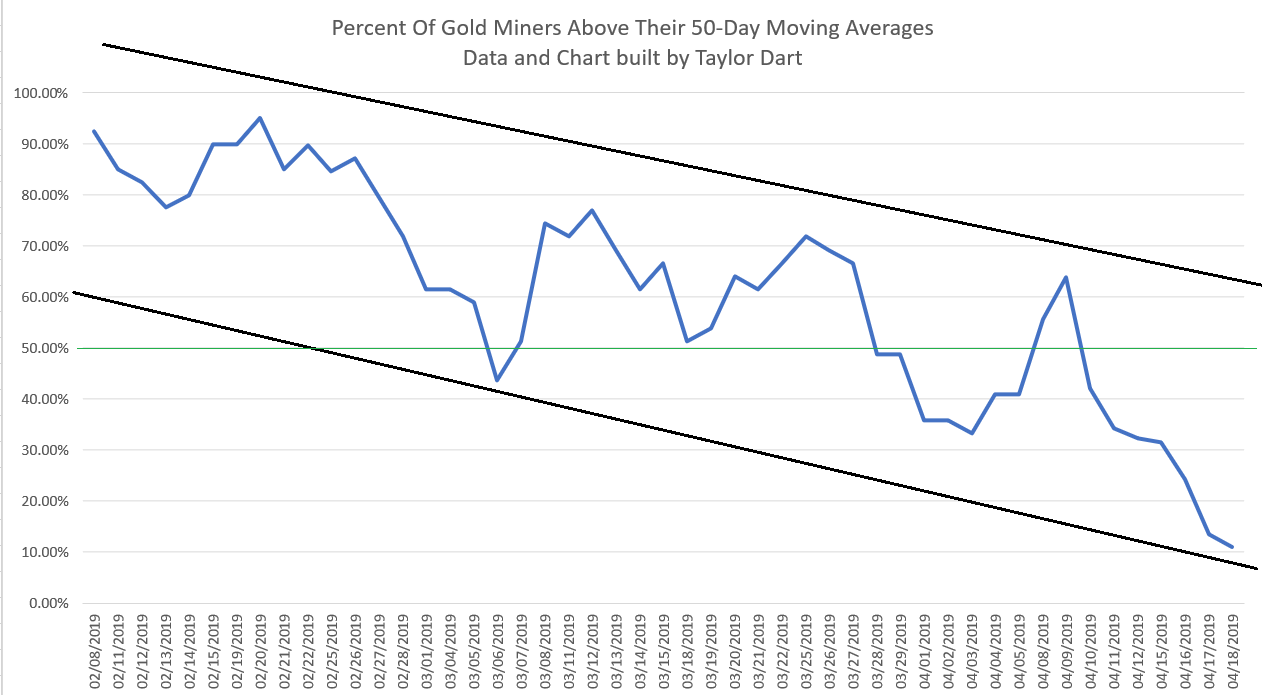
(Source: Microsoft Excel, Author's Data/Chart)
Based on a spike higher in new 52-week lows, deteriorating breadth and weakness in the Miners Bullish Percent Index, this weakness in price is being confirmed by weak internals. This is not an ideal development for the bulls, and they're going to need to start playing offense immediately to rectify this.
Technicals
So how do the charts look currently?
As we can see from the monthly chart of the Gold Juniors Index, the index continues to struggle to show any commitment to its 20-month moving average. The index closed back above this level in January, February, and March, but now has found itself back below it as we head into the back half of April. The index will need to finish the month above $31.25 to reclaim this level. This would require a nearly 6% rally in the final seven trading days of the month. While I wouldn't rule this out, it certainly won't be an easy feat for the bulls.
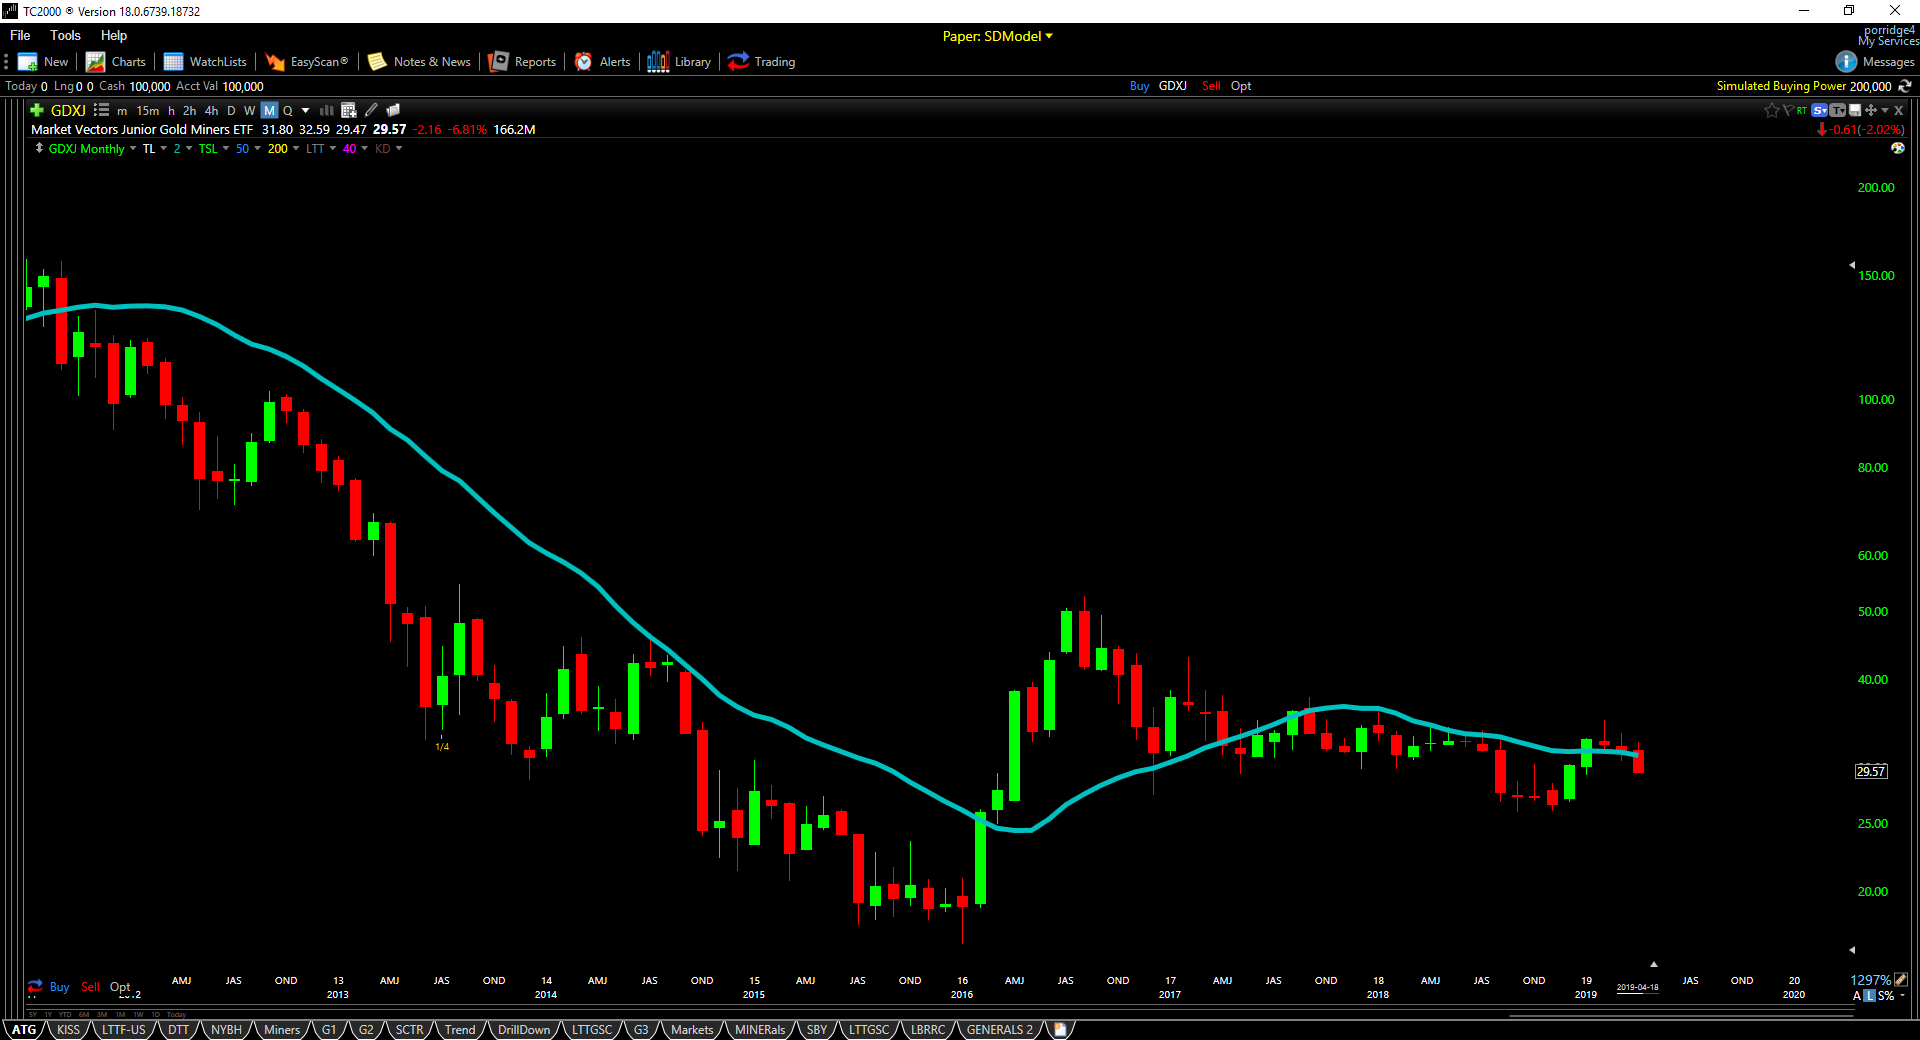
(Source: TC2000.com)
Zooming into a daily chart of the index below, the Gold Juniors have now slipped below their 200-day moving average (yellow line) and found no support there on Thursday. While I would not put too much weight on a single day spent below this level, it is not encouraging that not even an ounce of support showed up here. The 50-day moving average for the index (blue line) has also rolled over, and it's possible that level puts a lid on the index if it does rally back over the next couple of weeks.
As we can see from the below chart, strong support sits at $26.80, with strong resistance at $35.20, but we now have a new short-term resistance built present at $31.55. I would consider any rallies that cannot get above $31.55 on a Friday closing basis to be noise, and it's possible they will just be oversold bounces until this chart cleans itself up.
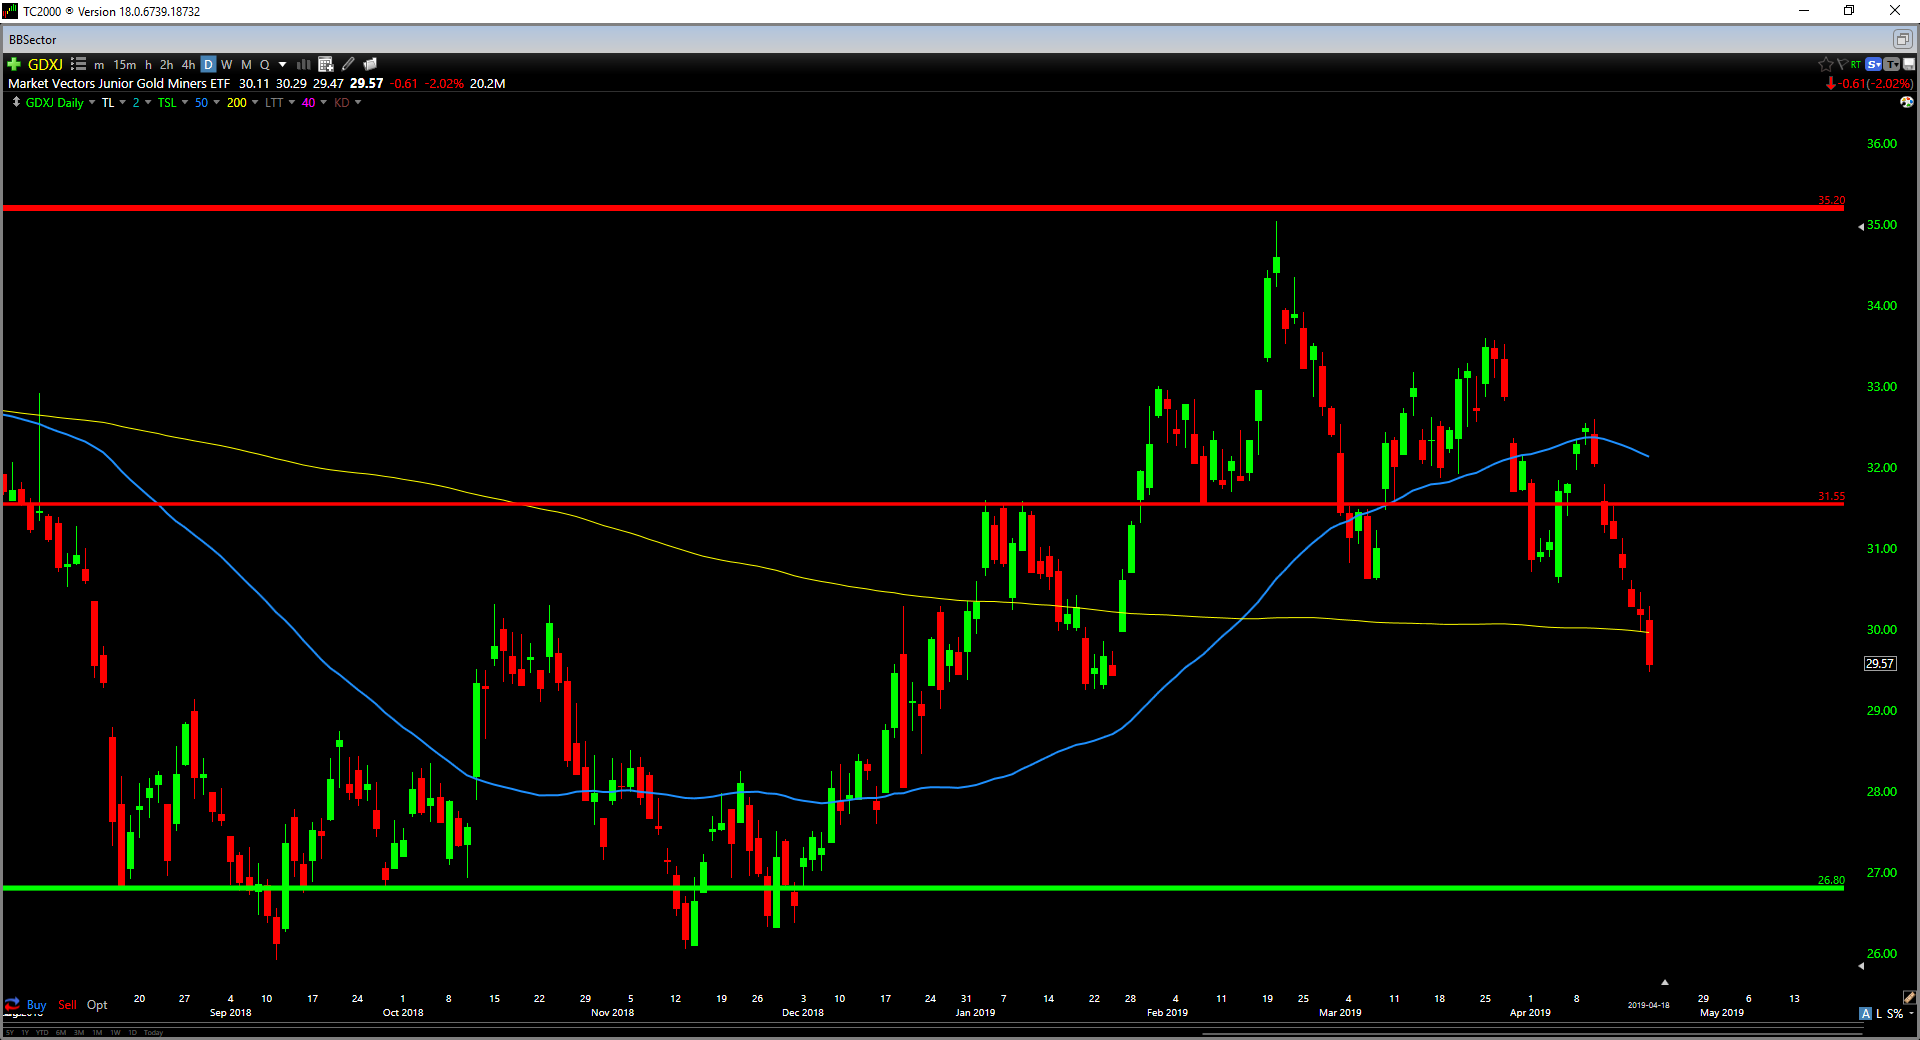
(Source: TC2000.com)
So how am I positioned?
For those that have followed me for a while, I generally do not trade the indexes as they hold far too many laggards, and I am not elated with the way the indexes are constructed holdings wise. Even if Guyana Goldfields, New Gold and Eldorado Gold (EGO) only make up 5% of an index, I don't want their poor performance to weigh on my return. For this reason, I watch about 60 individual miners and occasionally take positions in the ones that are the strongest both fundamentally and technically. Up until recently my favorite name in the sector was Kirkland Lake Gold (KL), but Atlantic Gold (OTCPK:SPVEF) has taken its spot recently as my favorite given its attractive valuation and powerful technical breakout. The stock has broken out of a 20-year base to a new monthly closing high as of the end of March and had the lowest all-in sustaining cash costs of any miner last year, and is second only to Kirkland Lake Gold. The company expects to produce just below 100,000 ounces of gold for FY-2019 at all-in sustaining cash costs below $560/oz. While the company certainly pales in terms of scale to Kirkland Lake Gold, it comes at a very reasonable valuation of only $415 million US.
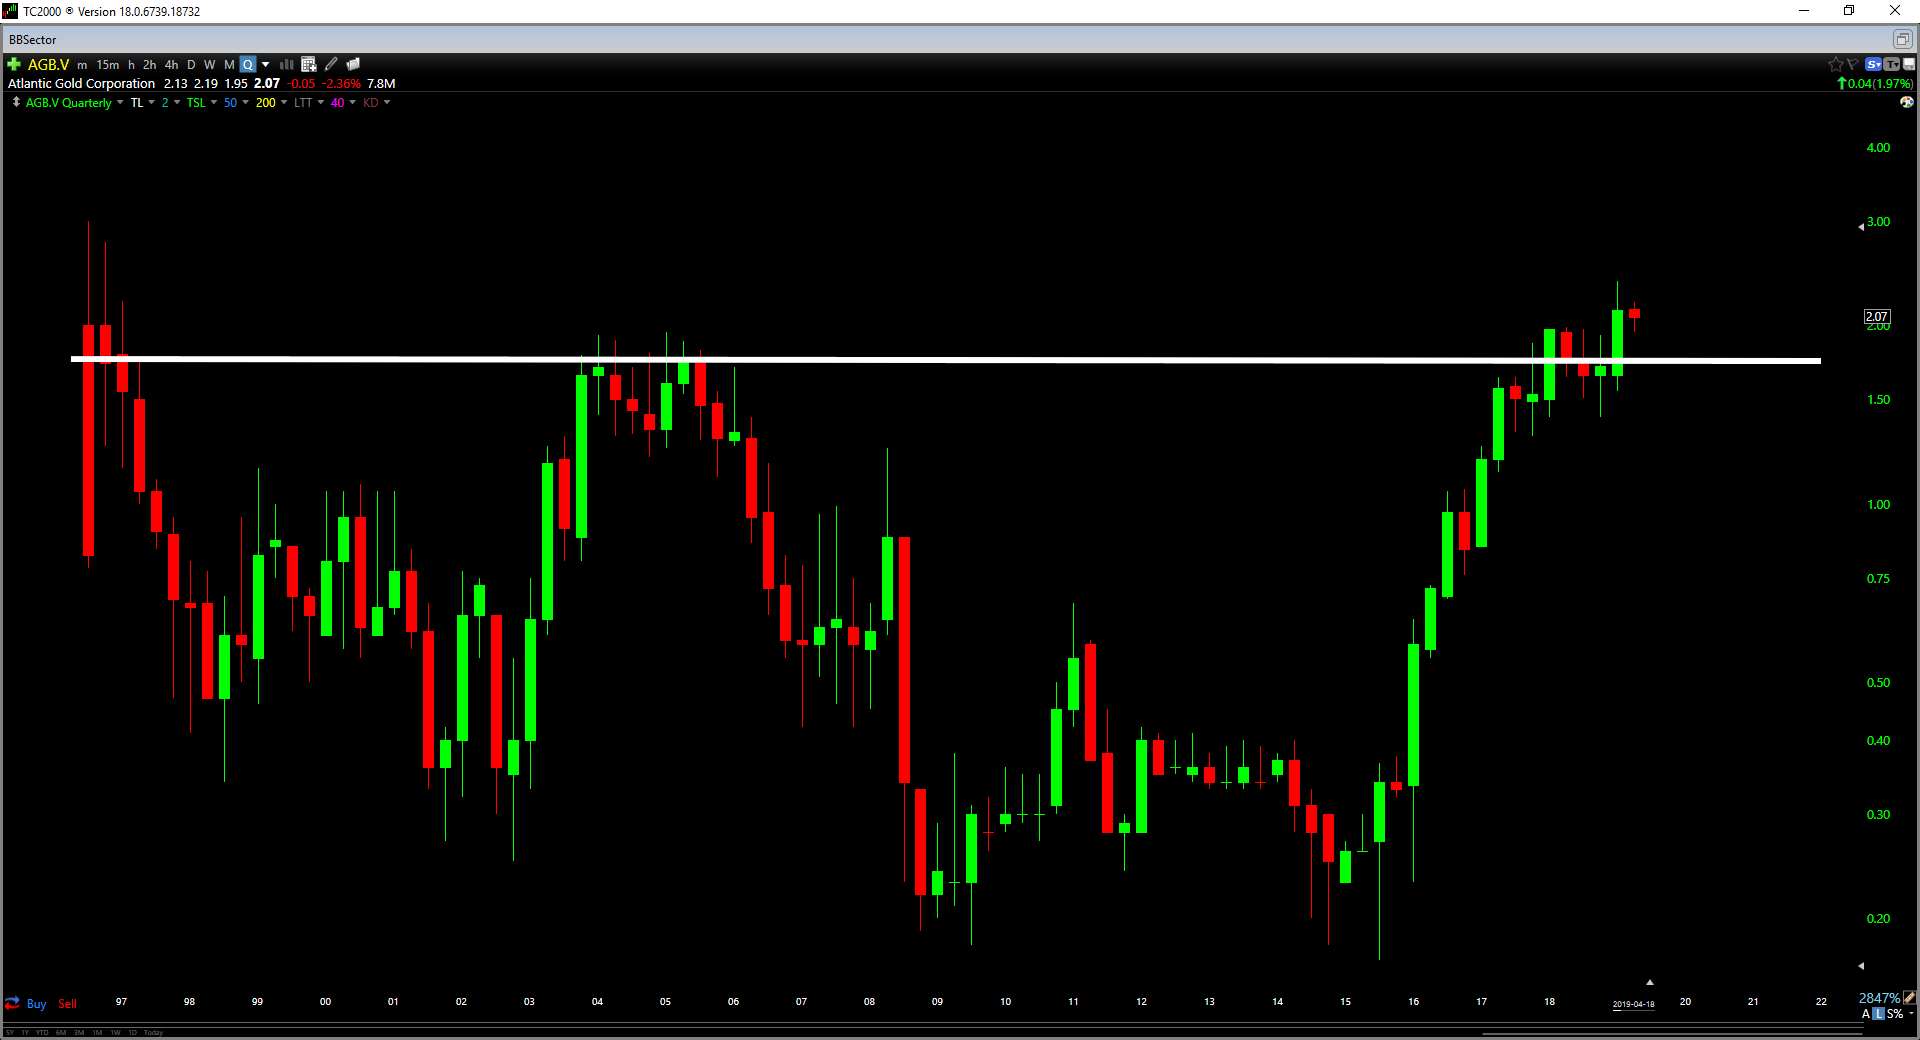
(Source: TC2000.com)
For full disclosure, I am long the stock only on the Canadian Market at C$2.04. As long as the stock holds above C$1.89, I plan to stay with my position. My goal with individual miners is to find strong risk/reward propositions where my risk is limited at 5-7% on the position or roughly 0.20% of my portfolio, but with significant upside, if I am correct. A 20-year breakout in a stock is what I would consider being an opportunity for considerable upside.

(Source: Shutterstock.com, Author's Photo)
To summarize, I continue to remain underweight gold juniors as a group and only hold one miner currently in my portfolio. The bulls are going to need to play some offense over the next couple weeks as the current weight of evidence suggests that the bears are beginning to tilt the scales in their favor again after a few month hiatus. It is entirely possible that the index could bounce here as it's hitting oversold levels, but the key will be if it can reclaim $31.55 on a weekly close. Rallies that cannot reclaim $31.55 GDXJ on a weekly close may end up just being oversold bounces. While the bulls may be sleeping at the wheel, they're heading into incoming traffic but haven't crashed just yet. It would be ideal for the medium-term picture if they woke up from their snooze as soon as possible.
Disclosure: I am/we are long AGB.V. I wrote this article myself, and it expresses my own opinions. I am not receiving compensation for it (other than from Seeking Alpha). I have no business relationship with any company whose stock is mentioned in this article.
Additional disclosure: I am only long Atlantic Gold on the Canadian Market. The reason for this is because I do not care for the wide bid/ask spreads and minimal liquidity on the OTC Market.
Follow Taylor Dart and get email alerts