Gold Looks Set To Challenge Critical Technical Levels On The Upside - FNV Could Continue To Outperform On The Upside
A steady rally since mid-August 2018.
The Fed gives gold the green light.
A stable dollar is supportive of gains.
Two levels to watch on the upside.
Franco-Nevada Corporation and the royalty model.
Gold has been shining in 2019, and there are signs that the precious metal will continue its lustrous price activity over the coming weeks and months. Both fundamental and technical factors are supportive of futures gains in the yellow metal which was trading at the $1316 per ounce level on the nearby April COMEX futures contract on March 26.
There are many choices when it comes to participating in a bullish trend in gold for market participants. The most direct route is to purchase the yellow metal in the form of bars or coins. For me, holding physical gold is a unique experience when it comes to investing as its density and shine provide a feeling that no other asset other than real estate connects the owner to the asset. Futures and futures options in gold are favorites of many market participants as the derivatives provide leverage and exposure to the price of the yellow metal. Gold mining stocks can also be a sexy investment or trading vehicles as their performance is a function of the price path of gold. However, the equities involve an additional level of risk when it comes to specific producing properties and management of the corporate entities. To compensate for the risk, gold mining shares tend to offer investors and traders a more attractive percentage return during bull market periods in the gold market. Anyone who suffered losses in the Bre-X gold mining scandal in the late 1990s is likely still wary of gold mining shares. However, companies like Franco-Nevada Corporation (FNV) that are royalty stream gold companies offer exposure to gold and gold mining companies via diversification and extremely low overhead costs. If gold is heading for new highs in 2019, FNV could be a massive winner in the coming months.
A steady rally since mid-August 2018
Gold looked awful last August as the dollar index rose to a new high, the markets were concerned about rising US interest rates, and the trade dispute between the US and China was causing many commodities prices to experience pressure. 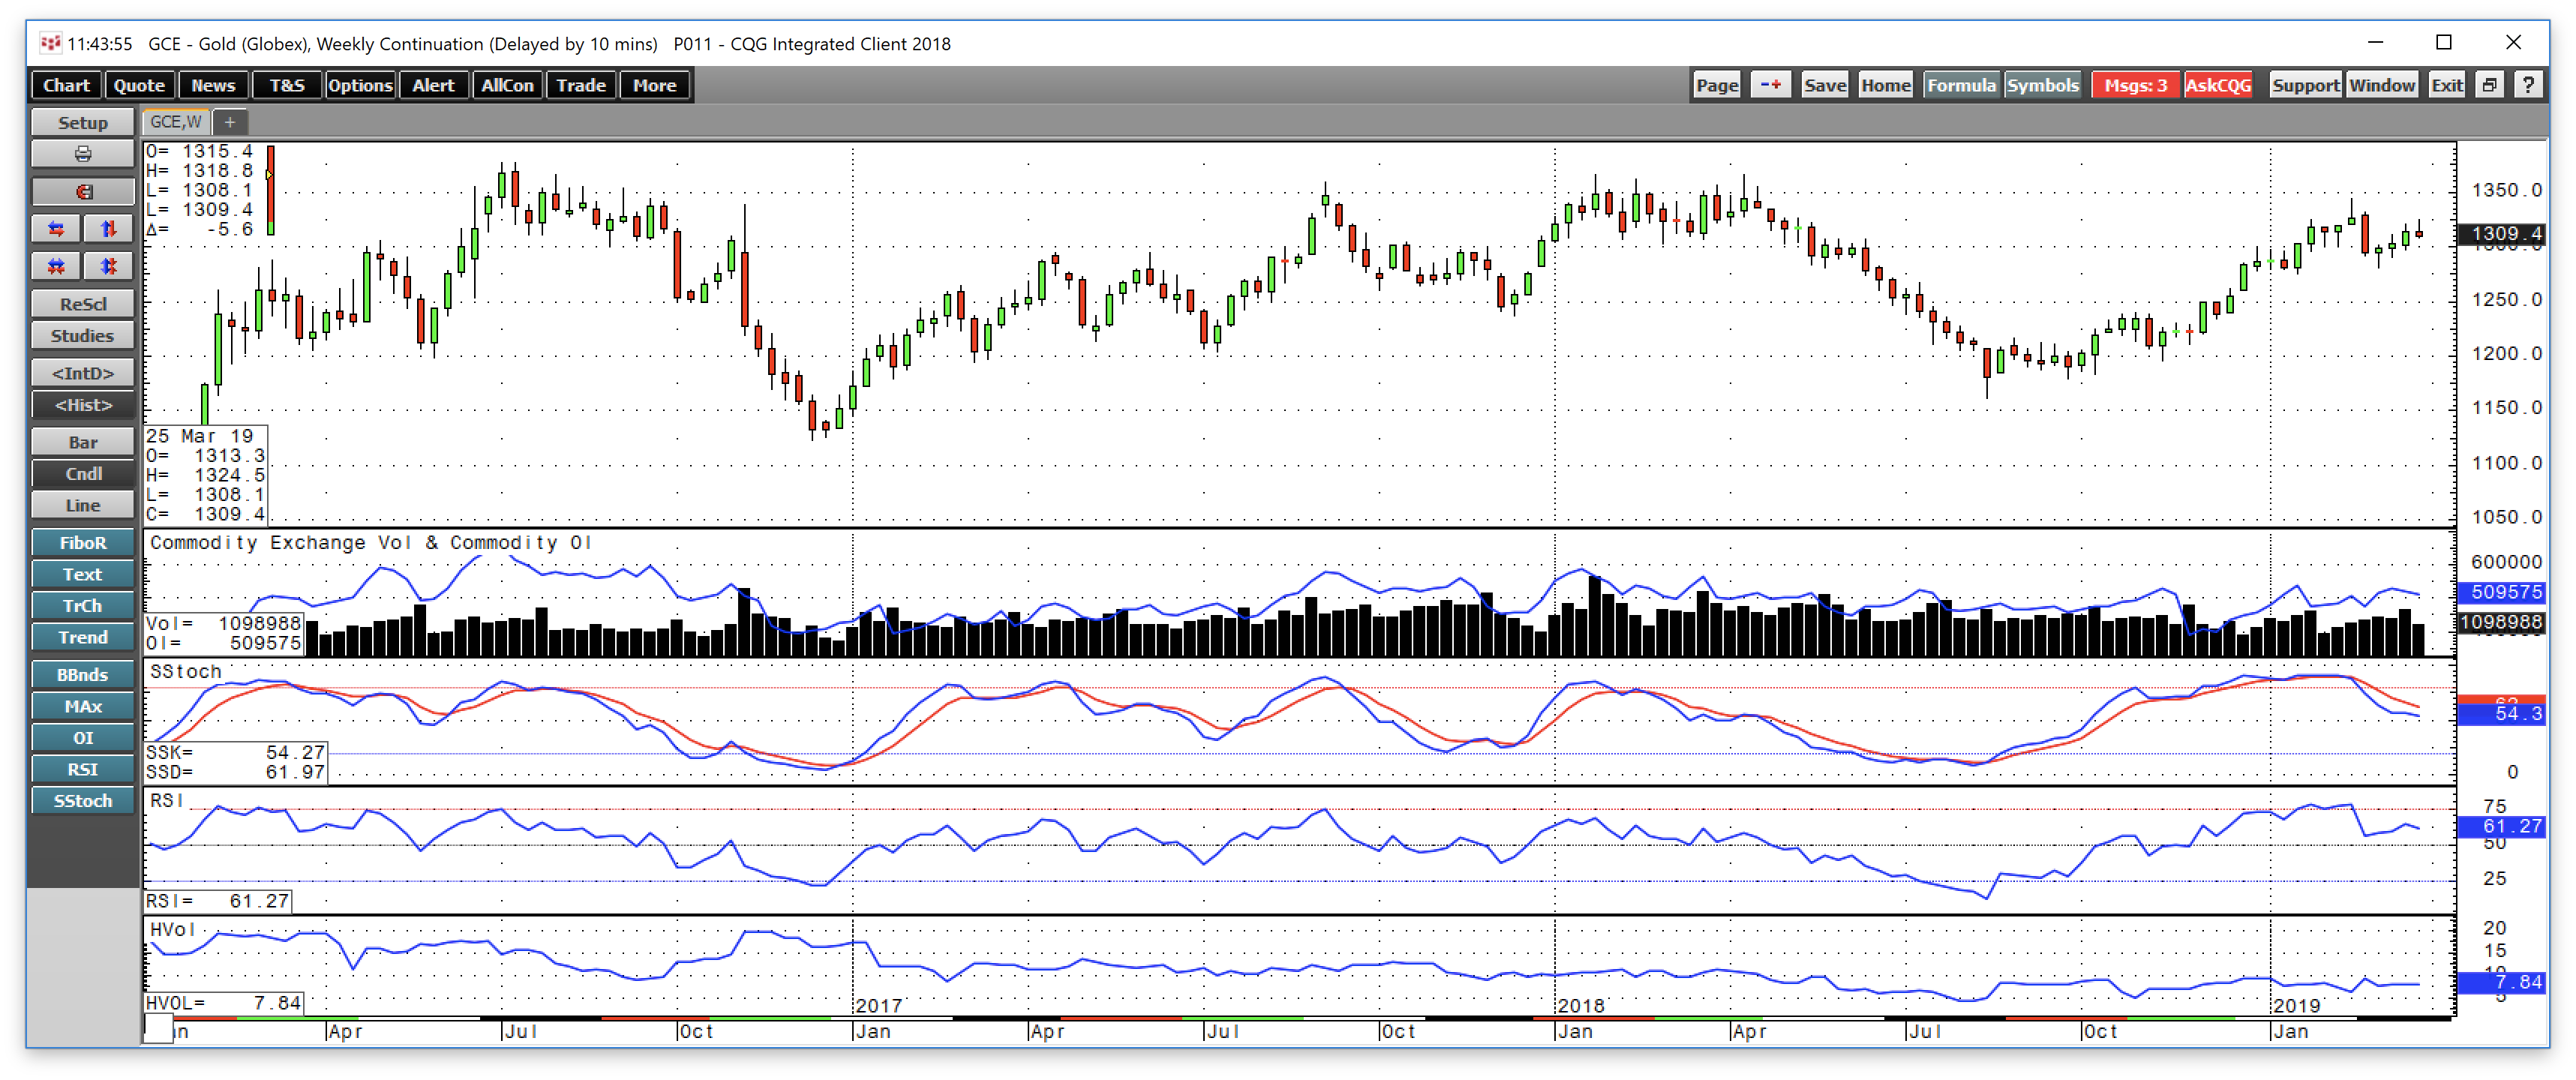
Source: CQG
As the weekly chart highlights, the price of the yellow metal fell to a low at $1161.40 per ounce during the week of August 13 which was the low for 2018 and the lowest level since early January 2017.
Meanwhile, the precious metal found a bottom last August, and after trading around the $1200 level until early October, the price began to rise reaching a high at $1344 on the continuous contract in mid-February. After probing below the $1300 level in early March, gold moved back above the mark. Price momentum had been falling after the correction from the $1344 level but is leveling off in neutral territory. Relative strength is in the upper region of neutral territory and daily historical volatility at 7.79% is around the norm for gold which is a hybrid between a commodity and a currency. Gold was trading at just over the $1310 level on March 27.
The Fed gives gold the green light
Last week, on March 20, the US Federal Reserve handed the markets a surprise when they went further than almost all analysts excepted when it came to their plans for monetary policy. The Fed had guided that the short-term Fed Funds rate would rise by 25 basis point twice in 2019 and twice in 2020 after four rate hikes at that level in 2018. However, the Fed canceled all rate hikes for 2019 and told markets to only expect one 25 basis point increase in the Fed Funds rate in 2020. At the same time, the central bank told markets that their rote program of balance sheet normalization would end in September which will take the upward pressure off interest rates further out along the yield curve in the US. The move by the Fed is likely to put some pressure on the US dollar against other world currencies or at least prevent it from significant upside appreciation.
While the signals last summer weighed on the price of gold which tends to move inversely to rising interest rates and a strong dollar, the latest direction from the Federal Reserve is likely to support gains in the precious metal over the coming weeks and months.
A stable dollar is supportive of gains
In a sign of strength following the mid-August low in the gold market, the dollar rose to a higher high over the months that followed, but gold did not fall to a lower low. The dollar index rose to a high at 96.865 in mid-August which sent gold to a low at $1161.40 per ounce. The dollar index then made a higher high at 97.705 in mid-December last year, and gold only made to it a low at $1234.10 during the week the dollar rose to a new peak.
In 2019, the dollar index has traded in a narrow range from 94.635 to 97.665 while gold's trading band has been from $1275.30 to $1344 so far this year. With the first quarter ending this Friday, the dollar has settled into a range, and at 96.395 on March 27 the index was just above the midpoint. Meanwhile, gold at the $1310 level was also in the middle of its trading band.
The odds favor a stable to lower dollar in the aftermath of the latest Fed meeting. Based on the price action in the gold market since last summer, the prospects for the dollar are likely to support the price of gold over the coming days and weeks.
Two levels to watch on the upside
Gold moved to a high at $1344 on the continuous futures contract and $1349.80 on the active month April futures contract on February 20 before the latest mild corrective move to the downside. 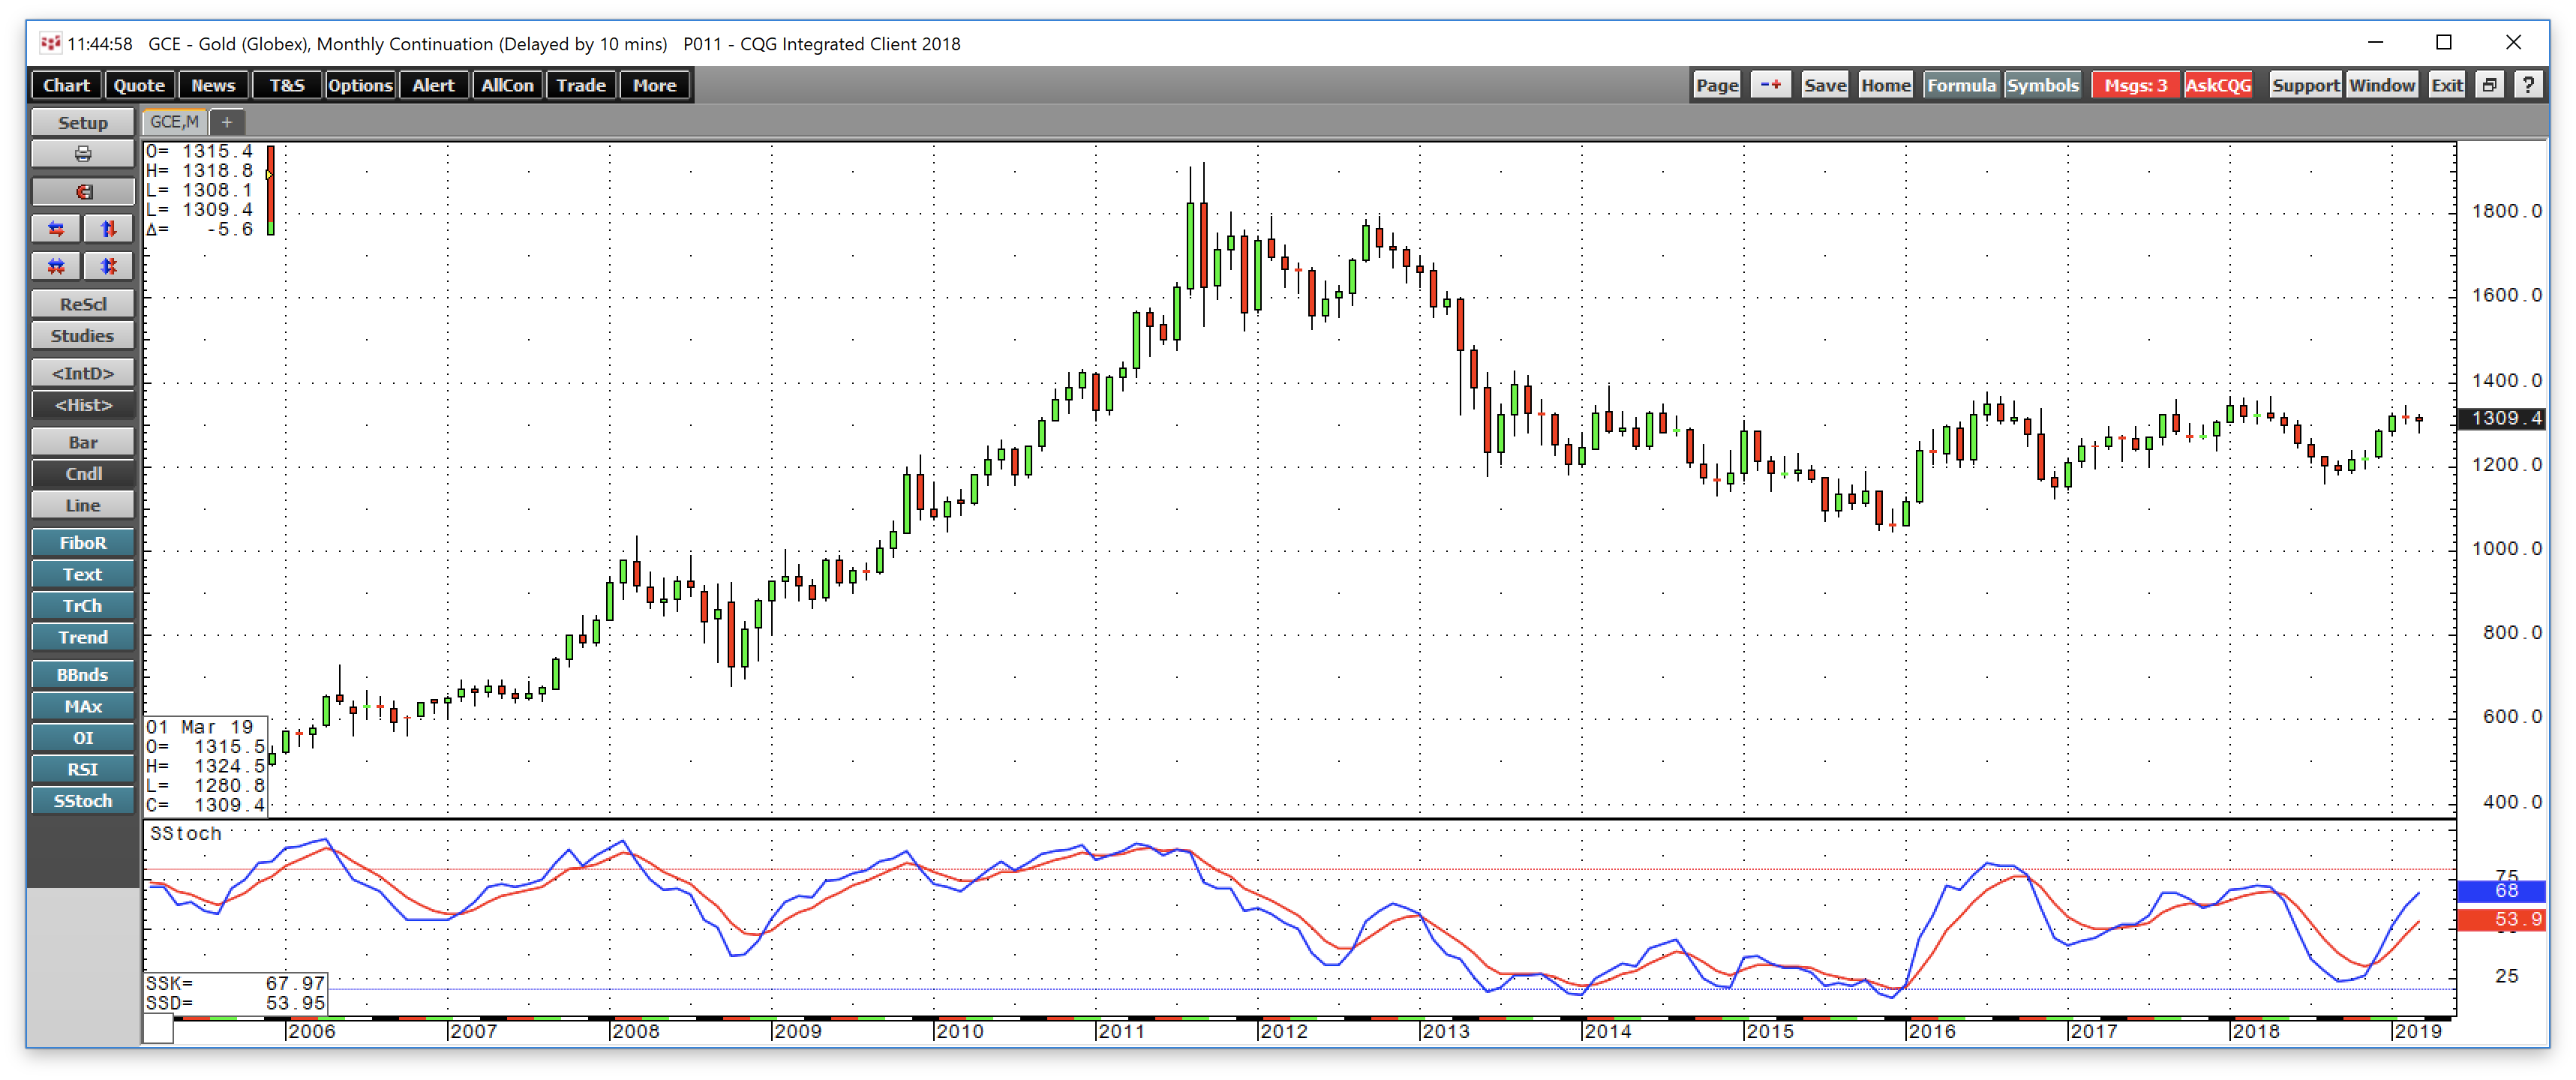
Source: CQG
As the monthly chart shows, two levels of resistance stand as upside hurdles in the gold market above the most recent high. In 2018, gold made a double top at a level that turned out to be the high for the year. In January and April last year, the price of gold rose to a high at $1365.40 per ounce which is the first level of resistance and the gateway to a price that has become a line in the sand for gold on the upside.
In July 2016, during the aftermath of the shock of the Brexit referendum, gold reached its highest level since 2014 at $1377.50 which is the critical technical resistance level and target for the gold market. Above that level, gold could attract lots of technical buying as the move would qualify as a bullish breakout.
From the mid-August low to the mi-February high, gold rose from $1161.40 to $1344 or 15.7%. Most gold mining equities waited until September to hit their lows, and since then one company has outperformed the price action in the gold market by a better than two to one margin on a percentage basis.
Franco-Nevada Corporation and the royalty model
Franco-Nevada Corporation is a $14.348 billion gold mining company that pays a 1.24% dividend at its current share price and has only thirty employees which keep overhead at a minimal level. The company's profile states:
Franco-Nevada Corporation operates as a gold-focused royalty and stream company in the United States, Canada, Mexico, Peru, Chile, Australia, and Africa. The company also holds interests in silver, platinum group metals, oil and gas, and other resource assets. As of December 31, 2017, it had a portfolio of 341 assets. The company was incorporated in 2007 and is headquartered in Toronto, Canada.
The royalty stream model has created substantial returns above those offered by the gold market for holders of FNV shares since the lows in 2019. While gold rallied by 15.7% from the 2018 low to the 2019 high, FNV did much better. 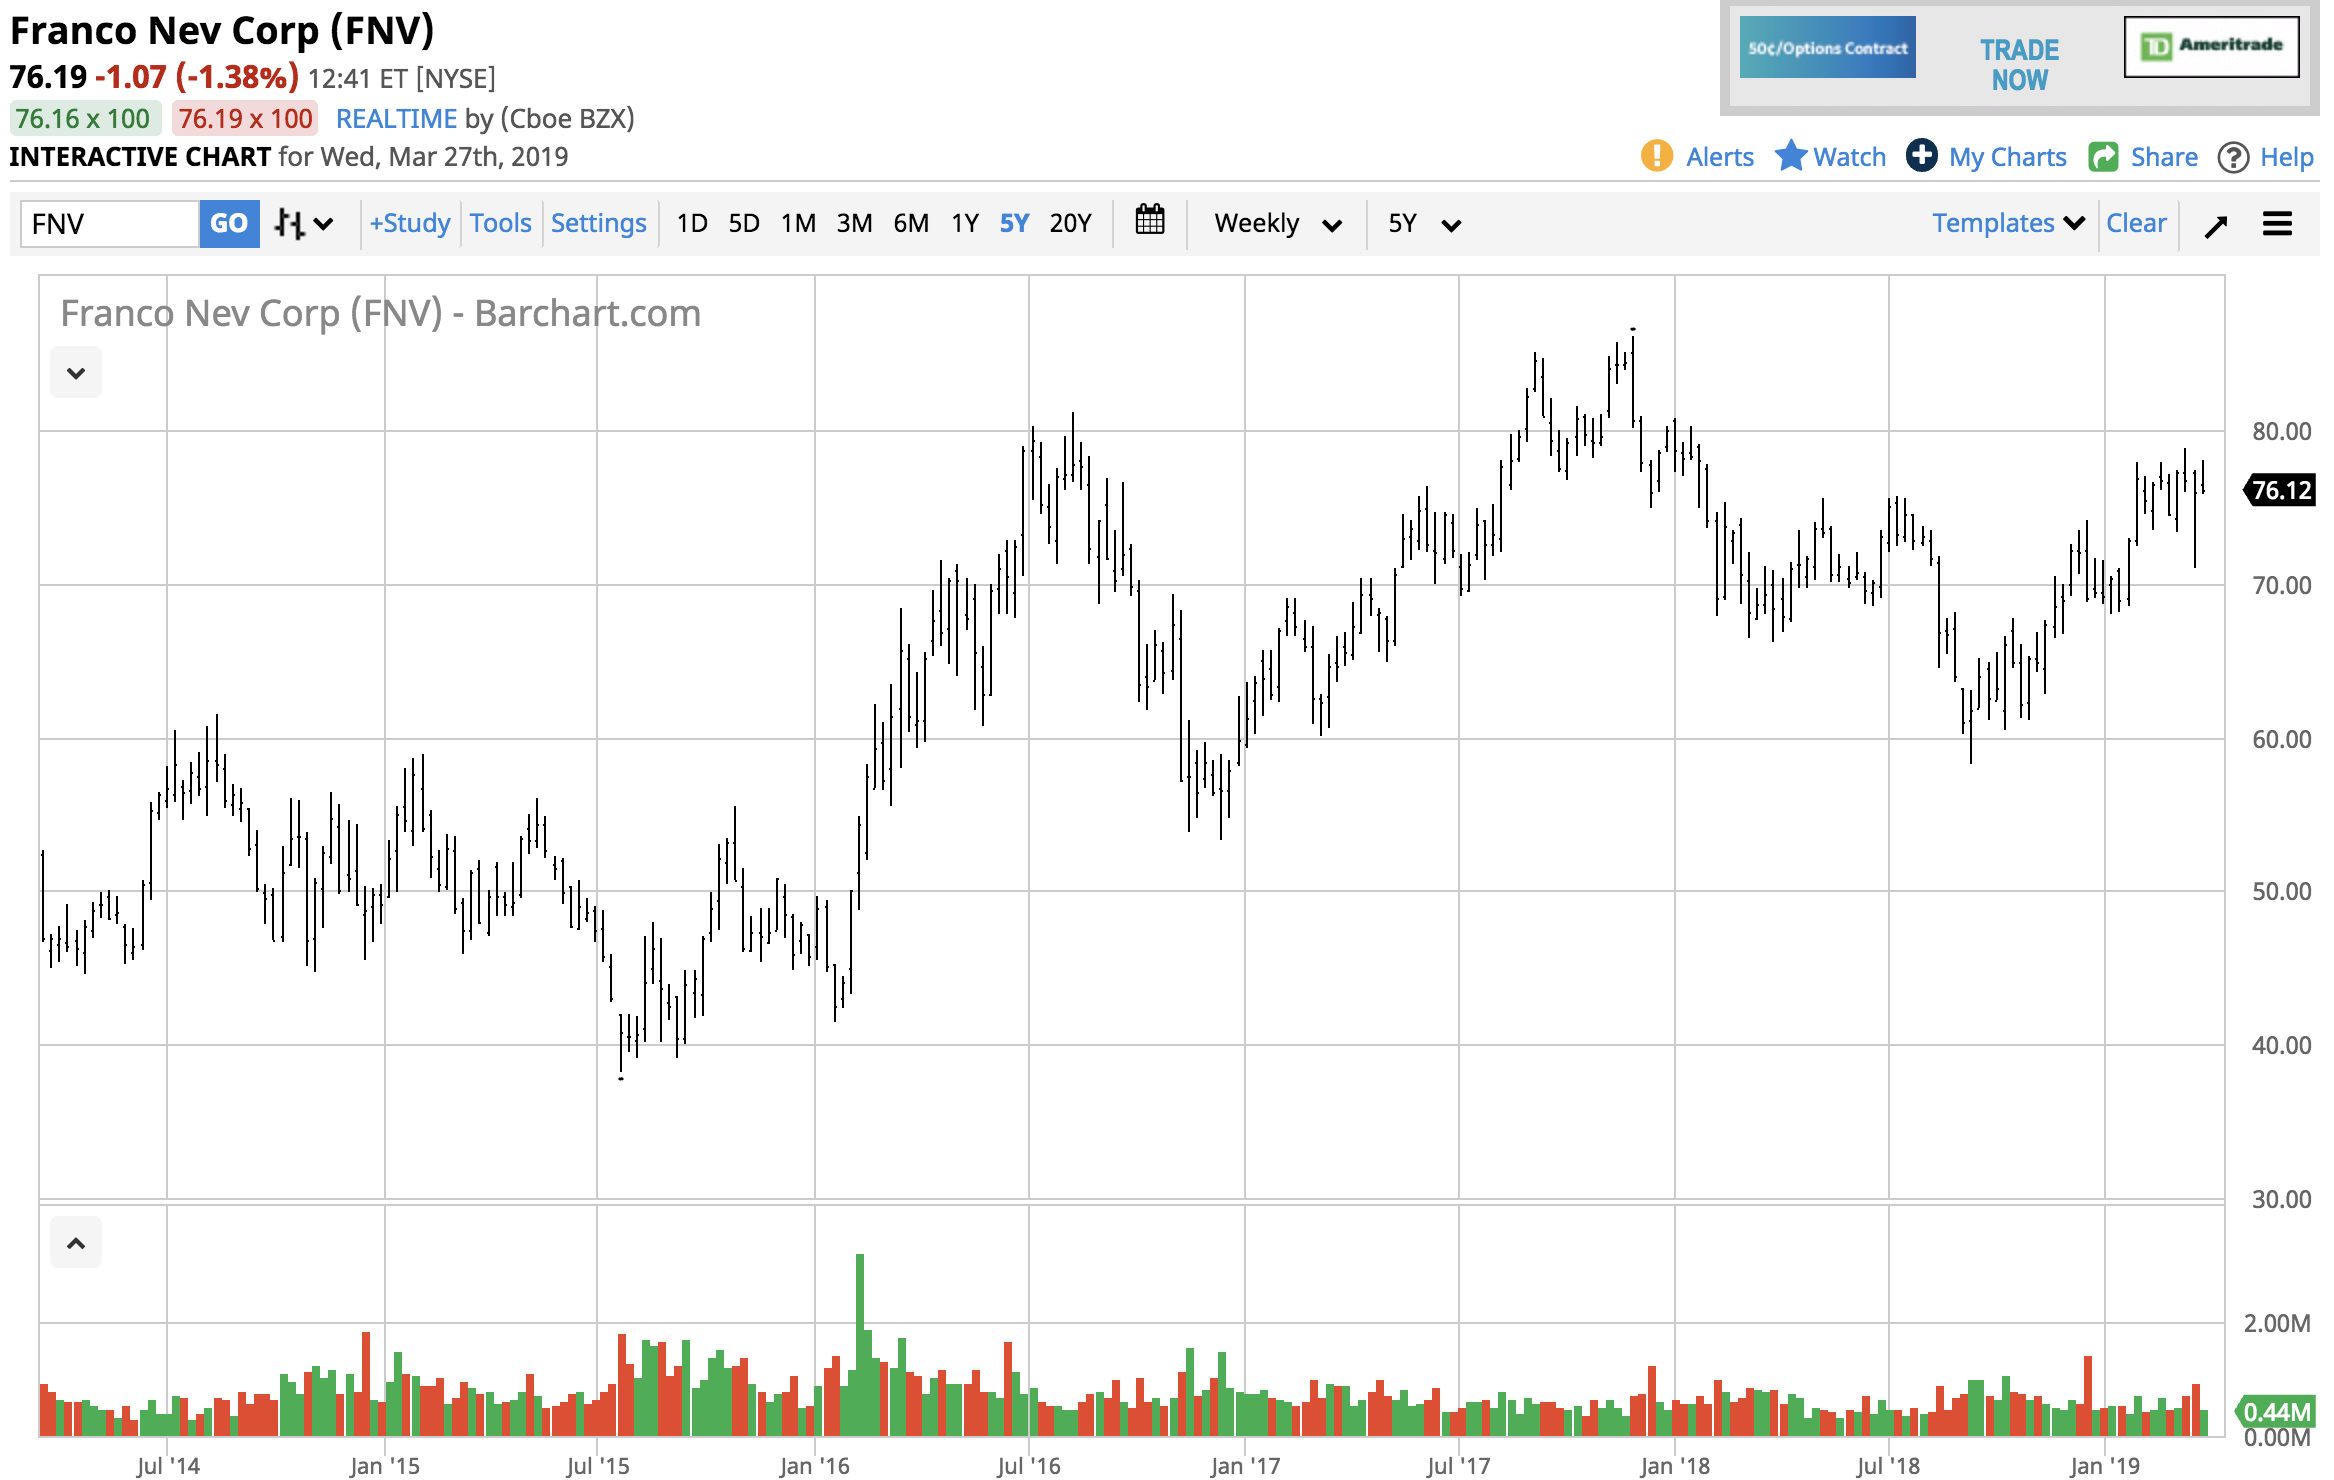
Source: Barchart
As the chart shows, FNV shares surged from $58.26 which was the 2018 low to $78.82, the 2019 high so far this year which is a rise of 35.3% which is more the double the percentage move in the gold market.
If gold is preparing to challenge the 2018 and 2016 highs later this year, the prospects for FNV shares is looking more than precious. Each dollar gold moves on the upside add earnings to this company that sits back and collects royalties based on the price of the yellow metal without rising corporate costs weighing on the return for shareholders.
Gold looks set to move above the $1400 per ounce level or higher at some point this year. Buying FNV shares on any price weakness could result in a leveraged return compared to the yellow metal.
The Hecht Commodity Report is one of the most comprehensive commodities reports available today from the #2 ranked author in both commodities and precious metals. My weekly report covers the market movements of 20 different commodities and provides bullish, bearish and neutral calls; directional trading recommendations, and actionable ideas for traders. I just reworked the report to make it very actionable!
Disclosure: I/we have no positions in any stocks mentioned, and no plans to initiate any positions within the next 72 hours. I wrote this article myself, and it expresses my own opinions. I am not receiving compensation for it (other than from Seeking Alpha). I have no business relationship with any company whose stock is mentioned in this article.
Additional disclosure: The author always has positions in commodities markets in futures, options, ETF/ETN products, and commodity equities. These long and short positions tend to change on an intraday basis.
Follow Andrew Hecht and get email alerts