Gold: Lose a Battle to Win the War / Commodities / Gold and Silver 2021

Gold scored some victories over thepast days, but it’s playing a risky game. One misstep and the yellow metalmight lose the war.
Sometimes, a good strategist needs togive up a few battles to eventually win the war. Or, at least, convince theirenemy that they’re defeated while preparing a counterattack. Just the same, achess player may need to sacrifice a piece in order to checkmate a king. SunTzu has spoken, and the Art of War translates well here.
In the world of trading, the same rulesoften apply. A good investor needs to give up a few unfavorable days toeventually score a final victory. Again, controlling one’s emotions and adheringto patience are key. These principles are important when waiting out gold’stemporary upswings in a medium-term downswing, and also when waiting for gold’seventual ascent. Don’t let short-term intraday moves cloud your vision.
Yesterday (May 11), I wrote that therally in gold and stocks might have just burnt itself out, and the marketsdidn’t wait long to agree with me.
Is it 100% certain that the top is in?Absolutely not, as there are no certainties in any market, and sound positionmanagement should be utilized at all times. But based on what happenedyesterday, and what we saw in today’s pre-market trading, the odds that thecorrective top is already in have greatly increased.
Let’s take a look at the charts fordetails, starting with the stock market .
TheInfluence of the Stock Market
The markets are self-similar (which isanother way of saying that they have a fractal nature), which generally meansthat while the history tends to rhyme, it also tends to rhyme in similar shapesof alike or various sizes.
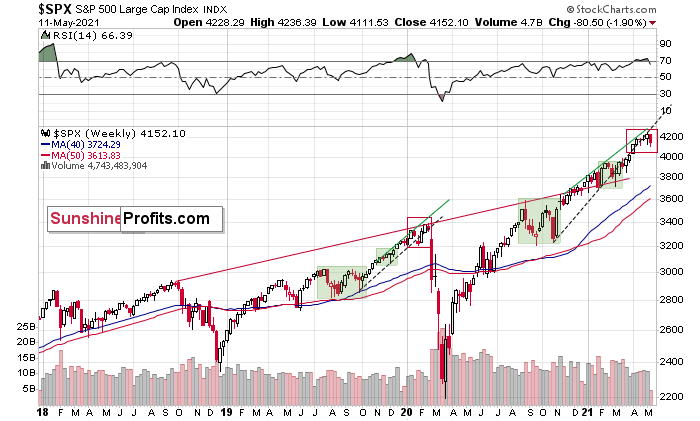
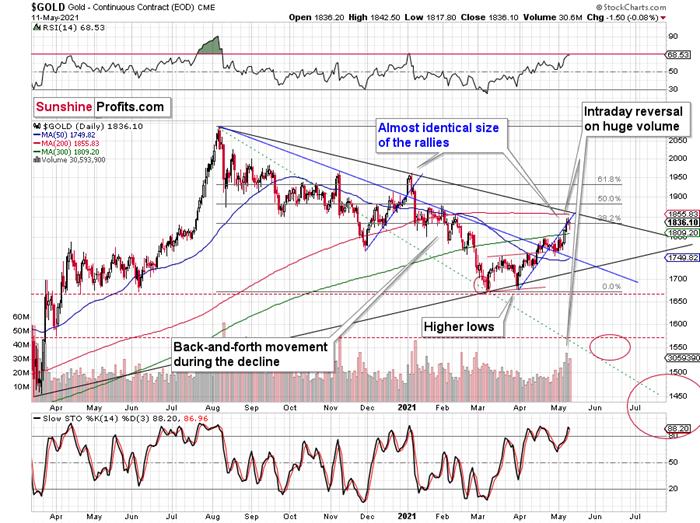
For example, the rally from 2018–2020seems very similar to the rally from 2020 to the present.
Both rallies started after a sharpdecline, and the first notable correction took the form of back-and-forthtrading around the previous high. I marked those situations with greenrectangles.
Then the rally continued with relativelysmall week-to-week volatility. I created rising support lines based on thefinal low of the broad short-term consolidation and the first notableshort-term bottom.
This line was broken, and someback-and-forth trading followed, but it was only about half of the previouscorrection in terms of price and time.
Then, we saw a sharp rally that thenleveled off. And that was the top .The thing that confirmed the top was the visible breakdown below the risingsupport line right after stocks invalidated a tiny breakout to new highs.That’s what happened in February 2020, and that’s what happened this month.
Combining this with the recentunderperformance of the NASDAQ (the previous leader which just moved to newmonthly lows) suggests that this might have indeed been the top.
“But why didn’t the mining stocks orsilver end yesterday’s session higher given the above, and the fact that stocksdeclined yesterday? Any tips on that?”
I see two likely reasons.
One is that the stock market reversedbefore the end of the day, so many investors and traders might have thoughtthat the correction was already over, and they were eager to jump back into themarket. This would explain why mining stocks (and GameStop) ended yesterday’ssession higher.
The second reason is that miners don’tnecessarily slide right after the top. Sometimes, they tend to move back andforth, testing the previous high (on lower volume).
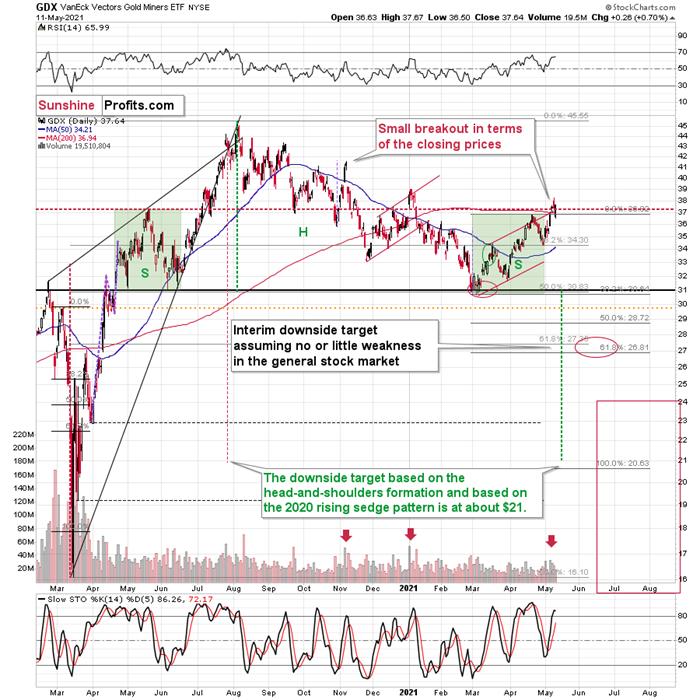
That’s what happened in early January2021, and that’s what happened yesterday. Did it change anything with regard tothe bearish implications of the current situation? Not at all. Besides, themost bearish thing about gold stocks is visible on the long-term HUIIndex chart.
TheHUI Index
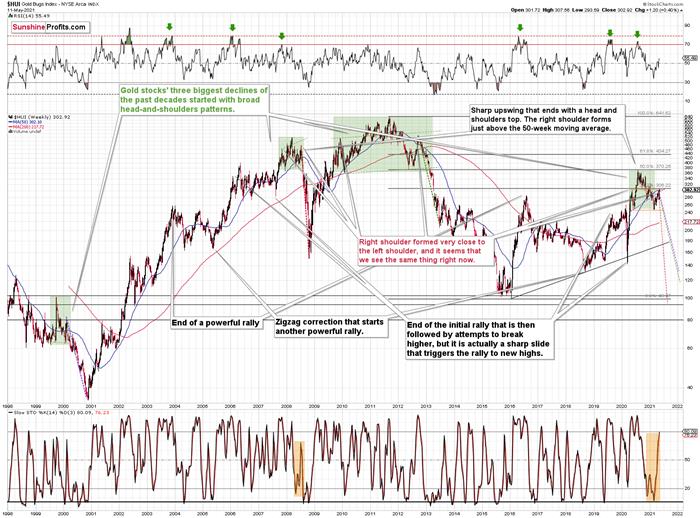
While corrective short-term upswingswithin a medium-term downtrend can feel discouraging, it’s important toremember that similar instances occurred in 2008 and 2012. And to some extentalso in early 2000.
The head and shoulders patterns from 2007– 2008 and from 2009 – 2012 had the finaltops – the right shoulders – very close to the price where the left shoulderstopped. And in early 2020, the left shoulder topped at 303.02.
This week’s intraday high in the HUIIndex was 307.56, and yesterday’sclosing price (the highest closing price we saw recently) was 302.92. That’s one-tenth of an index point away from the left shoulder’s top; if theHUI slides from here – which seems likely – we’ll have a near-perfectlysymmetrical H&S pattern with very bearish implications for the following weeksand months.
Ipreviously wrote that “it wouldn’t besurprising to see a move to about 300 in the HUI Index”. And that’s exactlywhat we saw. To clarify, one head-and-shoulders pattern – with a risingneckline – was already completed, and one head-and-shoulders pattern – with ahorizontal neckline – is being completed, but we’ll have the confirmation onceminers break to new yearly lows.
Consequently, the recent rally is not a game-changer, but rather a partof a long-term pattern that’s not visible when one focuses on the short termonly.
Let’s get back to the broader tops for awhile.
Gold,Its Battles and the War
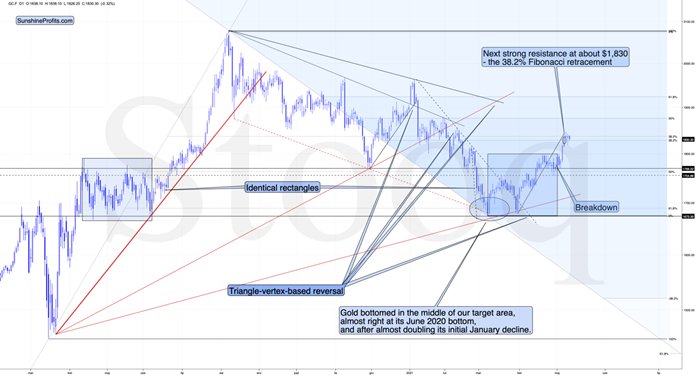
In August 2020 – at the top – gold’s peak was forming over approximately 4 tradingdays, and it plunged on the fifth day.
At the beginning of this year – at theyearly top – gold was peaking for 2-4 trading days (depending on how one treatsthe initial daily decline that was then followed by a small corrective upswing)and it plunged on the fifth day.
Today is the fourth day of what is likelyto become a topping pattern (we will know for sure only after gold slides).Consequently, the fact that gold didn’t slide profoundly yesterday (except forthe intraday decline) is not odd at all. Conversely, it’s in tune with theprevious topping patterns.
Moreover, please note that since gold isrepeating (to some extent) its 2011-2013 performance (actually, more of anaverage of gold’s trading performances from the above period and from 2008), it’s particularly normal forit to form a broader top here.
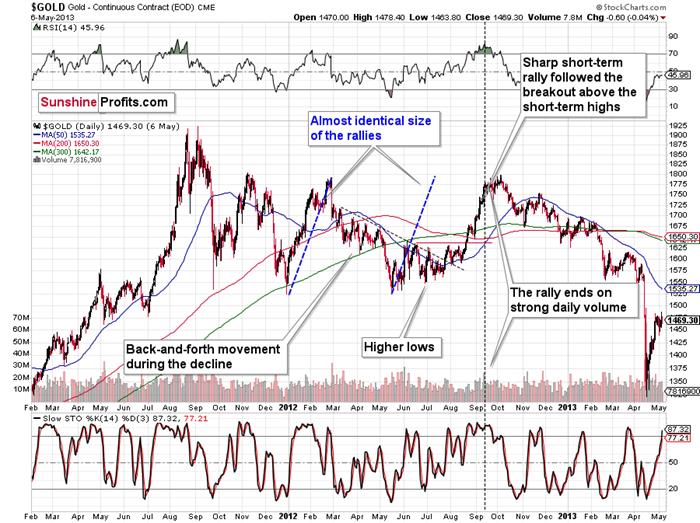
I previously wrote that the situation issimilar to 2008 in a way and to 2012-2013 in a slightly different way. When I’mlooking at it now, it’s quite normal that the gold market is mixing bothprevious performances. But it’s always easy to see things with the benefit ofhindsight.
In 2008, before the final slide, we hadclearly lower lows as well as lower highs. During the 2012-2013 consolidationwe had a more or less horizontal pattern that was then followed by the finalslide. Right now, we have something in between – we have lower highs and lowerlows, but it’s not as clear as it was in 2008.
Back in 2008, it took gold 29 weeks to move from the initial(March 2008) top to the final (October 2008) top.
Back in 2011-2013, it took gold 55 weeks to move from the initial(September 2011) top to the final (October 2013) top.
The arithmetic average of the above is 42weeks, and last week was the 39 th week after the August 2020 top.If gold stops here or shortly, it will be almost right in the middle of thesimilarity between both periods.
Consequently, the way gold and miningstocks are performing now is perfectly normal for a medium-term decline – it’snot a game-changer. The medium-term forecastfor gold remains bearish.
What’sGoing on With the Euro?
Let’s get back to the issue of head andshoulders patterns – this time in the context of the currency markets.
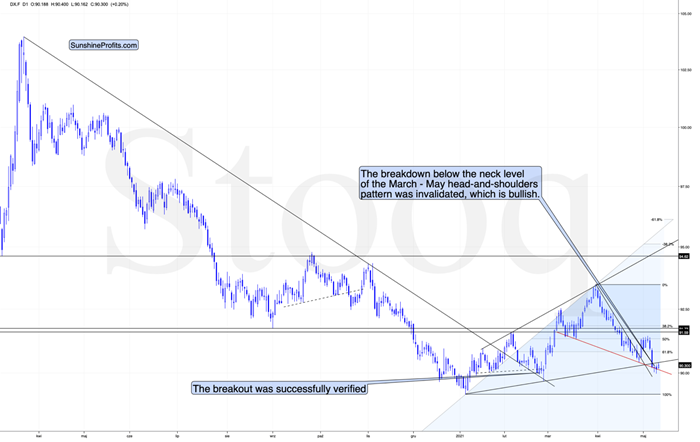
What one might not notice at first sight,but what is very important, the USD Index just invalidated a small breakdownbelow the head-and-shoulders pattern, and it rallied back above its neckline.This is a classic buy sign and a sign that the breakdown below the risingsupport line will be invalidated shortly.
There’s also a potential head andshoulders pattern present in the euro.
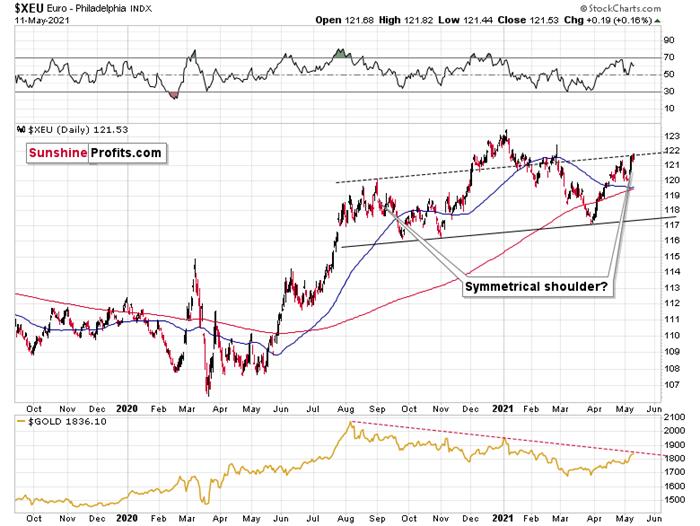
The European currency moved to the linethat’s parallel to the rising neck level of the potential head and shoulderspattern. If it now declines and moves to new yearly lows, the situation will beextremely bearish – what is more, not only for the euro but also for theprecious metals market, which tends to move in tune with the dollar competitor.
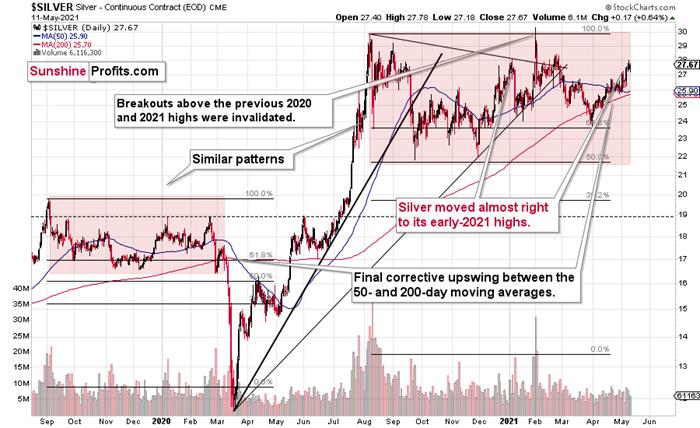
As far as silver is concerned, there’snot much new to report – my forecastfor silver hasn’t become more bullish recently. The white metalcontinues to repeat its 2019-2020 performance, and it’s after a short-termperiod of outperformance relative to gold, which indicates major tops. Unlikegold or mining stocks, silver recently moved to its early-2021 high.
Interestingly, please note that silver isrepeating more or less the same pattern from the past that the general stockmarket does. And we all know what happened to silver (and mining stocks) whenthe general stock market plunged in March 2020.
Thank you for reading our free analysistoday. Please note that the above is just a small fraction of today’sall-encompassing Gold & Silver Trading Alert. The latter includes multiplepremium details such as the target for gold that could be reached in the nextfew weeks. If you’d like to read those premium details, we have good news foryou. As soon as you sign up for our free gold newsletter, you’ll get a free7-day no-obligation trial access to our premium Gold & Silver TradingAlerts. It’s really free – sign up today.
Przemyslaw Radomski, CFA
Founder, Editor-in-chief
Toolsfor Effective Gold & Silver Investments - SunshineProfits.com
Tools für EffektivesGold- und Silber-Investment - SunshineProfits.DE
* * * * *
About Sunshine Profits
SunshineProfits enables anyone to forecast market changes with a level of accuracy thatwas once only available to closed-door institutions. It provides free trialaccess to its best investment tools (including lists of best gold stocks and best silver stocks),proprietary gold & silver indicators, buy & sell signals, weekly newsletter, and more. Seeing is believing.
Disclaimer
All essays, research and information found aboverepresent analyses and opinions of Przemyslaw Radomski, CFA and SunshineProfits' associates only. As such, it may prove wrong and be a subject tochange without notice. Opinions and analyses were based on data available toauthors of respective essays at the time of writing. Although the informationprovided above is based on careful research and sources that are believed to beaccurate, Przemyslaw Radomski, CFA and his associates do not guarantee theaccuracy or thoroughness of the data or information reported. The opinionspublished above are neither an offer nor a recommendation to purchase or sell anysecurities. Mr. Radomski is not a Registered Securities Advisor. By readingPrzemyslaw Radomski's, CFA reports you fully agree that he will not be heldresponsible or liable for any decisions you make regarding any informationprovided in these reports. Investing, trading and speculation in any financialmarkets may involve high risk of loss. Przemyslaw Radomski, CFA, SunshineProfits' employees and affiliates as well as members of their families may havea short or long position in any securities, including those mentioned in any ofthe reports or essays, and may make additional purchases and/or sales of thosesecurities without notice.
Przemyslaw Radomski Archive |
© 2005-2019 http://www.MarketOracle.co.uk - The Market Oracle is a FREE Daily Financial Markets Analysis & Forecasting online publication.