Gold Makes Strides On The Upside
A move above a resistance level.
A bullish pattern since August but falling interest.
Defying the December curse.
The Fed could ignite a rally.
UGLD for maximum impact on the upside.
The gold market faded into the background over the past months as the price of the yellow metal broke down over the summer months and declined to its lowest level since early 2017. The strong dollar weighed on the price of gold in mid-August. As the dollar index rose to a new high, the precious metal fell to its lows for 2018 at just over the $1160 per ounce level. Gold quickly recovered to over $1200 by the end of August and has never returned to its lows from the middle of that month.
In a sign of strength for the gold market, the dollar index rose to yet another new peak for this year in mid-November. Gold briefly probed below the $1200 level as the dollar index made strides on the upside, but the price of the precious metal came storming back.
Since the week of November 12, the price of gold has not returned to $1200 per ounce, and last week, the price made a new high above $1250 for the first time since July while the dollar index is trading not far below its mid-August peak that sent the price of gold to its lows earlier this year.
The Velocity Shares 3X Long Gold ETN product (UGLD) is a triple-leveraged tool that can turbocharge the price performance in the gold futures market on the upside if the price continues to move to the upside over the coming days and weeks.
A move above a resistance level
There was so much going on in markets last week across all asset classes that many market participants barely noticed gold edge and close above a level of technical resistance on Friday, December 7. 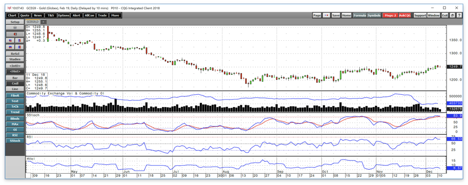
Source: CQG
As the daily chart highlights, the price of the active month February gold futures contract moved to a new high at $1255.80 at the end of last week and settled on Friday, December 7 at $1252.60 above the October 26 high and at the highest price since July 17. The nearby contract was at the $1250 level on Tuesday.
Price momentum on the short-term chart and relative strength have risen into overbought territory while daily historical volatility is down at 6.57% as the price of gold has rebounded. The price of gold moved higher as volatility in the stock market caused a flight to quality as money flowed into high-quality U.S. bonds and the yellow metal. Moreover, the latest comments from officials at the U.S. central bank point to a more gradual approach to rate hikes. As of Friday's settlement price, gold had moved $79.40 above the mid-August low which was the bottom so far in 2018.
A bullish pattern since August but falling interest
The price action in gold has been bullish since the mid-August low.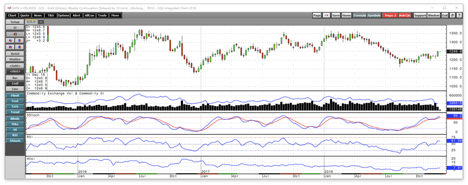
Source: CQG
As the weekly chart shows, the price has been making progress on the upside with higher lows and higher highs since the August bottom at $1161.40. Both price momentum and relative strength on the medium-term chart have moved into overbought territory. At the same time, the open interest metric has dropped significantly. Open interest is the total number of open long and short positions in the futures market. The metric has dropped from 539,520 contracts during the week of November 12, when the dollar index rose to its most recent peak, to 403,733 contracts as of December 10. The decline of 135,787 contracts or 25.2% while the price has appreciated is not typically a validation of an emerging bullish trend in a futures market. The drop in the metric is a sign that longs and shorts have exited risk positions since November 13. However, so far, gold has done something different during the final month of the year than it had over the previous three years.
Defying the December curse
Gold had suffered from an end of year curse in 2015, 2016, and 2017.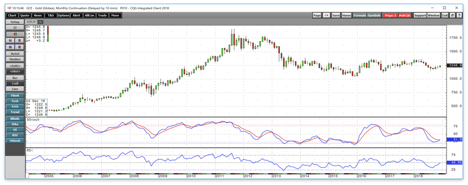
Source: CQG
The monthly chart shows that gold dropped to a low at $1046.20 in December 2015 which has been the bottom of the market since back in 2010. In December 2016, gold traded to a low at $1123.90 which is a level that has not been seen since the end of 2016. In 2017, the low in December was at $1236.50 per ounce, but the yellow metal fell below that level in July on its way to the lows at just over the $1160 level.
Gold dropped during the final month of the prior three years as the Fed hiked the short-term Fed Funds rate in each of those years. In 2015, the first rate hike in nine years and liftoff from zero percent short-term rates caused the low in gold. In 2016, the central bank acted for the second time to tighten short-term credit. Last December, the Fed increased the rate for the third time causing pressure on the price of the precious metal.
It is starting to look like the low for 2018 came early this year as the final FOMC meeting of the year approaches. As of the end of last week, it was starting to look like the odds of a fourth increase in the Fed Funds rate are not as high as they were over recent weeks.
The Fed could ignite a rally
At a recent speech before the Economic Club of New York, Fed Chairman Jerome Powell backtracked on recent comments that the Fed Funds rate was behind the curve. The Fed chief told the audience that the rate was now closer to equilibrium that he had indicated in past comments. Moreover, on Friday, December 7, St. Louis Fed President James Bullard commented that the central bank could decide to pause, wait for more data, and revisit another rate hike at their January meeting. Many issues are facing the U.S. and global economy these days that may make the Fed leave rates unchanged at their final meeting of the year on December 18 and 19. Perhaps the most significant factor will be the results of the ongoing drama surrounding Brexit. Prime Minister May delayed the vote on her plan scheduled for December 11 as it would have gone down in defeat. On Tuesday, the Prime Minister was working her way around Europe in an attempt to secure more concessions from E.U. leaders, but it is starting to look like the end for her leadership as she finds herself in an impossible situation where she will not be able to satisfy both the E.U. and her colleagues in the Parliament. We could see the impact of events in the U.K. ripple across markets around the world like a tsunami causing contagion and an increase in fear and uncertainty for the global economy. At the same time, with volatility in the U.S. stock market already at a high level, a pause by the Fed could be just the right amount of monetary accommodation that gold needs to attract the buying necessary to take it to higher levels. The level to watch on the upside on the February future contract is the 50% retracement level from the April high at $1365.40 and the mid-August bottom at $1161.40 which stands at $1263.40, just $6.80 above the high on Monday, December 10. A move above that level could ignite trend-following buying in the gold futures market.
Uncertainty as a result of new leadership in the U.K. and no decisions on the final form of Brexit could push gold above this level and reverse the December curse in 2018. A move above $1263.40 would change the trend on the longer-term chart. The monthly chart shows that relative strength has already turned higher and the price momentum indicator is attempting to cross to the upside in oversold territory. A move above the 50% retracement level is likely to thrust momentum on the monthly chart higher.
UGLD for maximum impact on the upside
With gold approaching a technical level that could trigger a tsunami of buying, the Velocity Shares 3X Long Gold ETN product (UGLD) could be the perfect short-term tool to take advantage of a break to the upside in the price of the yellow metal. The fund summary for UGLD states:
"The investment seeks to replicate, net of expenses, three times the S&P GSCI Gold index ER. The index comprises futures contracts on a single commodity. The fluctuations in the values of it are intended generally to correlate with changes in the price of gold in global markets."
UGLD is only appropriate for short-term positions in the gold market as it uses leverage in the futures and derivatives market to achieve its triple price performance. The price for leverage is time decay, so the value of UGLD will deteriorate over time if the price of gold does not continue to climb. UGLD and its bearish counterpart DGLD are susceptible to reverse splits which destroy their respective values. February gold futures traded to a low at $1216.80 on November 28 and moved to a high at $1255.80 on December 7, a rise of 3.2%.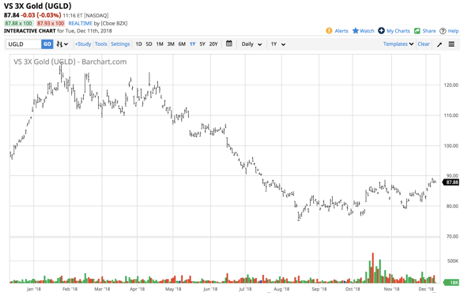
Source: Barchart
Over the same period, UGLD moved from $81.30 to $89.22 per share, a rise of 9.7% which is triple the move in gold on a percentage basis. UGLD has net assets of $126.83 million and trades an average of 136,645 shares each day. However, the all-time high in the product came in 2011 at $609.20 per share which is a reminder that the cost of time decay can be prohibitive and while this tool is an excellent short-term instrument, it is only for short-term forays into the gold market on the long side.
Gold has been making strides on the upside, but its biggest test could come this week as it approaches a level that could cause trend-following traders to return to the market on the long side and erase a bearish pattern during the final month of the year.
The Hecht Commodity Report is the most comprehensive commodities reports available today from the top-ranked ranked author in both commodities, forex, and precious metals. My weekly report covers the market movements of over 25 different commodities and provides bullish, bearish and neutral calls; directional trading recommendations, and actionable ideas for traders and investors.
For the next two weeks, I am offering a one-time sale price. Anyone who signs up for a one-year subscription will receive a 30% discount ($490 per year) off the current rate and will never experience an increase as long as they remain a subscriber.
Disclosure: I/we have no positions in any stocks mentioned, and no plans to initiate any positions within the next 72 hours. I wrote this article myself, and it expresses my own opinions. I am not receiving compensation for it (other than from Seeking Alpha). I have no business relationship with any company whose stock is mentioned in this article.
Additional disclosure: The author always has positions in commodities markets in futures, options, ETF/ETN products, and commodity equities. These long and short positions tend to change on an intraday basis.
Follow Andrew Hecht and get email alerts