Gold Mid-Tier GDXJ Stocks Fundamentals / Commodities / Gold and Silver Stocks 2019

 The mid-tier goldminers’ stocks have been rallying on balance in recent months, carving a solidyoung upleg. They’ve mostly finishedreporting their latest fourth-quarter results, revealing how they are faring fundamentally. Their operating and financial performance isvery important for investors, as the mid-tier realm is where most of thegold-stock sector’s gains accrue. They faredreally well in a challenging quarter.
Four times a yearpublicly-traded companies release treasure troves of valuable information inthe form of quarterly reports. Requiredby the US Securities and Exchange Commission, these 10-Qs and 10-Ks contain thebest fundamental data available to traders. They dispel all the sentiment distortions inevitably surrounding prevailingstock-price levels, revealing corporations’ underlying hard fundamentalrealities.
While 10-Qs with filingdeadlines of 40 days after quarter-ends are required for normal quarters, 10-Kannual reports are instead mandated after quarters ending fiscal years. Most gold miners logically run theiraccounting on calendar years, so they issue 10-Ks after Q4s. Since these annual reports are larger and must be audited by independent CPAs, theirfiling deadlines are extended to 60 days after quarter-ends.
The global nature ofthe gold-mining industry complicates efforts to gather this all-importantfundamental data. Many mid-tier goldminers trade in Australia, South Africa, Canada, the United Kingdom, and othercountries with quite-different reporting requirements. These include half-year reporting rather thanquarterly, long 90-day filing deadlines after year-ends, and dissimilarpresentations of operating and financial results.
The definitive list of mid-tiergold miners to analyze comes from the GDXJ VanEck Vectors Junior Gold MinersETF. Despite its misleading name, GDXJis largely dominated by mid-tier goldminers and not juniors. GDXJ is theworld’s second-largest gold-stock ETF, with $4.1b of net assets this week. That is only behind its big-brother GDXVanEck Vectors Gold Miners ETF that includes the major gold miners.
Major gold miners are thosethat produce over 1m ounces of gold annually. The mid-tier gold miners are smaller, producing between 300k to 1mounces each year. Below 300k is thejunior realm. Translated into quarterlyterms, majors mine 250k+ ounces, mid-tiers 75k to 250k, and juniors less than 75k. GDXJ was originally launched as a real junior-gold-stockETF as its name implies, but it was forced to change its mission.
Gold stocks soared in priceand popularity in the first half of 2016, ignited by a new bull market in gold. The metal itself awoke from deep secular lowsand surged 29.9% higher in just 6.7 months. GDXJ and GDX skyrocketed 202.5% and 151.2% higher in roughly that samespan, greatly leveraging gold’s gains. As capital flooded into GDXJ to own junior gold stocks, this ETF riskedrunning afoul of Canadian securities laws.
Canada is the center ofthe junior-gold universe, where most juniors trade. Once any investor including an ETF buys up a20%+ stake in a Canadian stock, it is legally deemed a takeover offer. This may have been relevant to a single corporatebuyer amassing 20%+, but GDXJ’s legions of investors certainly weren’t tryingto take over small gold miners. GDXJ diversified away from juniors to comply withthat archaic rule.
Smaller juniors bymarket capitalization were abandoned entirely, cutting them off from the sizableflows of ETF capital. Larger juniorswere kept, but with their weightings within GDXJ greatly demoted. Most of its ranks were filled with mid-tiergold miners, as well as a handful of smaller majors. That was frustrating, but ultimately beneficial. Mid-tier gold miners are in the sweet spot for stock-price-appreciationpotential!
Major gold miners areincreasingly struggling with decliningproduction, they can’t find or buy enough new gold to offset their depletion. And the stock-price inertia from their largemarket capitalizations is hard to overcome. The mid-tiers can and are boosting their gold output, fueling big growthin operating cash flows and profitability. With much-lower market caps, capital inflows drive their stock priceshigher much faster.
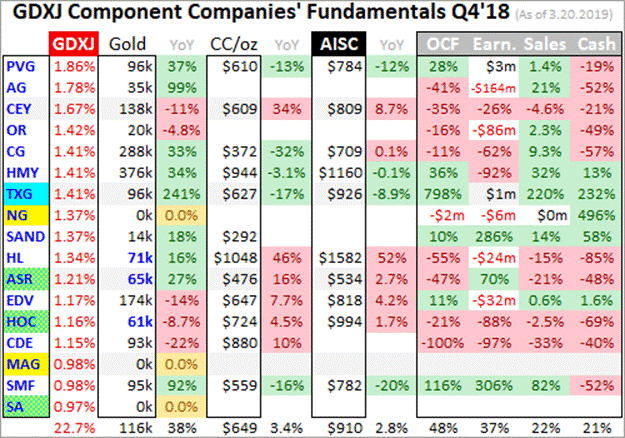
Every quarter I diveinto the latest results from the top 34 GDXJ components. That’s simply an arbitrary number that fitsneatly into the tables below, but a commanding sample. These companies represented 82.1% of GDXJ’stotal weighting this week, even though it contained a whopping 71 stocks! 6 of the top 34 were majors mining 250k+ounces, 17 mid-tiers at 75k to 250k, 8 “juniors” under 75k, and 3 explorerswith zero.
These majors accountedfor 19.8% of GDXJ’s total weighting, and really have no place in a “Junior GoldMiners ETF” when they could instead be exclusively in GDX. These mid-tiers weighed in at 44.3% of GDXJ. The “juniors” among the top 34 represented just14.8% of GDXJ’s total. But only 4 ofthem at a mere 6.1% of GDXJ are true junior golds, meaning they derive over half their revenues from actuallymining gold.
The rest are primary silverminers, gold-royalty companies, and gold streamers. GDXJ is overwhelmingly a mid-tier gold minersETF, with sizable small-major exposure. Investors and speculators need to realize itis not a junior-gold investment vehicle as advertised. GDXJ also has major overlap with GDX. Fully 28 of these top 34 GDXJ gold miners are included in GDX too, with23 of them also among GDX’s top 34 stocks.
The GDXJ top 34accounting for 82.1% of its total weighting also represent 36.6% of GDX’s own totalweighting! The GDXJ top 34 clusteredbetween the 11th- to 40th-highest weightings in GDX. Thus over4/5ths of GDXJ is made up by almost 3/8ths of GDX. But GDXJ is far superior, excluding the largegold majors struggling with production growth. GDXJ gives much-higher weightings to better mid-tier miners.
The average Q4’18 goldproduction among GDXJ’s top 34 was 164k ounces, just over half as big as the GDX top 34’s 302k average. Despite these two ETFs’ extensive commonholdings, GDXJ is increasinglyoutperforming GDX. GDXJ holds manyof the world’s best mid-tier gold miners with big upside potential as gold’sown bull gradually powers higher. Thusit is important to analyze GDXJ miners’ latest results.
So after every quarterlyearnings season I wade through all available operational and financial resultsand dump key data into a big spreadsheet for analysis. Some highlights make it into these tables. Any blank fields mean a company hadn’treported that data as of this Wednesday. The first couple columns show each GDXJ component’s symbol and weightingwithin this ETF as of this week. Not all are US symbols.
19 of the GDXJ top 34 primarilytrade in the US, 5 in Australia, 8 in Canada, and 2 in the UK. So some symbols are listings from companies’main foreign stock exchanges. That’s followedby each gold miner’s Q4’18 production in ounces, which is mostly in pure-goldterms excluding byproducts often found in gold ore like silver and basemetals. Then production’s absoluteyear-over-year change from Q4’17 is shown.
Next comes gold miners’most-important fundamental data for investors, cash costs and all-in sustainingcosts per ounce mined. The latter directlydrives profitability which ultimately determines stock prices. These key costs are also followed by YoYchanges. Last but not least the annual changesare shown in operating cash flows generated, hard GAAP earnings, revenues, andcash on hand with a couple exceptions.
Percentage changesaren’t relevant or meaningful if data shifted from positive to negative or viceversa, or if derived from two negative numbers. So in those cases I included raw underlying data rather than weird ormisleading percentage changes. In caseswhere foreign GDXJ components only released half-year data, I used that and splitit in half where appropriate. Thatoffers a decent approximation of Q4’18 results.
Symbols highlighted inlight blue newly climbed into the ranks of GDXJ’s top 34 over this pastyear. And symbols highlighted in yellow showthe rare GDXJ-top-34 components that aren’t also in GDX. If both conditions are true blue-yellowcheckerboarding is used. Finallyproduction bold-faced in blue shows the handful of junior gold miners in GDXJ’s higher ranks, under 75k ounces quarterlywith over half of sales from gold.
This whole dataset togethercompared with past quarters offers a fantastic high-level read on how mid-tiergold miners as an industry are faring fundamentally. While Q4’18 proved challenging with loweraverage gold prices, the GDXJ miners generally weathered it well. These elite mid-tier miners did much better lastquarter than the major-dominated GDX elites. Their profits and stock prices are ready to soar with higher gold.
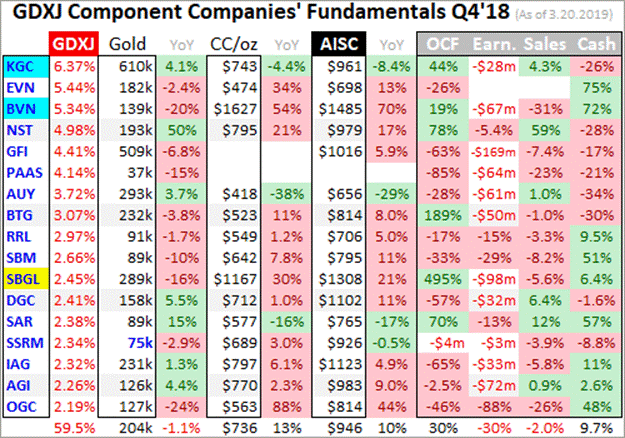
GDXJ’s managers have continuedto fine-tune its ranks over this past year, making some good changes. For some inexplicable reason, one of theworld’s largest gold miners AngloGold Ashanti was one of this ETF’s topholdings as discussed lastquarter. AU was finally kicked outand replaced with a smaller major gold miner Kinross Gold and a mid-tierBuenaventura. Together they now accountfor 11.7% of GDXJ’s weighting.
Reshuffling at the top makesyear-over-year changes less comparable, particularly given KGC’s larger sizerelative to most of the rest of the GDXJ top 34. Neither it nor BVN were included in GDXJ ayear ago, and are new additions since Q3’18 results. Both are sizable GDX components, probablyadded to GDXJ to keep the weightings down in its smaller Canadiancomponents. 4 other stocks climbed intothe top 34.
Torex, Alacer, Hochschild,and Seabridge were already in GDXJ a year ago but weighted below the top34. GDXJ is largely-but-not-entirelymarket-cap weighted, so it’s normal for components to rise into or fall out ofthe top 34 as their stock prices move higher or lower. All the following comparisons between Q4’18and Q4’17 are across the two slightly-different GDXJ-top-34 sets, not the exactcompanies shown above.
Production has alwaysbeen the lifeblood of the gold-mining industry. Gold miners have no control over prevailing gold prices, their productsells for whatever the markets offer. Thusgrowing production is the only manageable way to boost revenues, leading toamplified gains in operating cash flows and profits. Higher production generates more capital toinvest in expanding existing mines and building or buying new ones.
Gold-stock investorshave long prized production growth above everything else, as it is inexorablylinked to company growth and thus stock-price-appreciation potential. The top 34 GDXJ gold miners excelled in thatdepartment, growing their aggregate output by a big 12.8% YoY to 5.1m ounces! That’s really impressive, trouncing both the major gold miners dominatingGDX as well as the entire world’s gold-mining industry.
Last week I analyzedthe GDX majors’ Q4’18results, which revealed they are still struggling with seriouschallenges. The GDX top 34’s totalproduction fell 3.9% YoY when adjusted for a mega-merger. That was worse than total global outputslumping 0.9% YoY according to the World Gold Council. So GDXJ’s mostly-mid-tier gold miners reallystand out. They are bucking the industrytrend with strong production growth.
Again GDXJ’s top 34components start at the 11th-highest weighting within GDX. Most of the production problems occurred abovethat threshold, in GDX’s top 10 components which include the world’s largestmajor gold miners. Their immense averageproduction of 630k ounces in Q4’18 was nearly 4x the 164k average among GDXJ’stop 34! Those GDX top 10 also accounted fora dominant 59.1% of its total weighting.
GDXJ excluding these depleting giants andreallocating their heavy weightings across smaller majors and mid-tier goldminers makes all the difference. The bigmajors’ waning production and large market caps act as an anchor retarding GDX’supside. GDXJ doesn’t share that burden,which helped its top 34 show such strong production growth. There’s no reason to own the large majors withtheir serious challenges.
Also interesting on theGDXJ production front last quarter was silver. This “Junior Gold Miners ETF” also includesmajor silver miners, both primary and byproduct ones. The GDXJ top 34’s silver mined rocketed 53.8%higher YoY to 31.2m ounces! Forcomparison the GDX top 34’s total reported output of 28.8m ounces actuallyslumped 1.5% YoY. The smaller GDXJmid-tiers are way better than majors at growing their outputs.
The mid-tier goldminers continue to prove all-important production growth is doable off smallerbases. With a handful of mines or lessto operate, mid-tiers can focus on expanding them or building a new mine toboost their output beyond depletion. Butthe majors are increasingly failing to do this with the super-high productionbases they operate at. As long as themajors are struggling, it’s prudent to avoid them.
GDXJ investors would bebetter served if this ETF contained nomajor gold miners producing over 250k ounces a quarter on average. They still command nearly 1/5th of itsweighting, which could be far better reallocated in mid-tiers and juniors. If VanEck kept the major gold miners in GDXwhere they should be, it could give GDXJ much-better upside potential. That would make this ETF more popular and successful.
In gold mining, productionand costs are generally inversely related. Gold-mining costs are largely fixed quarterafter quarter, with actual mining requiring about the same levels of infrastructure,equipment, and employees. So the higherproduction, the more ounces to spread mining’s big fixed costs across. Thus with sharply-higher YoY production in Q4’18,the GDXJ top 34 should’ve seen proportionally-lower costs.
There are two majorways to measure gold-mining costs, classic cash costs per ounce and thesuperior all-in sustaining costs per ounce. Both are useful metrics. Cashcosts are the acid test of gold-miner survivability in lower-gold-priceenvironments, revealing the worst-case gold levels necessary to keep the minesrunning. All-in sustaining costs show wheregold needs to trade to maintain current mining tempos indefinitely.
Cash costs naturallyencompass all cash expenses necessaryto produce each ounce of gold, including all direct production costs, mine-leveladministration, smelting, refining, transport, regulatory, royalty, and tax expenses. In Q4’18 these top-34-GDXJ-component goldminers that reported cash costs averaged $698 per ounce. That was up a sharp 10.8% YoY, and considerablyworse than the GDX top 34’s $655 average.
Those were the highestGDXJ cash costs seen since at least Q2’16, when I started this researchthread. But even $698 is far lower thanprevailing gold prices, showing the mid-tier gold miners face no existential threat. And GDXJ’s high cash costs last quarter aren’trighteous anyway, as they were skewed higher by an extreme outlier. One of the new GDXJ companies Buenaventura reportedcrazy cash costs of $1627 per ounce!
Excluding that wild anomaly,the rest of the GDXJ top 34 averaged cash costs of $662 which was right in linewith Q3’18’s $663. They’d be even lower withoutSibanye-Stillwater, a troubled South-African major gold miner that saw cash costssoar 30.1% YoY to an ugly $1167. If thattoo is excluded the overall average falls to $642. So for the most part the mid-tier gold miners’cash costs remain really low relative to gold.
Way more important thancash costs are the far-superior all-in sustaining costs. They were introduced by the World Gold Councilin June 2013 to give investors a much-better understanding of what it reallycosts to maintain gold mines as ongoing concerns. AISCs include all direct cash costs, but thenadd on everything else that is necessary tomaintain and replenish operations at current gold-production levels.
These additionalexpenses include exploration for new gold to mine to replace depletingdeposits, mine-development and construction expenses, remediation, and minereclamation. They also include thecorporate-level administration expenses necessary to oversee gold mines. All-in sustaining costs are themost-important gold-mining cost metric by far for investors, revealing goldminers’ true operating profitability.
The GDXJ top 34reporting AISCs averaged $932 per ounce in Q4’18, which was also up a sizable 7.1% YoY. That was also barely the highest seen since at least Q2’16, contradictingthe big production growth these miners achieved. But once again this was heavily skewed by extremeoutliers, including both BVN and SBGL. Hecla also reported a stunning 52.3% YoY surge in its gold AISCs to a nosebleed$1582 per ounce!
Both BVN and SBGL reportedsharply-lower YoY production, helping explain their huge cost surges. HL’s is more temporary, as it expects 2019 goldAISCs to average a still-high-but-much-lower $1250. Without these abnormal situations, the restof the GDXJ top 34 averaged excellent AISCs of just $863 per ounce. That wouldbe down 0.8% YoY, and is close to the GDX majors’ $837 average also excluding BVNand HL.
Yet even at that skewedartificially-high $932 per ounce, the elite GDXJ gold miners have greatpotential to enjoy surging profits and hence stock prices. Gold was relatively weak last quarter, averaging$1228 which was 3.8% lower YoY. That impliedthe mid-tier gold miners as an industry were earning $296 per ounce. That’s still a 24% profit margin, proving Q4’18’smajor GDXJ lows weren’t fundamentallyrighteous.
Gold is faring much betterin this almost-over Q1’19, averaging $1303 which is up a big 6.1% quarter-on-quarter. Assuming GDXJ-top-34 AISCs are flat, theseelite mid-tier gold miners are earning around $371 per ounce this quarter. That implies enormous 25.3% QoQ profits growth! Wewon’t know for sure until after Q1’s earnings season, near mid-May. But the mid-tiers’ fundamentals should’vegreatly improved.
Bigger profits drivenby higher gold prices are sure to attract investors back to the still-beaten-downgold-stock sector in a big way. The goldminers will stand out even more with earnings growth expected to be scarce inthe general stock markets this year. Ifgold continues marching higher on balance as it ought to, and GDXJ averageAISCs retreat as BVN and HL get anomalous costs under control, GDXJ profits will soar.
The GDXJ top 34’s hardaccounting results in Q4’18 were mixed, but way better than GDX on all fronts. These elite mid-tier gold miners reportedtotal sales of $7.4b last quarter, up a strong 12.1% YoY. That is right in line with their 12.8% YoYtotal gold production growth. That huge53.8% YoY surge in their silver output helped offset the 3.8% YoY decline inaverage gold prices. The mid-tier goldminers’ revenues are strong.
Compare that to the GDXtop 34, which saw sales plunge 10.3% YoY in Q4 due to 3.9%-lower merger-adjustedgold output. Those strong GDXJ-top-34 revenueskept operating-cash-flow generation solid, totaling $2.2b which was down 9.2%YoY. That again crushed the majors inthe GDX top 34, which saw OCFs plummet 30.4% YoY. The divergence between how mid-tiers and majorsare faring these days is gaping.
The elite GDXJ mid-tiergold miners also invested in growing their production, so their collectivetotal cash on hand slid 14.3% YoY to $5.9b. The GDX majors saw a similar 14.6% YoY decline in their cash, yet they certainlydidn’t spend enough to offset their depleting mines. The only real blemish on the GDXJ top 34’s Q4results came in hard GAAP profits. Theiraggregate bottom line collapsed to a $732m loss last quarter!
That was far worse thanQ4’17’s $26m loss. Much of this was dueto big non-cash impairment charges,writedowns of the carrying value of gold mines and deposits due to lower goldprices and forecasts. If gold minersexpect lower gold prices going forward, they have to flush the resulting expectedeconomic losses through current-quarter results when those impairments are perceived. That hammered overall results.
Honestly the Q4’18 impairmentsseemed pretty unnecessary, with average gold prices merely down 3.8% YoY. 2018’s full-year average gold price actuallyrose 0.8% YoY. Major impairments usuallyhappen in years gold plunges sharply, like 2013’s brutal 27.9% plummeting. Something like that really changes theeconomic assumptions underlying gold mines. But gold only slumped 1.6% last year, which is utterly trivial.
Some of the bigger impairmentcharges came from First Majestic Silver and Osisko Gold, which wrote off $168mand $166m. This primary silver miner andgold-royalty company aren’t even mid-tier gold miners. And the perpetually-troubled South Africanmajors Gold Fields and Sibanye-Stillwater which have long tainted GDXJ reportedbig half-year losses implying $169m and $98m in Q4. These alone total $601m of losses.
That accounted fornearly 5/6ths of the GDXJ top 34’s total GAAP losses last quarter. While many of the elite mid-tier gold minersreported small losses, the great majority of the surge in losses came from a handfulof stocks. Overall the GDXJ GAAP profitslooked relatively decent compared to the majors. GDX’s top 34 reported a staggering $6.0b in accountinglosses in Q4’18! The mid-tiers are thrashingthe majors.
GDXJ’s mostly-mid-tier componentlist of great gold miners is really faring well, especially compared to thestruggling large gold miners. Investorslooking to ride this gold-stock bull should avoid the world’s biggest goldproducers and instead deploy their capital in the mid-tier realm. The best gains will be won in individual smallergold miners with superior fundamentals, plenty of which are included withinGDXJ.
Despite being the world’sleading gold-stock ETF, GDX needs to beavoided. The major gold miners thatdominate its weightings are struggling too much fundamentally, unable to growtheir production. Capital will instead flowinto the mid-tiers, juniors, and maybe a few smaller majors still able to boosttheir output and thus earnings going forward. None of this is new, but the major and mid-tier disconnect continues toworsen.
Again back inessentially the first half of 2016, GDXJ skyrocketed 202.5% higher on a 29.9%gold upleg in roughly the same span! WhileGDX somewhat kept pace then at +151.2%, it is lagging GDXJ more and more as itsweightings are more concentrated in stagnant gold mega-miners. The recent big mergers aregoing to worsen that investor-hostile trend. Investors should buy better individual gold stocks, or GDXJ.
One of my core missionsat Zeal is relentlessly studying the gold-stock world to uncover the stockswith superior fundamentals and upside potential. The trading books in both our popular weekly and monthly newsletters are currentlyfull of these better gold and silver miners. Mostly added in recent months as gold stocks recovered from deep lows,our unrealized gains are already running as high as 74% this week!
If you want to multiplyyour capital in the markets, you have to stayinformed. Our newsletters are agreat way, easy to read and affordable. They draw on my vast experience, knowledge, wisdom, and ongoing researchto explain what’s going on in the markets, why, and how to trade them with specificstocks. As of Q4 we’ve recommended andrealized 1076 newsletter stock trades since 2001, averaging annualized realizedgains of +16.1%! That’s nearly doublethe long-term stock-market average. Subscribe today for just $12per issue!
The bottom line is themid-tier gold miners are thriving fundamentally. They are still rapidly growing their productionwhile majors suffer sharp output declines. The mid-tiers are holding the line on costs, which portends strongleveraged profits growth as gold continues grinding higher on balance. The performance gap between the smaller mid-tierand junior gold miners and larger major ones is big and still mounting.
Investors and speculatorsreally need to pay attention to this intra-sector disconnect. Gold and its miners’ stocks should power farhigher in coming years as the lofty general stock markets roll over. But the vast majority of the gains will beconcentrated in growing gold miners, not shrinking ones. This means the mid-tier and junior gold minerswill far outperform the majors. The smallerminers have superior fundamentals.
Adam Hamilton, CPA
So how can you profit from this information? We publish an acclaimed monthly newsletter, Zeal Intelligence , that details exactly what we are doing in terms of actual stock and options trading based on all the lessons we have learned in our market research. Please consider joining us each month for tactical trading details and more in our premium Zeal Intelligence service at … www.zealllc.com/subscribe.htm
Questions for Adam? I would be more than happy to address them through my private consulting business. Please visit www.zealllc.com/adam.htm for more information.
Thoughts, comments, or flames? Fire away at zelotes@zealllc.com . Due to my staggering and perpetually increasing e-mail load, I regret that I am not able to respond to comments personally. I will read all messages though and really appreciate your feedback!
Copyright 2000 - 2019 Zeal Research ( www.ZealLLC.com )
Zeal_LLC Archive |
© 2005-2019 http://www.MarketOracle.co.uk - The Market Oracle is a FREE Daily Financial Markets Analysis & Forecasting online publication.