Gold Miners Ready to Fall Further / Commodities / Gold and Silver Stocks 2020

It didn’t take long for the mining stocksto turn south once again. No wonder, given that their breakdown was more thanverified.
Additionally, they also got bearish supportfrom gold, the stock market, and the USD Index, which also confirmed theirdecisive move. For more details, let’s take a closer look at the chart below.
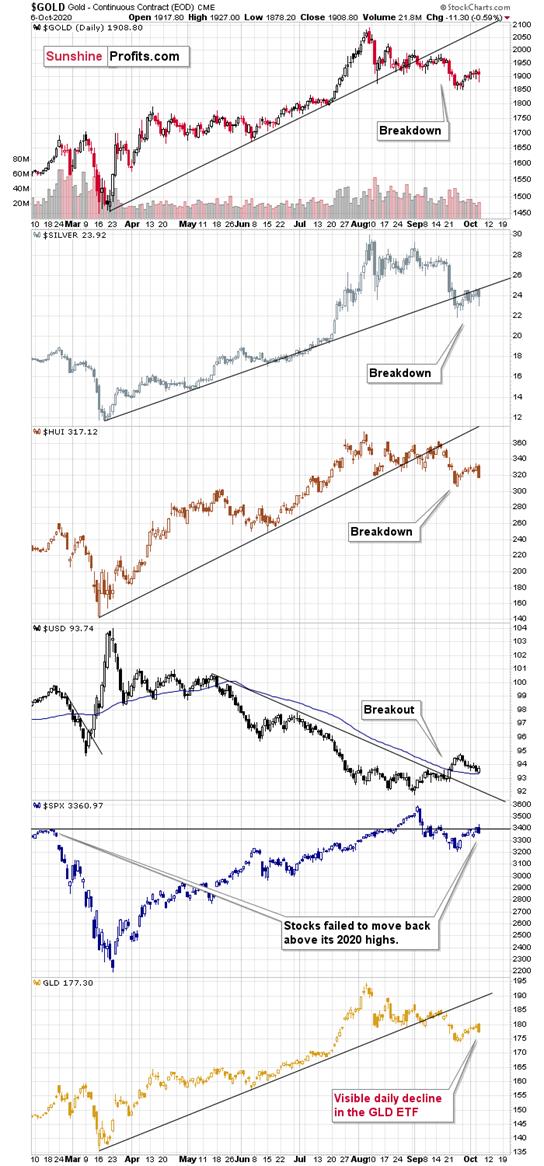
We've witnessed the USD's breakout andbreakdowns in the precious metals market, followed by smaller corrections.That’s both: normal and natural.
If the USD Index tendency was reallydescending, and it was upward in case of PMs:
The USD Index would havedeclined to new lows, or at least it would’ve moved below its 50-day movingaverage.Gold would have rallied backabove the $2,000 level, or at least it would’ve moved visibly above its Augustlows in terms of the closing prices.Silver would have invalidatedits breakdown below the rising support line, instead of verifying it asresistance.Gold miners (represented by the HUIIndex in the middle of the above chart) would have shown strengthrelative to gold. For instance, they would not have declined yesterday morethan gold or GLD ETF did.Today, it’s evident that nothing from theabove happened. And why is that? Because the medium-term trend changed inAugust and what we see now is just the early part of the decline. It seems thatthe noticeable pause after this decline is close to being over. But why? We’llget to that shortly. In the meantime, let’s take a look at the general stockmarket performance.
The S&P 500 Index chart is second fromthe bottom and based on yesterday’s profound reversal. Stocks failed to rallyback above the early-2020 highs. This is important evidence in determining theprecious metals sector’s performance, particularly in the case of mining stocksand silver.
The correlationalvalues in the rows that show the links between various parts of the preciousmetals market and the S&P 500 Index indicate that these links are indeedpositive. However, it is only in the mining stocks that this link remainsstrongly positive in every examined period (ranging from 10 to 1500 tradingdays). As far as medium-term moves are concerned, the S&P 500 and silverconnection is stronger than the one between S&P500 and gold.
Stocks failed to rally back above theearly-2020 high, and therefore, in my view, they are quite likely to movelower, which would be in tune with the worsening pandemic situation.
Thus, the implication for the next severalweeks remains quite bearish. Let’s get back to the previous question – why dowe think that the current pause within the decline is over.
In short, it’s because that’s what thetriangle-vertex-based-reversal technique is currently suggesting, and it wasable to pinpoint the last three short-term reversals very well. In short,whenever support and resistance lines cross, there’s likely to be some type ofreversal. But does it work? Of course, not all the time, but in general - youcan bet it does. Please take a look at the chart below for details.
Theshort-term triangle-vertex-based reversals were quite useful in timing the final moments of the givenshort-term moves in the past few weeks. Please keep in mind that the earlyand late September lows developed when the support and resistance lines were crossed.
Now,this technique might not work on aprecise basis, but rather on a near-to basis, and given the highly politicalcharacter of the current month (before the U.S. presidential elections), thingsmight move in a somewhat chaotic manner. In previous months and years, this techniqueworked multiple times, and it has worked recently as well.
Based onyesterday’s decline, it seems that the early-October reversal point did markthe end of the rally. To be precise, gold did move slightly higher after thattime, but the vast majority of the upswing was over at that time, and it wasthe “pennies to the upside, dollars to the downside” kind of situation.
Sincethis technique was so useful recently, and since we already saw a sizabledownswing yesterday, it seems that the corrective rally is already over.
Otherthan that, instead of being strong, mining stocks declined profoundlyyesterday.
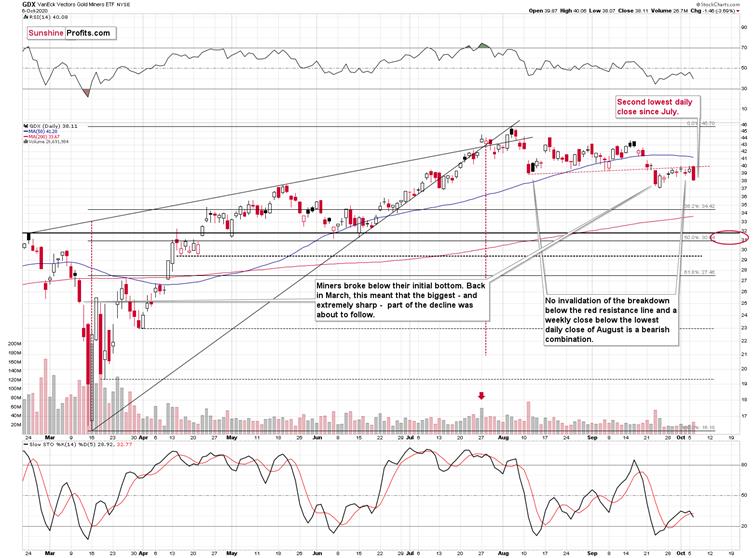
The GDXETF – the flagship ETF for the precious metals mining stocks – closed at thesecond-lowest levels since July. That’s now how a medium-term rally looks like.That’s how a post-breakdown decline looks like.
Insteadof rallying, miners simply corrected to the previously broken rising redsupport line, and they verified it as resistance. Since miners have alreadytaken a breather, they appear ready to fall further.Thank you for reading our free analysis today.Please note that the following is just a small fraction of today’sall-encompassing Gold & Silver Trading Alert. The latter includes multiplepremium details such as the interimtarget for gold that could be reached in the next few weeks.
If you’d like to read those premiumdetails, we have good news for you. As soon as you sign up for our free goldnewsletter, you’ll get a free 7-day no-obligation trial access to our premiumGold & Silver Trading Alerts. It’s really free – sign up today.
Thank you.
Przemyslaw Radomski, CFA
Founder, Editor-in-chief
Toolsfor Effective Gold & Silver Investments - SunshineProfits.com
Tools für EffektivesGold- und Silber-Investment - SunshineProfits.DE
* * * * *
About Sunshine Profits
SunshineProfits enables anyone to forecast market changes with a level of accuracy thatwas once only available to closed-door institutions. It provides free trialaccess to its best investment tools (including lists of best gold stocks and best silver stocks),proprietary gold & silver indicators, buy & sell signals, weekly newsletter, and more. Seeing is believing.
Disclaimer
All essays, research and information found aboverepresent analyses and opinions of Przemyslaw Radomski, CFA and SunshineProfits' associates only. As such, it may prove wrong and be a subject tochange without notice. Opinions and analyses were based on data available toauthors of respective essays at the time of writing. Although the informationprovided above is based on careful research and sources that are believed to beaccurate, Przemyslaw Radomski, CFA and his associates do not guarantee theaccuracy or thoroughness of the data or information reported. The opinionspublished above are neither an offer nor a recommendation to purchase or sell anysecurities. Mr. Radomski is not a Registered Securities Advisor. By readingPrzemyslaw Radomski's, CFA reports you fully agree that he will not be heldresponsible or liable for any decisions you make regarding any informationprovided in these reports. Investing, trading and speculation in any financialmarkets may involve high risk of loss. Przemyslaw Radomski, CFA, SunshineProfits' employees and affiliates as well as members of their families may havea short or long position in any securities, including those mentioned in any ofthe reports or essays, and may make additional purchases and/or sales of thosesecurities without notice.
Przemyslaw Radomski Archive |
© 2005-2019 http://www.MarketOracle.co.uk - The Market Oracle is a FREE Daily Financial Markets Analysis & Forecasting online publication.