Gold Miners' Strength - What If It Isn't Just a Bluff? / Commodities / Gold and Silver Stocks 2019

 Thestock market took a dive, and gold with silver barely moved higher. Miners hadlittle reason to rally, especially that they have been underperforming gold formany days now. And yet, gold stocks and silver stocks moved visibly higher.What if it isn’t just a bluff? What if it’s the first sign that the near-termbottom is already in?
Well,if this is the case, then the upside for the miners is very limited.
GoldStocks and the PMs Perspective
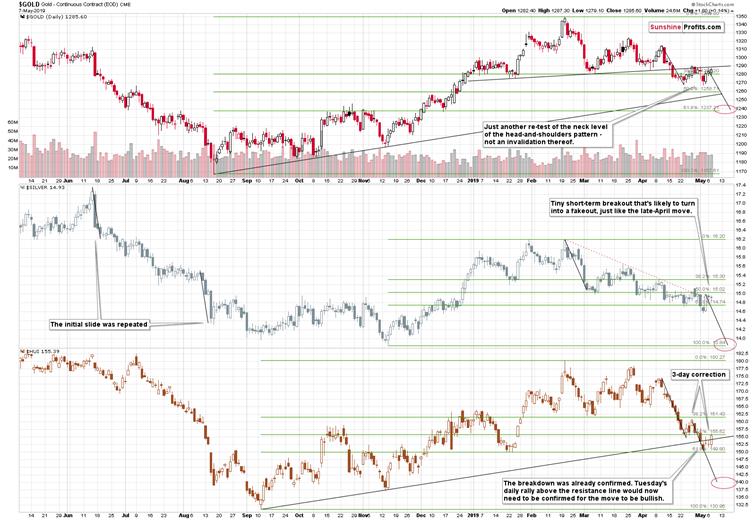
Goldstocks (at the very bottom on the above chart) might move to the late-Aprilhighs, the 38.2% Fibonacci retracement, or the early January highs, which wouldmake the current upswing symmetrical to the early-January decline. As far asthe latter is concerned, it might be likely (assuming that miners would movehigher from here at all) as the miners have already proved to form suchsymmetrical patterns in the past. For instance, the early-November 2018 rallyand top, was symmetrical to the early-October action. All the above points toapproximately 162.5 as the possibleupside target. “Possible” doesn’t mean “likely”, though.
However,the question in the title is a little biased, because it makes the additionalupswing seem more likely than it actually is. The correct question would be if yesterday’s upswing has actuallychanged anything. And the quick reply, is that it opened the door for possible bullish signs today and in thefollowing days but that it was not yet one on its own.
Thereasons are present in the surrounding markets (most notably in gold and theUSD Index) and in the mining stock themselves. Yes, the mining stocks movedhigher, but they already reached an important short-term resistance yesterday.Miners moved to the April low, thus verifying the breakdown below it. Moreover,the move higher that followed the April low took exactly 3 trading days and themost visible part of the decline took place on the third day. Exactly the samething happened once again. And what followed next in the previous case? Theminers declined and their underperformance came back with vengeance.
Yes,the HUI Index moved above the rising resistance line, but:
Ithas done so after already confirming the breakdown below this line, which makesthe current move suspicious to say the least. Therewas no analogous move in the GDX ETF or the XAUIndex.Consequently,we are not making much of yesterday’s move just yet. If the miners are trulystrong, they will show this strong performance in the following days as well.For now, it seems that yesterday’s move was either accidental, or that it wasactually the case of miners providing a fake signal just before the turnaround.You know, the same thing happened in 2012.
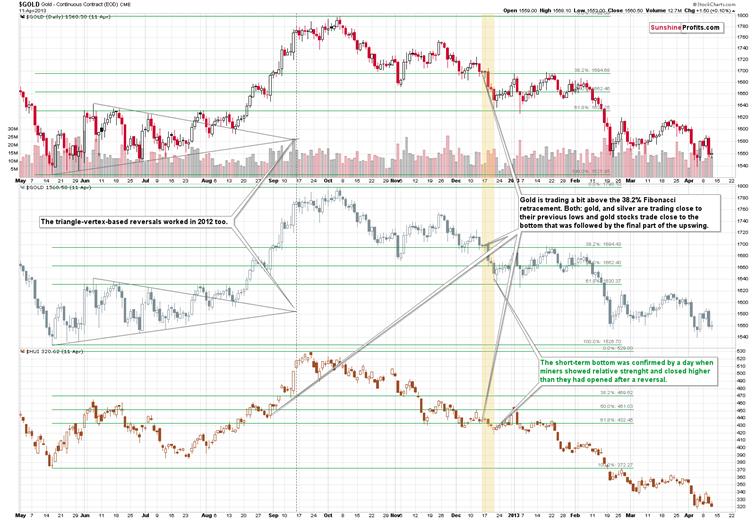
OnDecember 12, 2012, the gold miningstock index soared for a day only to disappoint and decline in the following days. And itwas during the part of the decline that is similar to what we see in theprecious metals market right now.
So,we now have both: long-term similarity and very short-term analogy to thelate-April 2019 upswing that suggest that yesterday’s upswing was not a sign ofstrength, but rather something bearish.
Entergold.
Theyellow metal is still below the neck level of the head-and-shoulders pattern,which means that it’s about to slide any day now. This formation has beenconfirmed in terms of time and by 2 verifications of the breakdown below theneck level. Gold moved back to this level without breaking higher. The necklevel is proving to be a solid resistance, just like it should.
Thisis exactly the situation where one better be very suspicious of any signs thatare bullish at first sight, including mining stocks’ rally. Given the bearish forecastfor gold price, it’s very likely that the entire precious metalssector will shortly move lower, not higher. Mining stocks’ rally was therefore much more likely a bluff thananything more.
Let’srecall our recent Alert about thepowerful analogies to the 2012-2013 decline and their confirmations. Here’s anotherinspiration when looking for theshort-term signs of the upcoming PMs moves. It was the finalpart of our three-part series providing a 360 degree look at the PMs marketthat our subscribers enjoy daily: here the links to Part I and PartII.
Thelikely impact of the USD Index is also something that’s worth keeping in mind.
Checkingon the USD Index
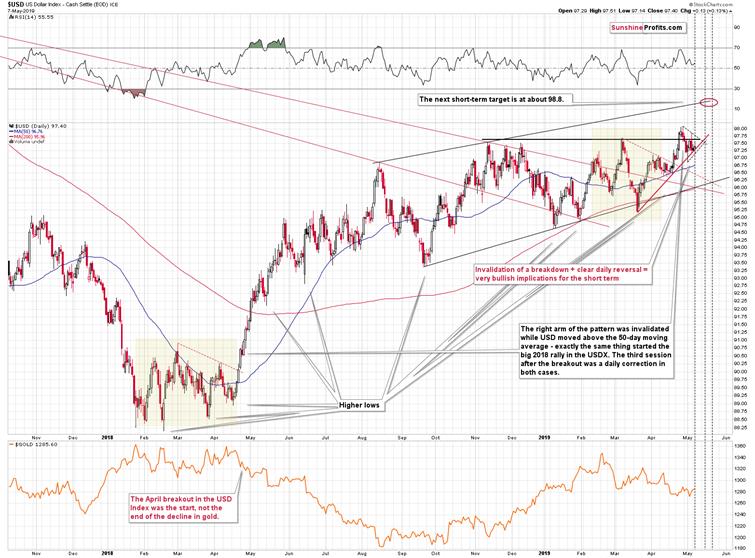
TheUS currency is trading very close to this and last year’s highs and it seemsready to finally break above them. Why should it be successful this time?Naturally, there is no certainty here, but the simple fact that we saw higherlows for so many months suggests that the accumulated bullish pressure isenormous. Like in a coiled spring.
Formonths, the USD Index wanted to rally, but every time it moved to or above 97,it was hammered down. But it recovered each time. And each time it was strongerthan before. That’s what the higher lows actually mean – more buying power andless selling pressure that has is reflected in the bottoms being formedincrementally higher.
Eventhe late-March dovish surprise from the Fed wasn’t able to break the abovepattern. Yes, the USD Index declined as it was practically forced to, but sinceit really wanted to move higher, it recovered and rallied back up. In fact,about a month later, it temporarily moved to new medium-term highs.
Thisbreakout was invalidated but unlike what we saw in March, the USDX didn’t justkeep on declining. It formed a big bullish daily reversal at the risingshort-term support line, and it managed to stay above this line ever since. Infact, it’s trading at it right now.
Allthis makes it likely that the USD Index will finally manage to break above the2018 highs and to confirm this breakout. And what happens next? The enormousbullish pressure that has been building for months, will unfold and the USDXwould likely soar – perhaps as sharply as it did in April and May last year.
Andwhat if it doesn’t? Then we’d probably have another higher low and then thebreakout to new highs. The action in the USDX that followed Fed’s dovishcomments in March shows that it’s much more likely that we will not have towait long for the USD’s breakout. The implications for the precious metalsmarket are bearish.
Isthis a situation, where a daily rally in the miners would make things bullishfor the entire PM sector? No.
GoldOptions’ Expiration
Beforesummarizing, we would like to address a request that we received from oursubscriber. One question is about the implications of the upcoming gold options’ expirations:
My theory- the significant dropin price of both gold and silver will occur during the 30 days after the May 17option expiration and both metals will see a price rebound prior to the June 21option expiration. This is based on the current volume of put/call options atcertain prices in the May 17 and June 21 contracts. Your comments areappreciated.
Inour opinion, this might very well be the case, but it doesn’t have to be so.There are certain days or news releases after which the uncertainty is removedfrom the market (temporarily, but still) to a considerable extent. Before thesedays, the investors kind of “hold their breath” waiting what happens and onlyafter the given day, or announcement, can the markets resume their previoustrends (or change them at least for some time, if the news is significantenough). This mechanism is quite powerful, and it often dwarfs the logicalimplication of the news that is being announced. “Buy the rumor, sell the news”is quite often what happens. Remember how everyone thought that silver will go“todamoon” after the first silver ETF (SLV) starts trading? Silver indeedrallied, but only before the launch – after the ETF started operating, silverplunged.
Thesecrucial moments can be based on news announcements, like the above-mentionedcase with the SLV ETF. They can be based on technical formations or on cyclicalturning points. And they can be based on derivatives’ expiration dates. It’s nosecret that when there’s a lot of volume and open interest in the derivativeproducts (futures and options), weird price moves tend to take place. Quick Internet search for “triple witching”or “quad witching” will prove it. In short, there are big tensions on themarket close to the expiration date, because both sides of the contract want topush the underlying asset in their favorable direction.
Thereare actually two effects in play: one that’s exactly as outlined above, and thesecond is that people expect things to get weird around option expirationdates, and thus that they may choose to havea nice cold pint and wait for all this to blow over.
Botheffects could mean that the decline in the gold price is delayed for another9-10 days. “Could mean” doesn’t mean that it “will mean” it. There are alsoother factors, investors might be waiting for that will actually trigger thedecline. And – let’s not forget what the ultimatetrigger for gold is (we just posted the above article, please clickthe above link for more details or navigate to the Gold News section underServices & Products menu on our website).
Anotherthing that could make the markets move right away is the triangle-vertex-based reversal in the USDIndex. There are three nearby reversals of this kind and one of them wasyesterday. The other ones are on May 15th and May 21st. This suggests that theUSD Index is likely to move right away and then form reversals on the abovedates. The first of the dates is very close to the May 17th expiration date, soit might be the case that we’ll see a reversal at that time. However, given thecurrent reversal, it might be the case that the USDX actually soars right awayand forms a temporary top at that time. In this case, gold would slide now, andform a temporary bottom next week.
What’sthe takeaway? That while the exactday-to-day structure of the decline is not crystal clear, it might be better tofocus on what is very clear. And that is gold’s likelihood to decline atall. It’s better to be prepared for the very likely outcome, while acceptingsome kind of uncertainty on a day-to-day basis. Our take on this situation is atactical one. We’ll position ourselves where it appears that we have the edge,without exposing ourselves (for instance by staying on the sidelines now,aiming to enter on the day when the slide starts) to the risk of missing theopportunity. In other words, it seems best to keep the short positions intact.
Summary
Summingup, the link to the 2012-2013 decline continues to support much lower prices inthe following months, weeks, and – likely – days. Just as one swallow doesn’tmake a summer, one day of strength in the mining stocks doesn’t change theoverall trend of underperformance. Don’t let this short-term back-and-forthtrading fool you. Based on the confirmed head-and-shoulders top in gold, thebuilding pressure in the USD Index, and the analogy to the way the preciousmetals market declined in 2012 and 2013, the next short-term bottom might bereached as early as this or the next week – in a volatile manner. This upcomingbottom might be a good opportunity to go long, but we are definitely not inthis kind of situation right now. Conversely, in our view, short positions in thePMs are likely to generate sizable profits, just like the ones in forexand crude oil just did.
Today’sarticle is a small sample of what our subscribers enjoy regularly. Superior andtimely analysis is an essential ingredient of success. To keep informed of boththe market changes and our trading position changes exactly when they happen,we invite you to subscribeto our Gold & Silver Trading Alerts today.
Thank you.
Przemyslaw Radomski, CFA
Founder, Editor-in-chief
Toolsfor Effective Gold & Silver Investments - SunshineProfits.com
Tools für EffektivesGold- und Silber-Investment - SunshineProfits.DE
* * * * *
About Sunshine Profits
SunshineProfits enables anyone to forecast market changes with a level of accuracy thatwas once only available to closed-door institutions. It provides free trialaccess to its best investment tools (including lists of best gold stocks and best silver stocks),proprietary gold & silver indicators, buy & sell signals, weekly newsletter, and more. Seeing is believing.
Disclaimer
All essays, research and information found aboverepresent analyses and opinions of Przemyslaw Radomski, CFA and SunshineProfits' associates only. As such, it may prove wrong and be a subject tochange without notice. Opinions and analyses were based on data available toauthors of respective essays at the time of writing. Although the informationprovided above is based on careful research and sources that are believed to beaccurate, Przemyslaw Radomski, CFA and his associates do not guarantee theaccuracy or thoroughness of the data or information reported. The opinionspublished above are neither an offer nor a recommendation to purchase or sell anysecurities. Mr. Radomski is not a Registered Securities Advisor. By readingPrzemyslaw Radomski's, CFA reports you fully agree that he will not be heldresponsible or liable for any decisions you make regarding any informationprovided in these reports. Investing, trading and speculation in any financialmarkets may involve high risk of loss. Przemyslaw Radomski, CFA, SunshineProfits' employees and affiliates as well as members of their families may havea short or long position in any securities, including those mentioned in any ofthe reports or essays, and may make additional purchases and/or sales of thosesecurities without notice.
Przemyslaw Radomski Archive |
© 2005-2019 http://www.MarketOracle.co.uk - The Market Oracle is a FREE Daily Financial Markets Analysis & Forecasting online publication.