Gold Mining ETFs: Headed for Their Next Slide? / Commodities / Gold and Silver Stocks 2021

The mining ETFs (the GDX and GDXJ) have hitresistance and look tired. After their corrective rally, a slide lookspromising.
The miners are done correcting and if theywere at a water amusement park, would they head for the lazy river? How aboutthe wave pool? Nah… they’d be headed straight for the slides.
If you’ve been waiting for a high-qualitysign that the next big move in the precious metals sector is underway – youjust got it.
There are days on the markets whennothing happens, there are days when what happens is visible only to some ( likeMonday’s session ), and there are days when the market’s signals arecrystal-clear – as if the charts were practically screaming at the personexamining them. Yesterday, was one of the latter kind of days.
Without further ado, let’s take a look atthe key development that we just saw in the precious metals’ world – the bigdecline in the GDX ETF – proxy for mining stocks.
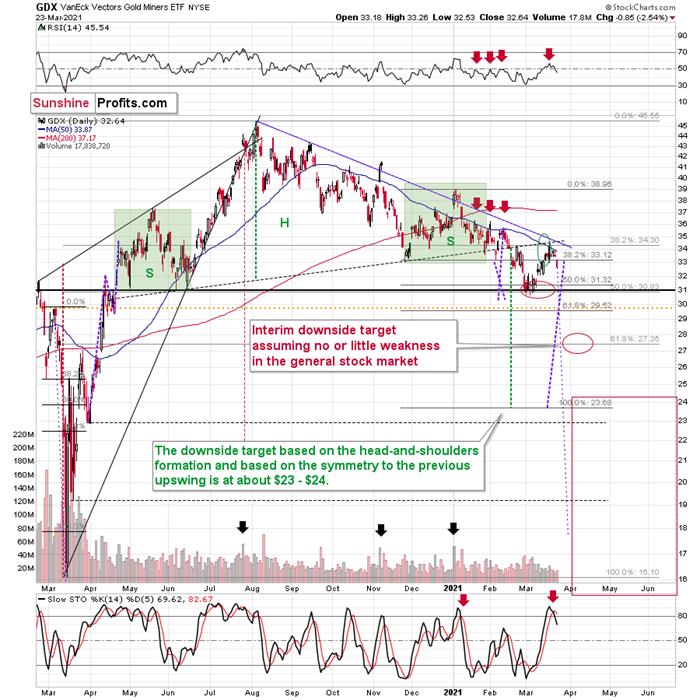
After the tiny breakdown that I describedyesterday (Mar. 24), the GDX ETF declined significantly, and it even opened thesession with a price gap. If you look at the left side of the chart, you’ll seethat this is the way in which the big January decline started. In the next 2months, the value of the GDX ETF declined by over $8.
But is the corrective upswing reallyover? Did the move higher end at a price level that was likely to stop it? Yes,definitely so.
OnMarch 10 (when we were already long), I wrote the following :
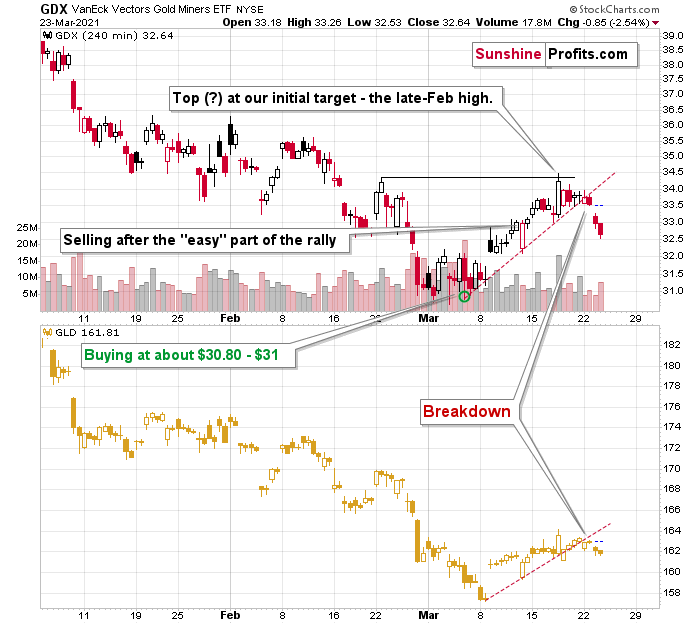
Eventhough gold moved lower in early March, gold miners stopped declining afterreaching my target area based several techniques – most importantly the 50%Fibonacci retracement based on the entire 2020 rally, and the previous lows andhighs. Just as miners’ relative weakness had previously heralded declines forthe entire precious metals sector, their strength meant that a rally was aboutto start. And that’s just what we saw yesterday (Mar. 9).
Ultimately, it seems thatthe above corrections will result in the GDX ETF moving to about $34 or so.
Theresistance levels in the $34 - $35 area are provided by:The late-February 2020 highThe rising neck level of the previously completed head and shoulderspatternThe analogy to how big miners’ correction was in April (assumingthat the mirror similarity continues)The declining blue resistance lineThe 50-day moving average
Consequently, it makes sense for theGDX ETF to slide form here, as the corrective rally that was likely to takeplace is most likely already over.
The clearly visible sell signal from thestochastic indicator (lower part of the chart) confirms the above as well.
Having said that, let’s take a look ateven bigger decline in the GDXJ ETF – proxy for junior mining stocks.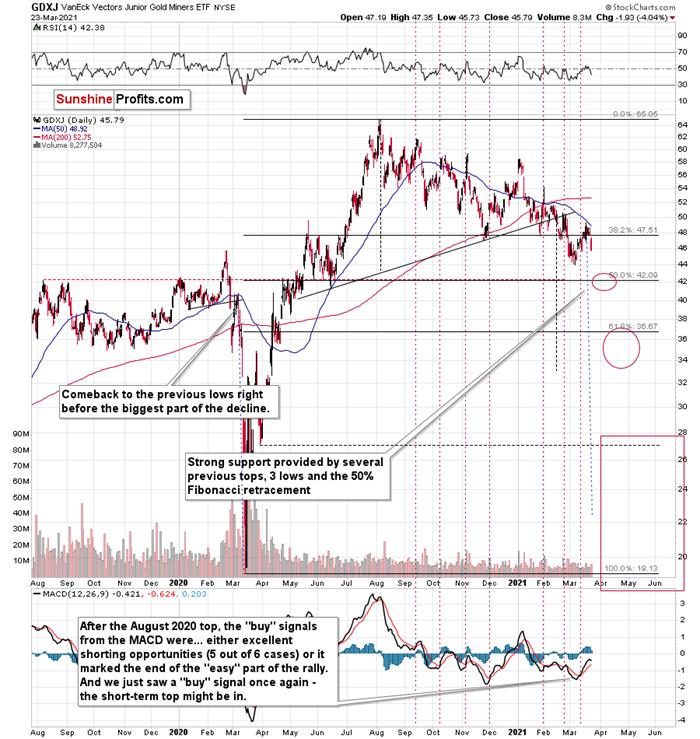
While senior gold miners declined 2.54%yesterday, junior miners declined by 4.04%.
The remarkable thing about both declinesis that they took place almost without gold’s help. GLD ended yesterday’ssession just 0.73% lower. The general stock market – another market that couldtemporarily impact the prices of mining stocks – declined by 0.76% yesterday.
In comparison, the declines that we sawin both proxiesfor mining stocks were huge. This isvery important , because the recent declines in the precious metals sectorand the recent rallies in the precious metals sector were preceded by –respectively – the relative weakness of miners compared to gold and therelative strength of miners compared to gold.
What we saw yesterday is a crystal-clearsign that the waiting for the next big move lower is over.
This month’s “buy” signal from the MACDindicator seems to have once again marked a great shorting opportunity. OnMarch 12 , I wrote the following:
Theabove chart is a big red warning flag for beginnerinvestors . The flag reads:“verify the efficiency of a given tool on a given market, before applying it”.
Thebottom part of the above chart features theMACD indicator . Normally, when the indicator line (black) crosses its signal line(red), we have a signal. If it’s moves above the signal line, it’s a buy sign,and if it moves below it, it’s a sell sign.
But.
Ifone actually looks at what happened after the previous “buy signals” in therecent months, they will see that in 5 out of 6 cases, these “buy signals”practically marked the exact tops, thus being very effective sell signals! Inthe remaining case, it was a good indication that the easy part of thecorrective upswing was over.
I’mnot only describing the above due to its educational value, but because we actually saw a “buy signal” from the MACD, which was quitelikely really a sell signal.
I recently added that the MACD indicatoris far from a light switch. While false buy signals often precede materialdrawdowns, the reversals don’t occur overnight. As a result, it’s perfectlynormal for the GDXJ ETF to trade sideways or slightly higher for a few daysbefore moving lower. This is what we saw last week.
And yesterday, we saw the 4%+ dailyslide, which means that everyone who shorted the market based on the MACD’s“buy” signal is already profitable.
Once again – please remember to checkwhether a given technique or indicator actually worked for your favorite marketbefore applying it and entering a trade.
Another market that appears to confirmthe bearish narrative is silver.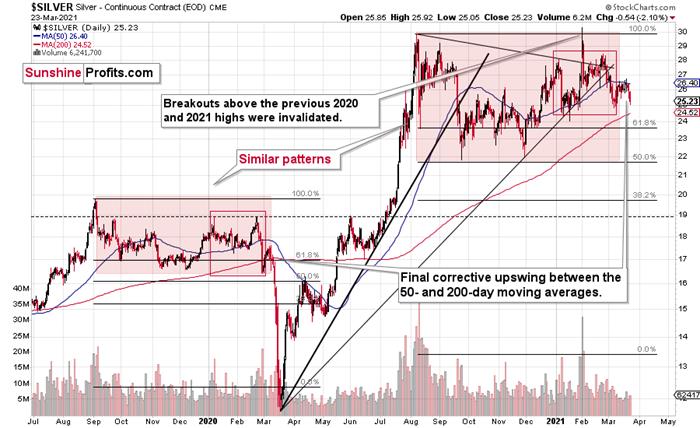
Silvermoved lower in a more visible manner, which might be surprising to someinvestors (especially those that went long based on the “ silver short squeeze ” movement almost two months ago), but it’snot surprising to me. If the history repeats itself to a considerable degree,then it’s not odd to see the same kind of performance that we saw in thesimilar stage of a given price move.
Inthis case, I already discussed the self-similarity present in the silvermarket, and I marked the similar patterns with red rectangles. The currentsituation seems similar to early March 2020, when silver was just starting amajor decline while being between its 50- and 200-day moving average. Let’skeep in mind that gold actually moved to a new high in early March, and silverwas very far from doing so. Back then, silver underperformed, so it’s no wonderthat it’s underperforming right now. While the silver shortage was the topic of the day for many days about two months ago, it seemsthat more bearish headlines will soon be more popular.
Please note that a move below ~$24 insilver will imply that everyone who bought in late January or February, whensilver was particularly popular is already in the red. As silver then moveseven lower, those investors will most likely feel significant emotionalpressure to sell – and some will, most likely making the decline bigger andsharper.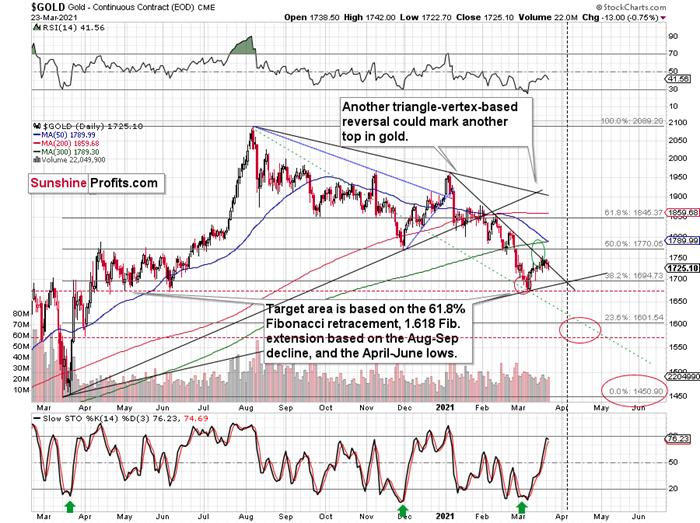
Gold seems to have topped in the lowerpart of my target area and the levels reached by its price as well as thelevels reached by the stochastic indicator seem to indicate that the top isindeed in.
Gold reversed after failing to breakabove the declining short-term resistance line, relatively close to its triangle-vertex-basedreversal , which is a bearish combination. The stochastic (lower part of the chart) didn’t moveto the 80 level, but it was very close to it and it was the proximity of thislevel that was enough for the tops to form in quite a few previous cases –including the November 2020 top. Based on yesterday’s closing price, we didn’tsee a sell signal in this indicator yet, but once we see just a little moreweakness, we’ll get this confirmation. Based on what we saw in mining stocksyesterday, it seems that we’ll see it shortly.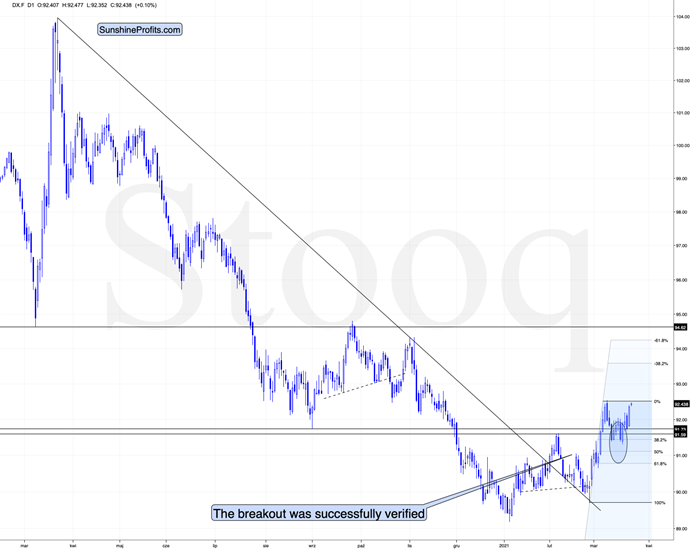
Right now, traders are likely taking thewait-and-see approach with regard to the USD Index. The latter just moved toits previous yearly highs. It’s already after verification of the breakoutabove the February highs, so it seems that it’s ready to break higher any day –or hour – now. When that happens, I expect the rally to take the USDX to atleast 94, perhaps to 94.5 or 95. The September 2020 high is 94.8, so this levelis the most likely upside target for the short term. I don’t think that therally in the USD Index would end once it reaches the proximity of 95, butthat’s when we might see another breather (perhaps after a breakout above thislevel and perhaps before the breakout, it’s too early to tell at this time).
All in all, it seems that the next movelower in the precious metals market is already underway and that we’re going tosee new 2021 lows in gold and mining stocks in the next several weeks or days.
Thankyou for reading the above free analysis. It’s part of today’s extensive Gold& Silver Trading Alert. We encourage you to sign up for our free goldnewsletter – as soon as you do, you'll get 7 days of free access to our premiumdaily Gold & Silver Trading Alerts and you can read the full version of theabove analysis right away. Signup for our free gold newsletter today!
Thank you.
Przemyslaw Radomski, CFA
Founder, Editor-in-chief
Toolsfor Effective Gold & Silver Investments - SunshineProfits.com
Tools für EffektivesGold- und Silber-Investment - SunshineProfits.DE
* * * * *
About Sunshine Profits
SunshineProfits enables anyone to forecast market changes with a level of accuracy thatwas once only available to closed-door institutions. It provides free trialaccess to its best investment tools (including lists of best gold stocks and best silver stocks),proprietary gold & silver indicators, buy & sell signals, weekly newsletter, and more. Seeing is believing.
Disclaimer
All essays, research and information found aboverepresent analyses and opinions of Przemyslaw Radomski, CFA and SunshineProfits' associates only. As such, it may prove wrong and be a subject tochange without notice. Opinions and analyses were based on data available toauthors of respective essays at the time of writing. Although the informationprovided above is based on careful research and sources that are believed to beaccurate, Przemyslaw Radomski, CFA and his associates do not guarantee theaccuracy or thoroughness of the data or information reported. The opinionspublished above are neither an offer nor a recommendation to purchase or sell anysecurities. Mr. Radomski is not a Registered Securities Advisor. By readingPrzemyslaw Radomski's, CFA reports you fully agree that he will not be heldresponsible or liable for any decisions you make regarding any informationprovided in these reports. Investing, trading and speculation in any financialmarkets may involve high risk of loss. Przemyslaw Radomski, CFA, SunshineProfits' employees and affiliates as well as members of their families may havea short or long position in any securities, including those mentioned in any ofthe reports or essays, and may make additional purchases and/or sales of thosesecurities without notice.
Przemyslaw Radomski Archive |
© 2005-2019 http://www.MarketOracle.co.uk - The Market Oracle is a FREE Daily Financial Markets Analysis & Forecasting online publication.