Gold Mining Stock: Were Upswings Just an Exhausting Sprint? / Commodities / Gold and Silver Stocks 2021

Indicators are pointing to gold andmining ETFs running out of breath. They don’t seem to have what it takes to themove to the finish line.
Despite gold, silver and mining stocks’recent corrective upswings, the precious metals are running out of steam. Afterbursting off of the lows – while failing to recognize that it’s a marathon andnot a sprint – the precious metals’ late-week breather signals that theirstamina isn’t what it used to be.
Moreover, with false breakouts andsanguine sentiment causing an adrenaline rush that’s likely to fade, theprecious metals’ transformation from stalwart to sloth could leave investorsfeeling increasingly dejected.
Case in point: with the HUIIndex (a proxyfor gold mining stocks ) already verifying the breakdown below the necklineof its bearish H&Spattern – which didn’t occur until later in 2008 – the miners’ outlook isactually more bearish now than it was then.
Please see below:
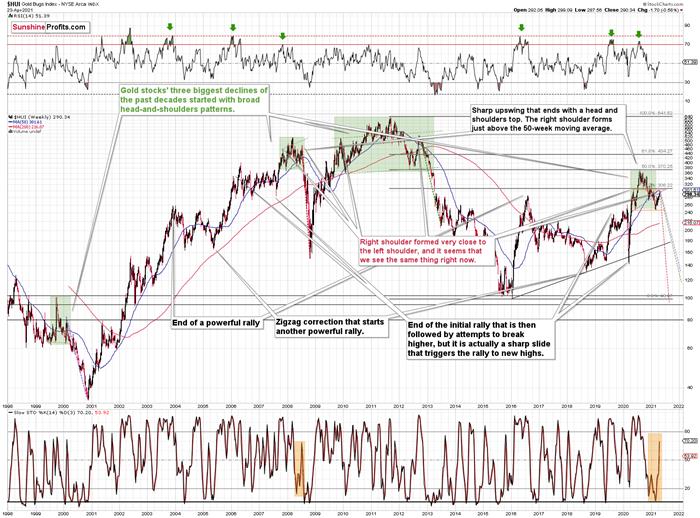
To explain, note that the 2007 – 2008 andthe 2009 – 2012 head and shoulders patterns didn’t have the right shoulders allthe way up to the line that was parallel to the line connecting the bottoms. Imarked those lines with green in the above-mentioned formations. In the currentcase, I marked those lines with orange. Now, in both cases, the final top – the right shoulder – formedclose to the price where the left shoulder topped. And in early 2020, the leftshoulder topped at 303.02.
That’s why Ipreviously wrote that “it wouldn’t be surprising to see a move to about 300in the HUI Index”. And that’s exactly what we saw – the recent high wasslightly above 299.
Thismeans that the recent rally is not a game-changer, but rather a part of a long-term pattern that’s notvisible when one focuses on the short-term only.
Thething is that the vast majority of individual investors and – sadly – quitemany analysts focus on the trees while forgetting about the forest. During thewalk, this might result in getting lost, and the implications are no differentin the investment landscape.
Fromthe day-to-day perspective, a weekly – let alone monthly – rally seems like ahuge deal. However, once one zooms out and looks at the situation from a broadperspective, it’s clear that:
“Whathas been will be again, what has been done will be done again; there is nothingnew under the sun.” (-Ecclesiastes 1:9)
Therally is very likely the right shoulder of a broad head and shouldersformation. “Very likely” and not “certainly”, because the HUI Index needs to break to new yearly lowsin order to complete the pattern – for now, it’s just potential. However,given the situation in the USD Index (i.a. the positions of futures traders asseen in the CoT report , and the technical situation in it), it seems very likely that thisformation will indeed be completed. Especially when (not if) the general stockmarket tumbles.
Inaddition, three of the biggest declines in the mining stocks (I’m using the HUIIndex as a proxy here), all started with broad, multi-month head-and-shoulderspatterns. And in all three cases, the size of the decline exceeded the size ofthe head of the pattern.
Canwe see gold stocks as low as we saw them last year? Yes.
Canwe see gold stocks even lower than at their 2020 lows? Again, yes.
Ofcourse, it’s far from being a sure bet, but the above chart shows that it’s notirrational to expect these kind of price levels before the final bottom isreached. This means that a $24 target on the GDX ETF is likely conservative.
Inaddition, mining stocks are currently flirting with two bearish scenarios:If things develop as they did in 2000 and 2012-2013, gold stocks arelikely to bottom close to their early 2020 high.If things develop like in 2008 (which might be the case, given theextremely high participation of the investment public in the stock market andother markets), gold stocks could re-test (or break slightly below) their 2016low.
Iknow, I know, this seems too unreal to be true… But wasn’t the same said aboutsilver moving below its 2015 bottom in 2020? And yet, it happened.
Keepin mind though: scenario #2 most likely requires equities to participate. In 2008 and 2020, the sharp drawdowns in the HUI Indexcoincided with significant drawdowns of the S&P 500 . However, with the words ‘all-time high’ becoming commonplace acrossU.S. equities, the likelihood of a three-peat remains relatively high.
SeniorMiners: GDX ETF
Moving on to the GDX ETF, the seniorminers were unable to hold the upper trendline of their corrective zigzagpattern. Similar to the price action in late 2020/early 2021, the GDX ETFrallied slightly above the upper trendline of its roughly one-and-a-half-monthchannel before eventually rolling over. More importantly, though, the GDX ETF’sfailure in early 2021 ended up being a prelude to the senior miners’ severedrawdown.
Please see below: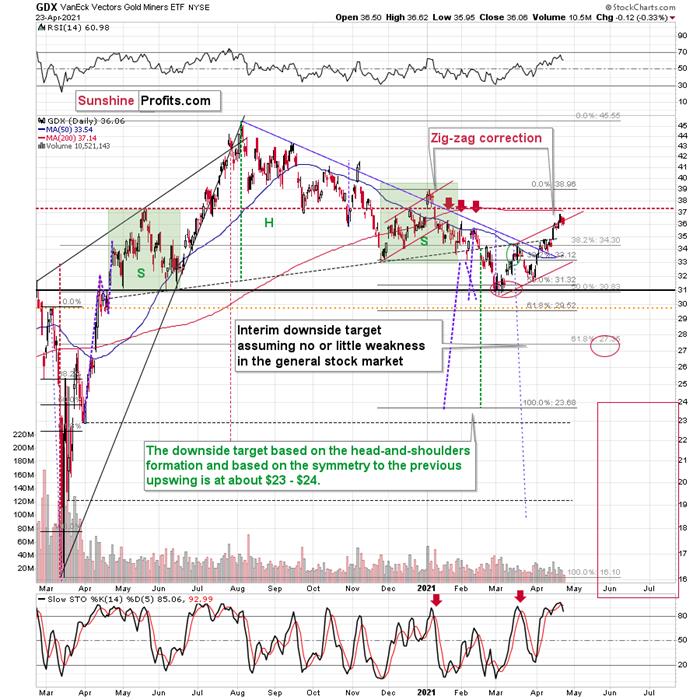
Furthermore, with the senior minerslikely to peak in the coming days, the GDX ETF is poised to move from the rightshoulder of its bearish H&S pattern. Following in the HUI Index’sfootsteps, the GDX ETF’s correction back to the high of its left shouldersignals that the upward momentum has likely run its course.
If that wasn’t enough, the GDX ETF’sstochastic oscillator is also flashing a clear sell signal. If you analyze thetwo red arrows positioned at the bottom of the chart above, you can see thatthe black line has once again crossed the red line from above. As a result, theGDX ETF’s days are likely numbered.
JuniorMiners: GDXJ ETF
As further evidence on this bearishscenario, let’s take a look at other proxies for the mining stocks. Whenanalyzed through the lens of the GDXJ ETF, the juniorminers remain significant underperformers.
Please see below: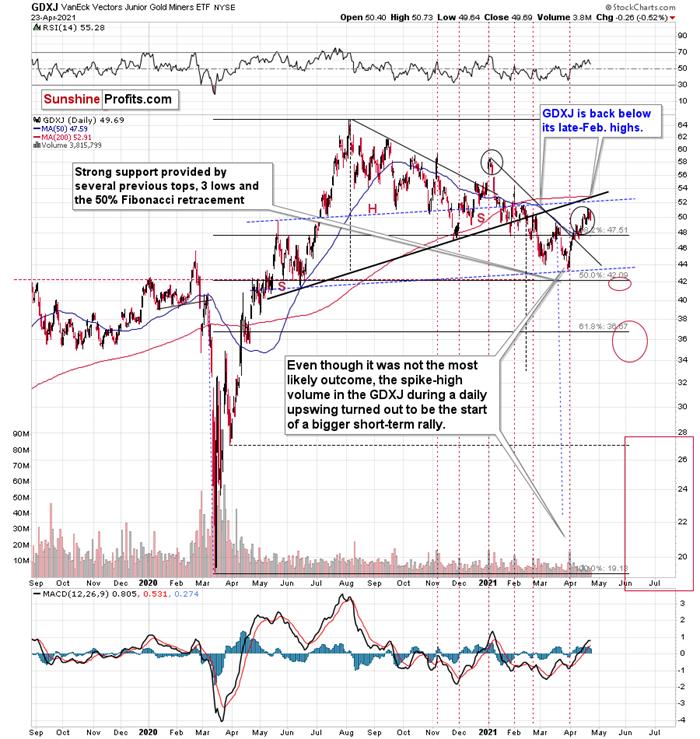
To explain, the GDXJ ETF is now backbelow its late-Feb. highs - please note how weak it remains relative to otherproxies for mining stocks. Unlike the HUI or the GDX, the GDXJ didn’t movevisibly above its late-Feb. highs and it had already invalidated this smallbreakout.
Moreover, the GDXJ/GDX ratio has beendeclining since the beginning of the year, which is remarkable because thegeneral stock market hasn’t plunged yet. This tells us that when stocks finallyslide, the ratio is likely to decline in a truly profound manner – perhapssimilarly to what we saw last year.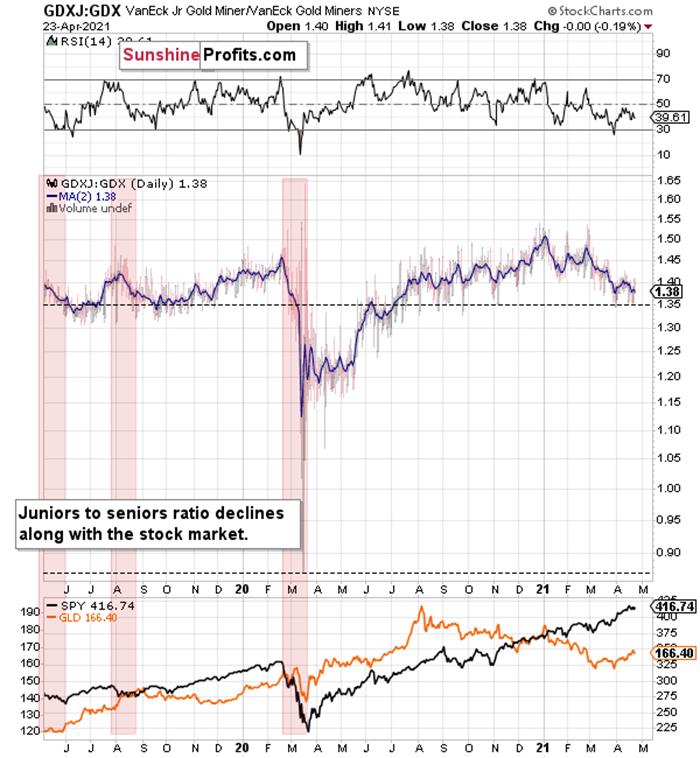
So, how low could the GDXJ ETF go?
Well, absent an equity rout, the juniorscould form an interim bottom in the $34 to $36 range. Conversely, if stocksshow strength, juniors could form the interim bottom higher, close to the $42.5 level. For context, the above-mentionedranges coincide with the 50% and 61.8% Fibonacci retracement levels and theGDXJ ETF’s previous highs (including the late-March/early-April high in case ofthe lower target area). Thus, the S&P 500 will likely need to roll over forthe weakness to persist beyond these levels.
Also, contrasting the GDX ETF’s falsebreakout, both the HUI and the XAUindices ended the week below the necklines of their previous (based on therising necklines) bearish H&S patterns. Moreover, if you analyze the rightside of the charts below, while both the HUI and XAU indices initially bouncedabove their necklines, investors quickly sold the rallies.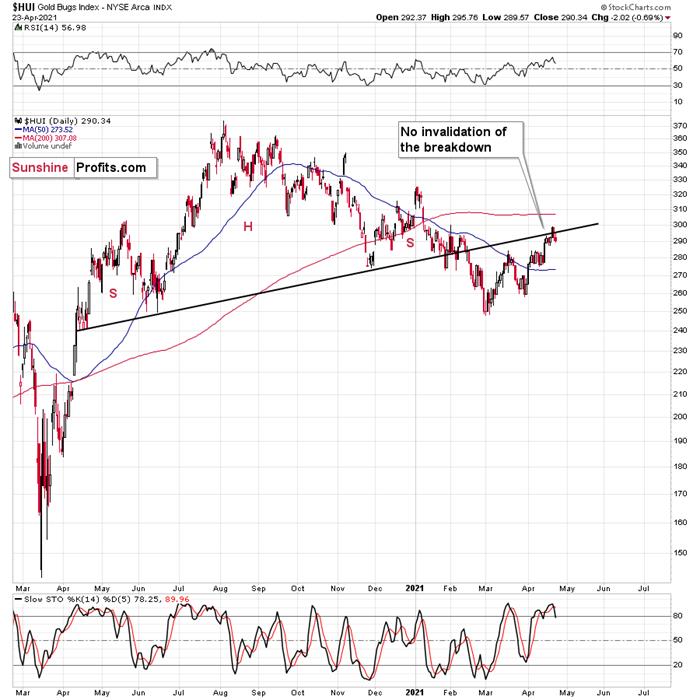
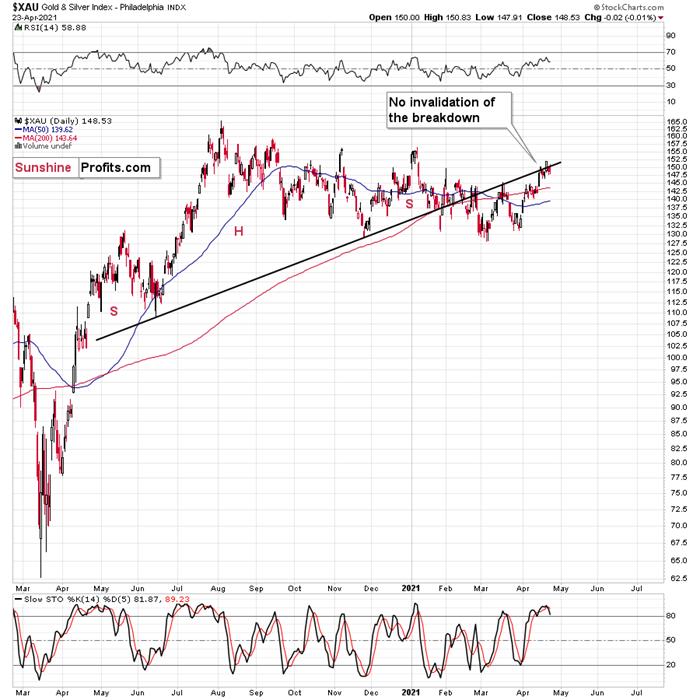
Mirroring the GDX ETF, both indices arealso eliciting sell signals from their stochastic oscillators. And with the GDXETF the only wolf still howling at the moon, expect the seniorminers to follow the rest of the pack lower in the near future.
Also, eliciting bearish undertones, theHUI Index/S&P 500 ratio has recorded a major, confirmed breakdown. And withthe ratio nowhere near recapturing its former glory, it’s another sign that theGDX ETF is a significant outlier.
Please see below: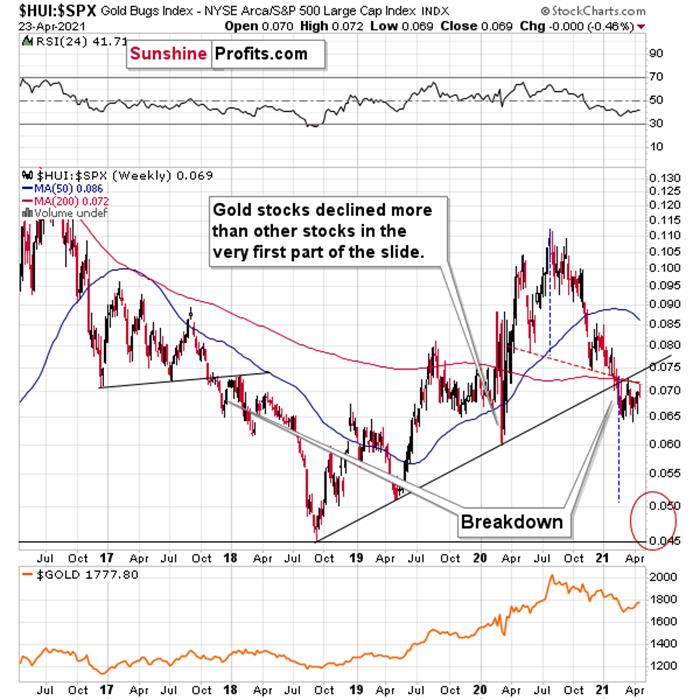
When the ratio presented on the abovechart above is rising, it means that the HUIIndex is outperforming the S&P 500. When the line above is falling, itmeans that the S&P 500 is outperforming the HUI Index. If you analyze theright side of the chart, you can see that theratio has broken below its rising support line. For context, the last timea breakdown of this magnitude occurred, the ratio plunged from late-2017 tolate-2018. Thus, the development is profoundly bearish.
Playing out as I expected, a sharp movelower was followed by a corrective upswing back to the now confirmed breakdown level (which is now resistance). Mirroringthe behavior that we witnessed in early 2018, after breaking below its risingsupport line, the HUI Index/S&P 500 ratio rallied back to the initialbreakdown level (which then became resistance) before suffering a sharpdecline. And with two-thirds of the analogue already complete, the current movelower still has plenty of room to run. Likewise, the early-2018 top in the HUI Index/S&P 500 ratio is precisely whenthe USD Index began its massive upswing. Thus, with history likely to rhyme,the greenback could spoil the miners’ party once again.
In addition, the HUI to S&P 500 ratiobroke below the neck level (red, dashed line) of a broad head-and-shoulderspattern and it verified this breakdown by moving temporarily back to it. Thetarget for the ratio based on this formation is at about 0.05 (slightly aboveit). Consequently, if the S&P 500 doesn’t decline, the ratio at 0.05 wouldimply the HUI Index at about 196. However, if the S&P 500 declined to about3,200 or so (its late-2020 lows) and the ratio moved to about 0.05, it wouldimply the HUI Index at about 160 – very close to its 2020 lows.
All in all, the implications of miningstocks’ relative performance to gold and the general stock market are currentlybearish.
But if we’re headed for a GDX ETF cliff,how far could we fall?
Well, there are three reasons why the GDXETF might form an interim bottom at roughly ~$27.50 (assuming no big decline inthe general stockmarket ):
Keep in mind though: if the stock market plunges, all bets areoff. Why so? Well, because when the S&P 500 plunged in March 2020, theGDX ETF moved from $29.67 to below $17 in less than two weeks. As a result,U.S. equities have the potential to make the miners’ forthcoming swoon all themore painful.
TheGold Miners Bullish Percent Index ($BPGDM)
As another reliable indicator (inaddition to the myriads of signals coming not only from mining stocks, but fromgold, silver, USD Index, stocks, their ratios, and many fundamentalobservations) the GoldMiners Bullish Percent Index ($BPGDM) isn’t at levels that trigger a major reversal. The Index is nowapproaching 47. However, far from a medium-term bottom, the latest reading isstill more than 37 points above the 2016 and 2020 lows.
Back in 2016 (after the top), and inMarch 2020, the buying opportunity didn’t present itself until the $BPGDM wasbelow 10.
Thus, with the sentiment still relativelyelevated, it will take more negativity for the index to find the true bottom.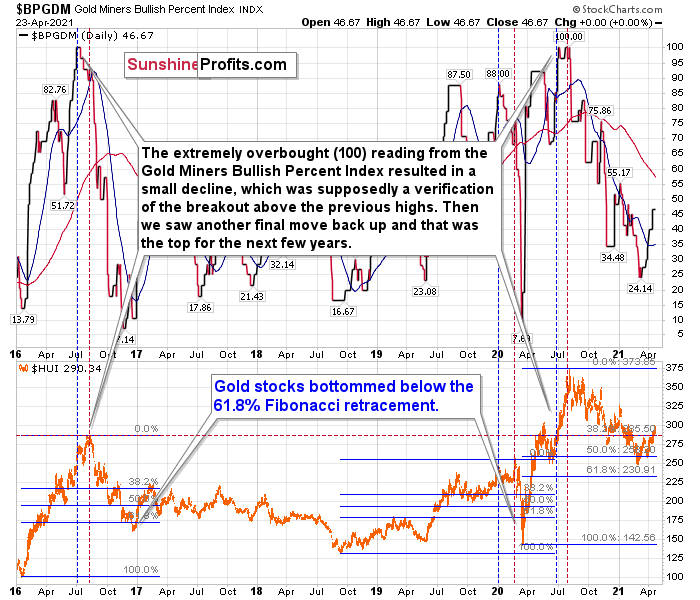
The excessive bullishness was present atthe 2016 top as well and it didn’t cause the situation to be any less bearishin reality. All markets periodically get ahead of themselves regardless of howbullish the long-term outlook really is. Then, they correct. If the upswing wassignificant, the correction is also quite often significant.
Please note that back in 2016, there wasan additional quick upswing before the slide and this additional upswing causedthe $BPGDM to move up once again for a few days. It then declined once again.We saw something similar also in the middle of 2020. In this case, the move uptook the index once again to the 100 level, while in 2016 this wasn’t the case.But still, the similarity remains present.
Back in 2016, when we saw thisphenomenon, it was already after the top, and right before the big decline.Based on the decline from above 350 to below 280, we know that a significantdecline is definitely taking place.
But has it already run its course?
Well, in 2016 and early 2020, the HUIIndex continued to move lower until it declined below the 61.8% Fibonacci retracement level. The emphasis goes on“below” as this retracement might not trigger the final bottom. Case in point:back in 2020, the HUI Index undershot the 61.8% Fibonacci retracement level andgave back nearly all of its prior rally. And using the 2016 and 2020 analoguesas anchors, this time around, the HUI Index is likely to decline below 231. Inaddition, if the current decline is more similar to the 2020 one, the HUI Indexcould move to 150 or so, especially if it coincides with a significant drawdownof U.S. equities.
TheNASDAQ
Circling back to the NASDAQ Composite,the unwinding of excessive speculation could deliver a fierce blow to the goldminers. Case in point: when the dot-com bubble burst in 2000, the NASDAQ lost nearly 80% of its value, while the goldminers lost more than 50% of their value.
Please see below: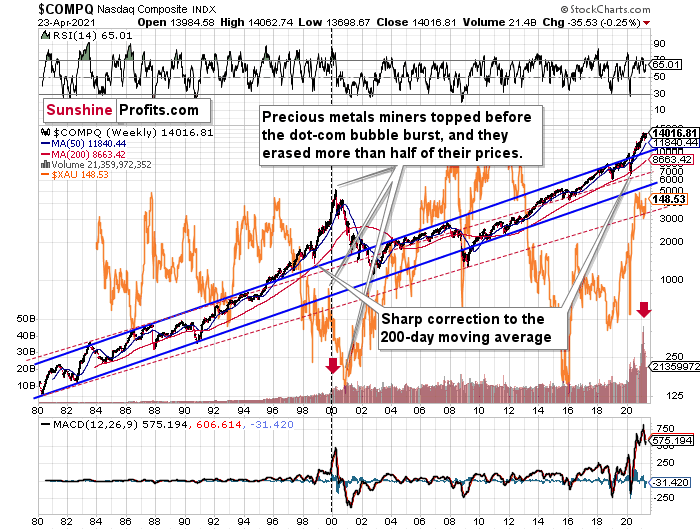
Right now, the two long-term channelsabove (the solid blue and red dashed lines) show that the NASDAQ is tradingwell above both historical trends.
Back in 1998, the NASDAQ’s last hurrahoccurred after the index declined to its 200-day moving average (which was alsoslightly above the upper border of the rising trend channel marked with reddashed lines).
And what happened in the first half of2020? Well, we saw an identical formation.
The similarity between these two periodsis also evident if one looks at the MACDindicator . There has been no other, even remotely similar, situation wherethis indicator would soar so high.
Furthermore, and because the devil is in thedetails, the gold miners’ 1999 top actually preceded the 2000 NASDAQ bubblebursting. It’s clear that miners (the XAUIndex serves as a proxy) are on the left side of the dashed vertical line,while the tech stock top is on its right side. However, it’s important to notethat it was stocks’ slide that exacerbated miners’ decline. Right now, themining stocks are already declining, and the tech stocks continue to rally. Twodecades ago, tech stocks topped about 6 months after miners. This might spoilthe party of the tech stock bulls, but miners topped about 6 months ago…
Also supporting the 2000 analogue,today’s volume trends are eerily similar. If you analyze the red arrows on thechart above, you can see that the abnormal spike in the MACD indicatorcoincided with an abnormal spike in volume. Thus, mounting pressure implies acataclysmic reversal could be forthcoming.
Interestingly, two decades ago, minersbottomed more or less when the NASDAQ declined to its previous lows, created bythe very first slide. We have yet to see the “first slide” this time. But, ifthe history continues to repeat itself and tech stocks decline sharply and thencorrect some of the decline, when they finally move lower once again, we mightsee THE bottom in the mining stocks. Of course, betting on the above scenariobased on the XAU-NASDAQ link alone would not be reasonable, but if otherfactors also confirm this indication, this could really take place.
Either way, the above does a great job atillustrating the kind of link between the general stock market and the preciousmetals market ( gold , silver , and mining stocks) that I expect to see also this time. PMs and minersdeclined during the first part of the stocks’ (here: tech stocks) decline, butthen they bottomed and rallied despite the continuation of stocks’ freefall.
Even more ominous, the MACD indicator is now flashing a clear sellsignal . And because the current reading is analogous to the one thatpreceded the dot-com bust, the NASDAQ Composite – and indirectly, the PMs –continues to sail toward the perfect storm.
With all of that said: how will we knowwhen a medium-term buying opportunity presents itself?
Weview price target levels as guidelines and the same goes for the Gold MinersBullish Percent Index (below 10), but the final confirmation will likely begold’s strength against the ongoing USDX rally. At many vital bottoms in gold,that’s exactly what happened, including the March bottom.
In conclusion, with the gold minersrunning low on strength, stamina and staying power, their fragile foundation isalready crumbling beneath the surface. With the HUI, XAU and GDXJ proxiesunable to match wits with the GDX ETF, the lone survivor is unlikely to put upmuch of a fight going forward. Moreover, with the USD Index poised to bounceoff of the 61.8% Fibonacci retracement level (the precious metals have a strongnegative correlation with the U.S. dollar), the foursome are likely to huff andpuff their way to lower prices. However, after a period of medium-term recovery,the precious metals will be ready to run with the bulls once again.
Thank you for reading our free analysistoday. Please note that the above is just a small fraction of today’sall-encompassing Gold & Silver Trading Alert. The latter includes multiplepremium details such as the target for gold that could be reached in the nextfew weeks. If you’d like to read those premium details, we have good news foryou. As soon as you sign up for our free gold newsletter, you’ll get a free7-day no-obligation trial access to our premium Gold & Silver TradingAlerts. It’s really free – sign up today.
Przemyslaw Radomski, CFA
Founder, Editor-in-chief
Toolsfor Effective Gold & Silver Investments - SunshineProfits.com
Tools für EffektivesGold- und Silber-Investment - SunshineProfits.DE
* * * * *
About Sunshine Profits
SunshineProfits enables anyone to forecast market changes with a level of accuracy thatwas once only available to closed-door institutions. It provides free trialaccess to its best investment tools (including lists of best gold stocks and best silver stocks),proprietary gold & silver indicators, buy & sell signals, weekly newsletter, and more. Seeing is believing.
Disclaimer
All essays, research and information found aboverepresent analyses and opinions of Przemyslaw Radomski, CFA and SunshineProfits' associates only. As such, it may prove wrong and be a subject tochange without notice. Opinions and analyses were based on data available toauthors of respective essays at the time of writing. Although the informationprovided above is based on careful research and sources that are believed to beaccurate, Przemyslaw Radomski, CFA and his associates do not guarantee theaccuracy or thoroughness of the data or information reported. The opinionspublished above are neither an offer nor a recommendation to purchase or sell anysecurities. Mr. Radomski is not a Registered Securities Advisor. By readingPrzemyslaw Radomski's, CFA reports you fully agree that he will not be heldresponsible or liable for any decisions you make regarding any informationprovided in these reports. Investing, trading and speculation in any financialmarkets may involve high risk of loss. Przemyslaw Radomski, CFA, SunshineProfits' employees and affiliates as well as members of their families may havea short or long position in any securities, including those mentioned in any ofthe reports or essays, and may make additional purchases and/or sales of thosesecurities without notice.
Przemyslaw Radomski Archive |
© 2005-2019 http://www.MarketOracle.co.uk - The Market Oracle is a FREE Daily Financial Markets Analysis & Forecasting online publication.