Gold Mining Stocks: Will Investors Dump the Laggards? / Commodities / Gold and Silver Stocks 2021

Mining stocks were picked up byinvestors in the latest bullish wave. But these bad performers may be dumpedjust as quickly as they were bought.
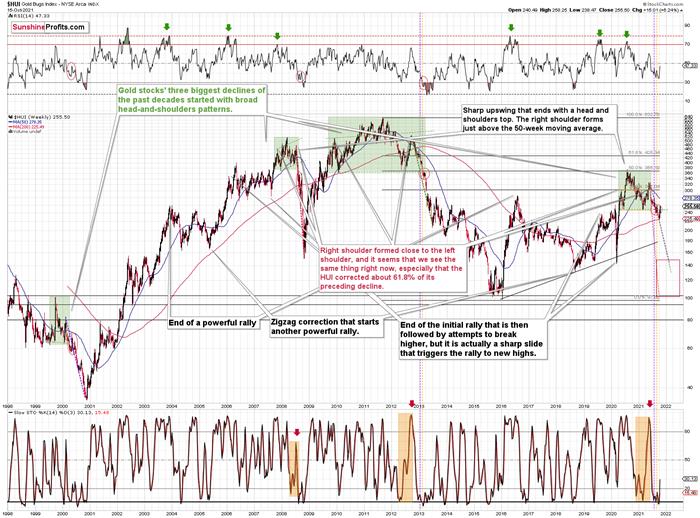
After the HUIIndex rallied back above the neckline of its bearish head &shoulders pattern, a new bull market for mining stocks has finally begun. Or has it? Well, after an identicaldevelopment occurred in 2000, the HUI Index soon invalidated the breakout (andonce again confirmed the breakdown) and a sharp decline followed.
Please see below:
As further evidence, stock marketstrength often follows the aphorism that ‘a rising tide lifts all boats.’
And while gold mining stocks rode thebullish wave, the sentiment high will likely reverse over the medium term.
To explain, silver and mining stocks are some of the worst performers whenvolatility strikes the general stock market. And with mining stocks’ recentbout of optimism underwritten by the ‘everything rally’ that we witnessed lastweek, when market participants ‘panic buy’ everything in sight, they oftengobble up the major laggards (with the goal of capitalizing on potential meanreversion). Moreover, with silver and mining stocks some of theworst-performing assets YTD, the excessive optimism helped uplift theselaggards last week.
To that point, with last week’s movelargely driven by sentiment and not fundamental or technical realities, silverand mining stocks’ rallies are unlikely to hold over the medium term.Furthermore, it’s important to remember that cheap assets are often cheap for areason. And with the marginal buyer of silver and mining stocks buying momentumand not fundamentals, they’ll likely end up holding the bag if/when sentimentreverses once again.
In other words, it was probably buyingfrom the general public that helped to lift gold stocks higher – the kind ofinvestors that enter the market at the end of the upswing, buying what’s cheapregardless of the outlook. And these are also the kind of investors that tendto lose money.
If you really think that gold stocks werestrong last week, please compare their performance to the one of copper, forexample. The latter moved sharply higher, while miners simply corrected fromtheir yearly lows.
Inaddition, while I’ve also been warning about the ominous similarity to2012-2013, the HUI Index continues to hop into the time machine. To explain,the vertical, dashed lines above demonstrate how the HUI Index is following its2012-2013 playbook. For example, after a slight buy signal from the stochasticindicator in 2012, the short-term pause was followed by another sharp drawdown.For context, after the HUI Index recorded a short-term buy signal in late 2012 – when the index’s stochastic indicator was already below the 20level (around 10) and the index was in the process of forming the rightshoulder of a huge, medium-term head-and-shoulders pattern – the index moved slightly higher, consolidated,and then fell off a cliff. Thus, the HUI Index is quite likely to decline toits 200-week moving average (or so) before pausing and recording a correctiveupswing. That’s close to the 220 level. Thereafter, the index will likelycontinue its bearish journey and record a final medium-term low some time inDecember.
Furthermore,I warned previously that the miners’ drastic underperformance of gold was anextremely bearish sign. There were several weeks when gold rallied visibly, andthe HUI Index actually declined modestly. And now, gold stocks are tradingclose to their previous 2021 lows, while gold is almost right in the middlebetween its yearly high and its yearly low.
Andwhy is this so important? Well, because the bearish implications of gold stocks’extreme underperformance still remain intact.
Let’skeep in mind that the drastic underperformance of the HUI Index also precededthe bloodbath in 2008 as well as in 2012 and 2013. To explain, right before thehuge slide in late September and early October 2008, gold was still moving tonew intraday highs; the HUI Index was ignoring that, and then it declineddespite gold’s rally. However, it was also the case that the general stockmarket suffered materially. If stocks didn’t decline so profoundly back then,gold stocks’ underperformance relative to gold would have likely been presentbut more moderate.
Nonetheless,broad head & shoulders patterns have often been precursors to monumentalcollapses. For example, when the HUI Index retraced a bit more than 61.8% ofits downswing in 2008 and in between 50% and 61.8% of its downswing in 2012before eventually rolling over, in both (2008 and 2012) cases, the final top –the right shoulder – formed close to the price where the left shoulder topped.And in early 2020, the left shoulder topped at 303.02. Thus, three of thebiggest declines in the goldmining stocks (I’m using the HUI Index as a proxy here) all startedwith broad, multi-month head-and-shoulders patterns. And in all three cases,the size of the declines exceeded the size of the head of the pattern. As areminder, the HUI Index recently completed the same formation.
Yes,the HUI Index moved back below the previous lows and the neck level of theformation, which – at face value – means that the formation was invalidated,but we saw a similar “invalidation” in 2000 and in 2013. Afterwards, thedecline followed anyway. Consequently, I don’t think that taking the recentmove higher at its face value is appropriate. It seems to me that the analogiesto the very similar situation from the past are more important.
Asa result, we’re confronted with two bearish scenarios:If things develop as they did in 2000 and 2012-2013, gold stocks arelikely to bottom close to their early-2020 low.If things develop like in 2008 (which might be the case, given theextremely high participation of the investment public in the stock market andother markets), gold stocks could re-test (or break slightly below) their 2016low.
Inboth cases, the forecastfor silver, gold, and mining stocks is extremely bearish for thenext several months.
For even more confirmation, let’s comparethe behavior of the GDX ETF and the GDXJ ETF. Regarding the former, the GDXETF’s small breakout mirrors what we witnessed during the senior miners’downtrend in late 2020/early 2021. Moreover, when the GDX ETF’s RSI (RelativeStrength Index) approached 70 (overbought conditions) back then, the highs werein (or near) and sharp reversals followed.
Please see below: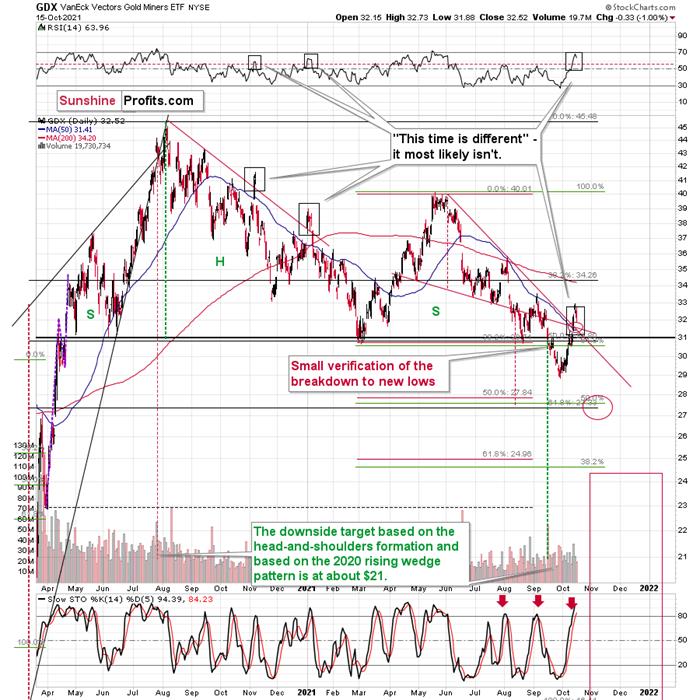
As for the GDXJ ETF, the gold junior miners’ RSI also signals overbought conditions and history has beenunkind when similar developments have occurred.
To explain, I wrote on Oct. 15:
Itis quite interesting when you consider how high the RSI is right now, and whenin the past both the RSI and the GDXJ itself were trading at today’s levels.
Thatwas in late February 2020. Back then, juniors were after a short-term rallyfrom below $40, and they topped above $44. The RSI approached 70 — just likewhat we see today. And then the GDXJ declined below $20 in less than a month. Ithink the decline will take place longer this time, but the outlook is stillextremely bearish.
Bythe way, the last time when the RSI was as high as it is right now was… rightat the 2020 top. That’s yet another indication for goldthat signals that the top is in or at hand.
Please see below: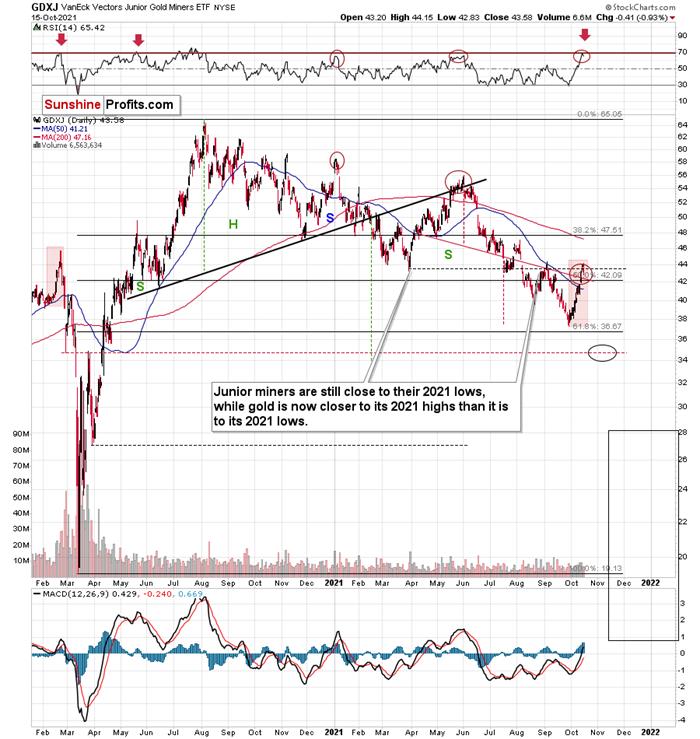
Also noteworthy, while mining stocksoutperformed gold on Oct. 15, their relative strength requires furtherverification to be considered material. For example, gold declined by 1.65% onOct. 15, while the GDX ETF and the GDXJETF were down by roughly 1%. Moreover, this occurred with the USD Index largelyflat. However, mining stocks will likely play catch-up over the next fewmonths and their relativestrength should reverse over the medium term.
In other words, it’s not correct tosimply compare gold stocks and gold right now and say that the former werestrong. It should be noted that the USD Index did nothing on Friday (Oct. 15)and gold stocks declined anyway. Consequently, it’s just the case that gold wasthe “odd man out” on Friday, while other markets were relatively normal. TheUSD Index verified its breakout, but it hasn’t moved visibly higher yet, sominers didn’t move visibly lower yet. Yet.
Finally, while I’ve been warning formonths that the GDXJ/GDX ratio was destined for devaluation, the ratio hasfallen precipitously in 2021. And while a tiny breakout occurred last week, theprice action actually mirrors what we witnessed in early 2020 – right beforethe ratio fell off a cliff. As a result, further downside likely lies ahead.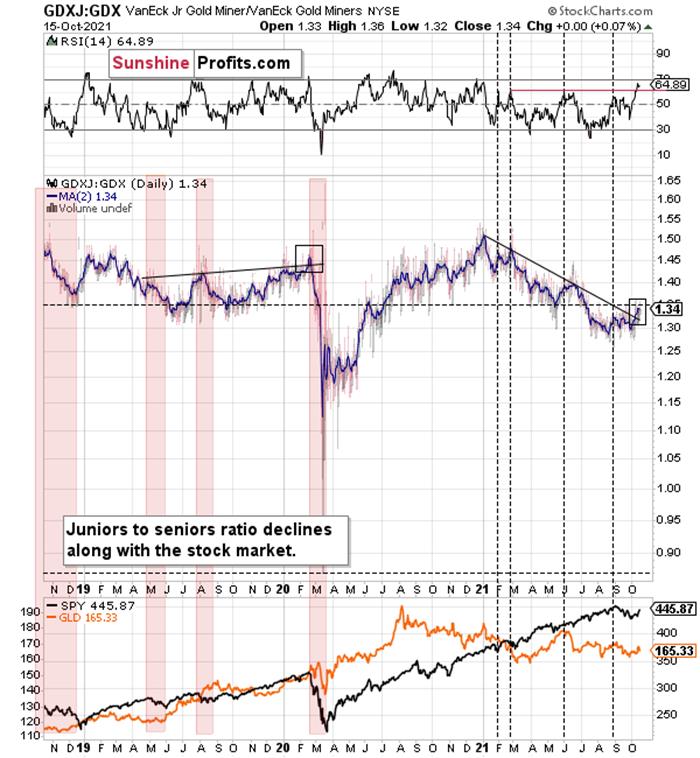
The bottom line?
If the ratio is likely to continue itsdecline, then on a short-term basis we can expect it to decline to 1.27 or so.If the general stock market plunges, the ratio could move even lower, but let’s assume that stocks declinemoderately (just as they did in the last couple of days) or that they donothing or rally slightly. They’ve done all the above recently, so it’s naturalto expect that this will be the case. Consequently, the trend in the GDXJ toGDX ratio would also be likely to continue, and thus expecting a move to about1.26 - 1.27 seems rational.
If the GDX is about to decline toapproximately $28 before correcting, then we might expect the GDXJ to declineto about $28 x 1.27 = $35.56 or $28 x 1.26 = $35.28. In other words, ~$28 in the GDX is likely to correspond toabout $35 in the GDXJ.
Is there any technical support around $35that would be likely to stop the decline? Yes. It’s provided by the late-Feb.2020 low ($34.70) and the late-March high ($34.84). There’s also the late-Aprillow at $35.63.
Consequently, it seems that expecting theGDXJ to decline to about $35 is justified from the technical point of view aswell.
In conclusion, gold, silver, and miningstocks are doing what they often do: with short-term oversold conditionseliciting countertrend rallies, investors that ignore history, technicals, andfundamentals are hoping that this is the rally where the precious metalsfinally deliver on all of their promises. However, with each corrective upswingakin to ‘The Boy Who Cried Wolf,’ investors are often left disappointed whenthey run to the precious metals rescue. As a result, a similar outcome willlikely materialize this time around.
Today's article is asmall sample of what our subscribers enjoy on a daily basis. They know aboutboth the market changes and our trading position changes exactly when theyhappen. Apart from the above, we've also shared with them the detailed analysisof the miners and the USD Index outlook. Check more of our free articles on our website, including this one – justdrop by and have a look. Weencourage you to sign up for our daily newsletter, too - it's free and if youdon't like it, you can unsubscribe with just 2 clicks. You'll also get 7 daysof free access to our premium daily Gold & Silver Trading Alerts to get ataste of all our care. Signup for the free newsletter today!
Thank you.
Przemyslaw Radomski, CFA
Founder, Editor-in-chief
Toolsfor Effective Gold & Silver Investments - SunshineProfits.com
Tools für EffektivesGold- und Silber-Investment - SunshineProfits.DE
* * * * *
About Sunshine Profits
SunshineProfits enables anyone to forecast market changes with a level of accuracy thatwas once only available to closed-door institutions. It provides free trialaccess to its best investment tools (including lists of best gold stocks and best silver stocks),proprietary gold & silver indicators, buy & sell signals, weekly newsletter, and more. Seeing is believing.
Disclaimer
All essays, research and information found aboverepresent analyses and opinions of Przemyslaw Radomski, CFA and SunshineProfits' associates only. As such, it may prove wrong and be a subject tochange without notice. Opinions and analyses were based on data available toauthors of respective essays at the time of writing. Although the informationprovided above is based on careful research and sources that are believed to beaccurate, Przemyslaw Radomski, CFA and his associates do not guarantee theaccuracy or thoroughness of the data or information reported. The opinionspublished above are neither an offer nor a recommendation to purchase or sell anysecurities. Mr. Radomski is not a Registered Securities Advisor. By readingPrzemyslaw Radomski's, CFA reports you fully agree that he will not be heldresponsible or liable for any decisions you make regarding any informationprovided in these reports. Investing, trading and speculation in any financialmarkets may involve high risk of loss. Przemyslaw Radomski, CFA, SunshineProfits' employees and affiliates as well as members of their families may havea short or long position in any securities, including those mentioned in any ofthe reports or essays, and may make additional purchases and/or sales of thosesecurities without notice.
Przemyslaw Radomski Archive |
© 2005-2019 http://www.MarketOracle.co.uk - The Market Oracle is a FREE Daily Financial Markets Analysis & Forecasting online publication.