Gold- Mother of all bullish patterns formed?
Six years ago this week, the Power of the Pattern shared that "Gold could be flat to down for years to come!" See Why the Power of the Pattern felt this way. See Post Here
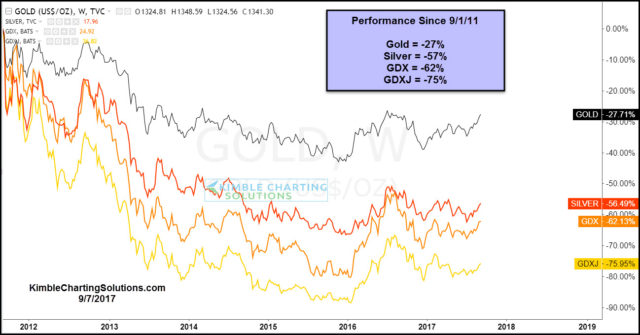
Below looks at the performance of Gold, Silver, GDX and GDXJ since the post on 9/1/11-
CLICK ON CHART TO ENLARGE
Could the struggles of the metals markets be about to end? Mother of all "Bullish Patterns" in play for Gold? Could be, check out the chart below-
Even though Gold has been down hard the past 6-years, it did NOT break below rising support off the 2001 lows, which was tested at last years lows. This is a long-term positive.
Over the past couple of years, Gold could be forming a base, that is taking the shape of a "Bullish Inverse Head & Shoulders" pattern. If the read would happen to be correct, an all important test is in play at this time. The key test in play is this...Gold is testing the underside of the neckline, which is resistance at this time.
Bottom Line- If this read is correct and Gold breaks above the neckline at (1), we could see buying pressure take place, that has been absent for years.
If you are interested in Gold, Silver, Miners or Copper, we would be honored if you were a Premium or Metals Member.


