Gold Needs More Time Before It Breaks To The Upside
Gold tries to rally, but the Fed stands in the way.
The markets expected too much from the central bank.
The critical levels to watch on the downside.
Rising rates are toxic for gold, but there is a big hand holding the dollar down.
Looking to buy NUGT on any washout.
Gold traded to a high at $1344 on the nearby COMEX futures contract in 2019 after hitting a high at $1365.40 in 2018. Last year's peak created a double top in the gold futures market as the price hit the exact high in January and April. In 2017, the highest price for gold was at $1358.50, and in 2016, the yellow metal reached $1377.50. There is a lot of congestion in the gold market between the $1340 and $1380 band, and each attempt to make a new high has failed. However, gold continues to move higher in all of the leading currencies. The longer-term charts of gold in the dollar, euro, and yen terms, all indicate bullish price trends.
While gold has failed to rise above the $1380 level, it keeps coming back which is a sign of underlying demand for the precious metal. Gold has been in a consolidation pattern, and it may be only a matter of time before it finally builds the energy to move appreciably higher and breaks to the upside on a technical basis.
Gold mining stocks tend to provide a leveraged return compared to the price of gold bullion on rallies. The Direxion Daily Gold Miners Index Bull 3X Shares (NUGT) could be an excellent tool for those looking to buy gold on dips to take advantage of the current trading range. Buying gold when it looks its worst has been the optimal strategy since December 2015 when the price fell to a bottom at $1046.20 per ounce.
Gold tries to rally, but the Fed stands in the way
The most recent rally in gold took the price of the yellow metal to a high at $1314.70 on April 10 on the June COMEX futures contract. 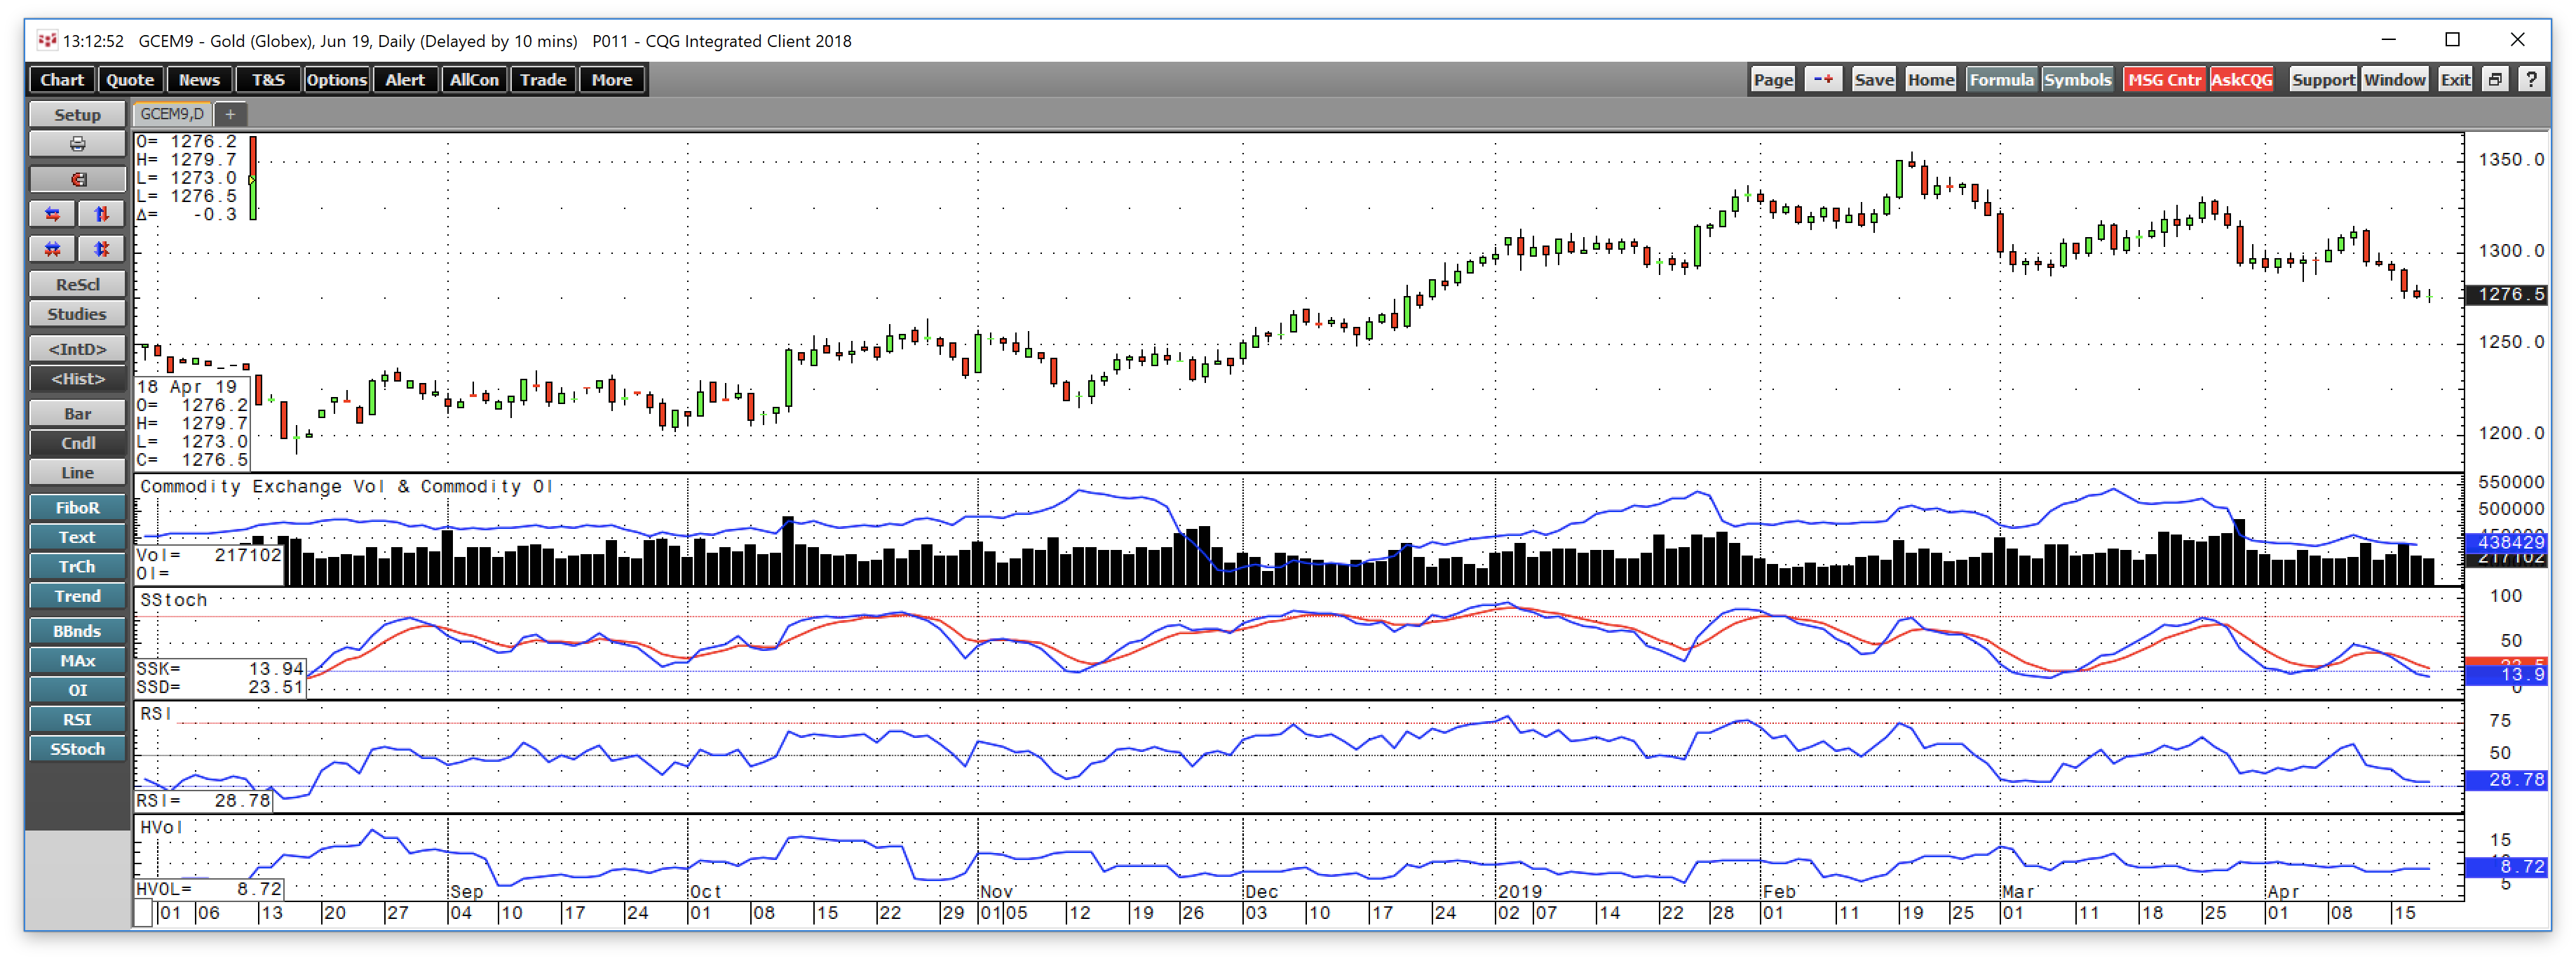
Source: CQG
As the daily chart shows, the yellow metal gave up three days of gains on April 11 in the aftermath of the release of the Fed minutes from their most recent FOMC meeting. So far, June gold futures traded to a low at $1273 on April 18 and was trading not far above that level at the end of last week. Both price momentum and relative strength metrics have declined to the lower area of neutral territory. Open interest at 438,429 contracts is at its lowest level of 2019 after declining from a high at 541,737 contracts in mid-March. Falling open interest and declining prices are not typically a technical validation of an emerging bearish price trend.
The Fed canceled their projections for increases in the Fed Funds rate in 2019 and reduced next year's outlook to only one 25 basis point increase in 2020. At the same time, the central bank announced it would end its balance sheet normalization program in September 2016 which was supportive of the price of gold. However, the latest Fed minutes were a disappointment for many who were looking for an even more dovish approach to monetary policy by the central bank which led to the decline below the $1300 per ounce level.
The markets expected too much from the central bank
President Trump and members of his administration have been highly critical of Fed Chairman Jerome Powell and members of the FOMC over their hawkish approach to monetary policy in 2018. On more than one occasion, the President has lamented that rate hikes and quantitative tightening have worked contrary to tax and regulatory reforms when it comes to economic growth.
Recently, the President nominated Stephen Moore to the Fed, and Mr. Moore has advocated for an immediate 50 basis point cut in the Fed Funds rate. Larry Kudlow, the administration's chief economic advisor, echoed Moore's call for a lower Fed Funds rate to undo the damage done to the economy in 2018.
After the most recent FOMC meeting, market sentiment shifted to expectations for a rate cut as the next move by the central bank. However, last week's Fed minutes seem to have dispelled that notion. There was no mention of any support for a decline in rates on the immediate horizon which led to an increase in interest rates and a drop in the price of gold. On a short-term basis, higher rates that are not the result of inflationary pressures tend to be toxic for the price of the yellow metal which sent gold lower following the release of the Fed minutes which provide the market of a look behind the decision-making curtain at the central bank.
The critical levels to watch on the downside
The high of 2019 stands at $1344 on the continuous futures contract. Above there, the 2018 peak was a double top at $1365.40 from January and April last year. The critical price on the upside stands at the 2016 post-Brexit peak at $1377.50. While gold came close to challenging those prices when it traded to $1344, it failed, and the attention has shifted to levels of support on the downside. 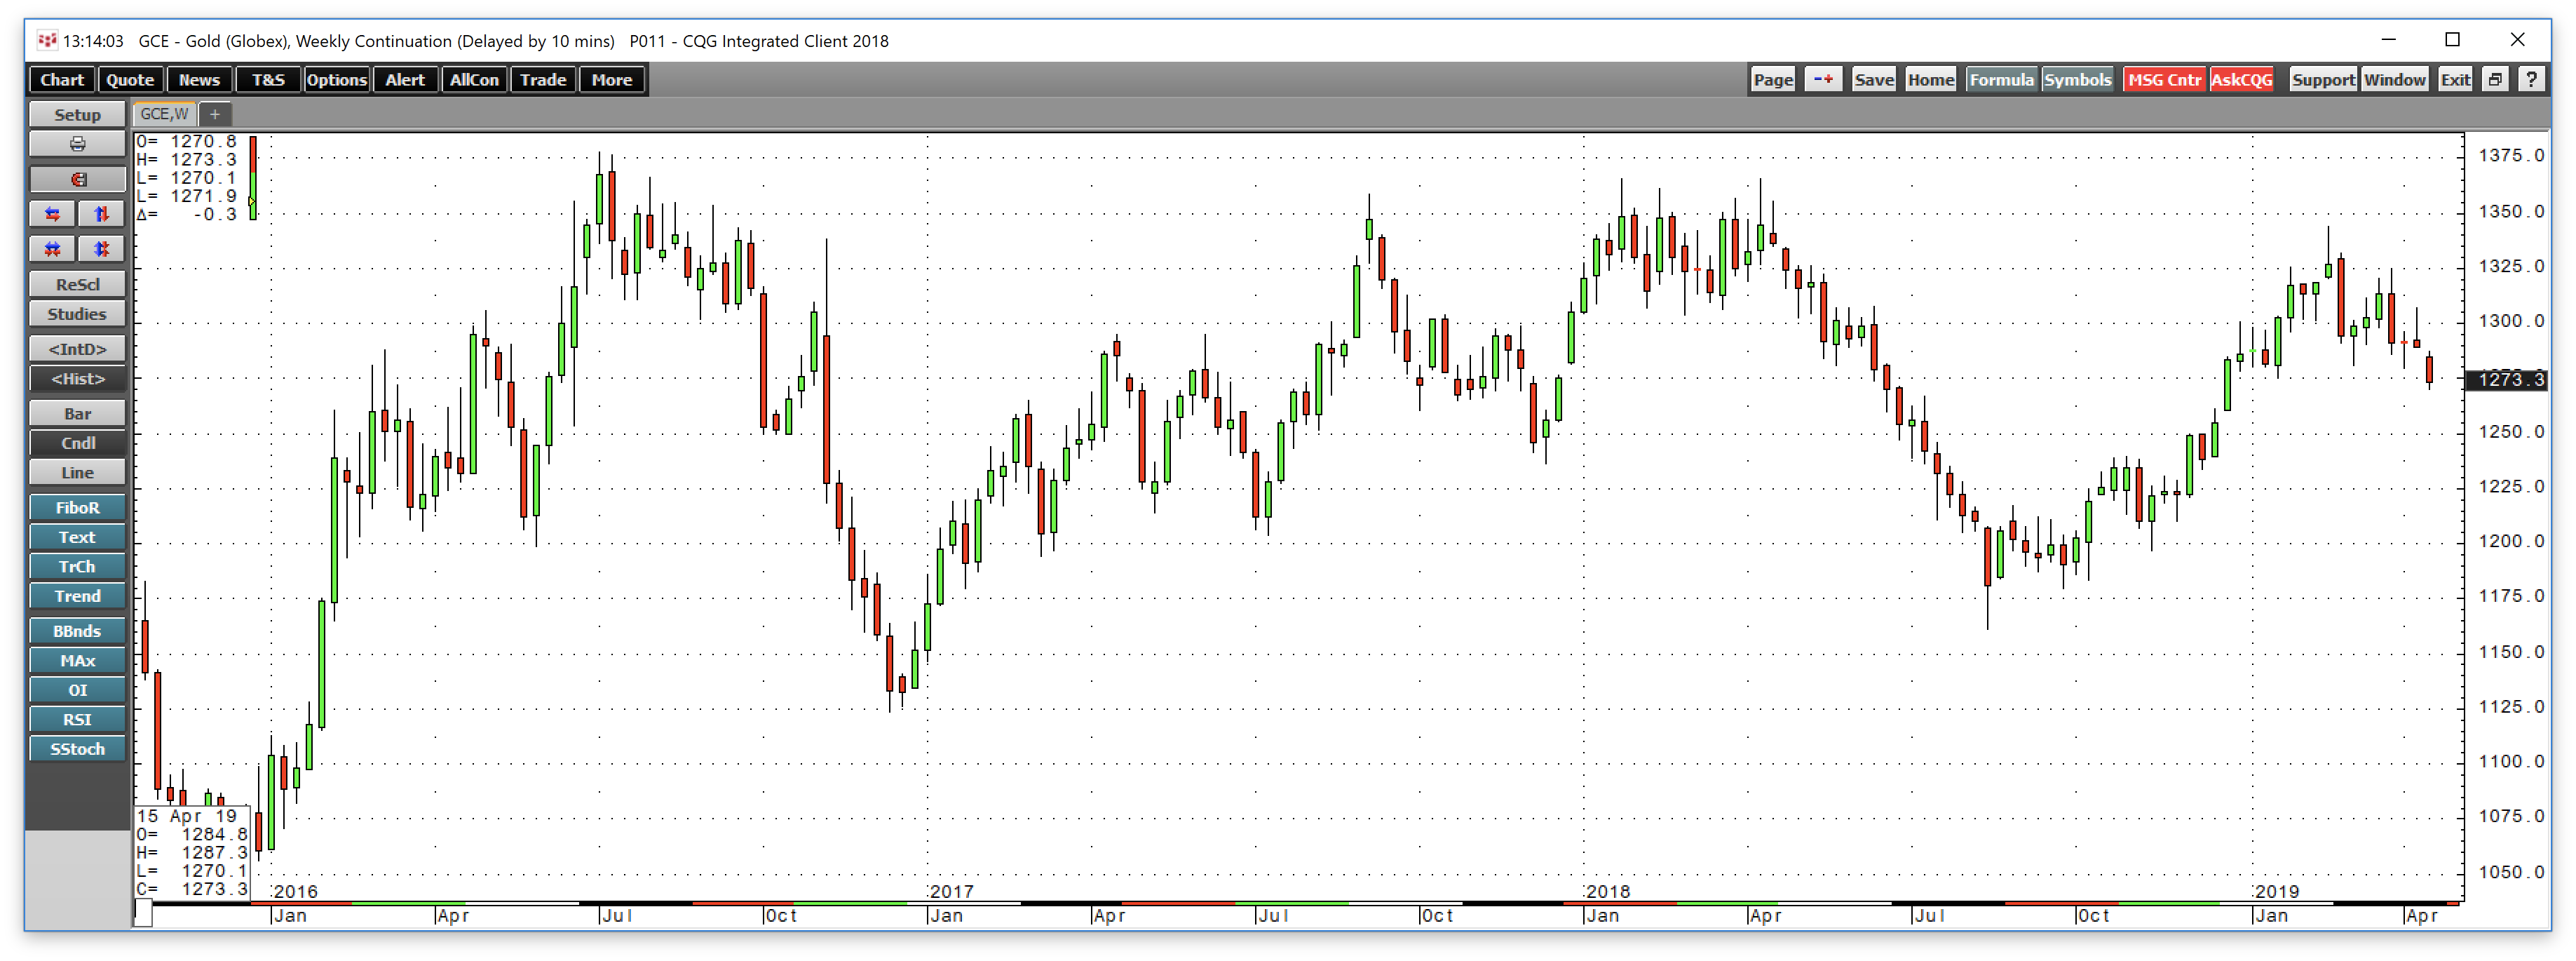
Source: CQG
As the weekly chart shows, below last week's low at $1270.10, the next levels of technical support stand at $1196.60 and $1161.40, the mid-November 2018 and mid-August 2018 lows. The most significant level dates back to December 2015 at $1046.20 per ounce which is a line in the sand for gold on the downside. The price has not traded below that level since February 2010.
Rising rates are toxic for gold, but there is a big hand holding the dollar down
Higher interest rates do not favor the upside in the gold market for two reasons. First, higher rates cause the cost of carrying a long position in gold to move higher. Like other assets, gold competes with bonds for investment capital. As the yield on fixed-income instruments increases, the appeal of the yellow metal tends to decline. Central banks around the world hold vast quantities of the yellow metal as part of their foreign currency reserves; therefore, there are no supply shortages in the gold market. As such, higher interest rates lead to a higher contango in the gold market which means that the differential between prices for nearby and deferred delivery rises as interest rates move to the upside. When it costs more to roll or carry a long position in the yellow metal, it tends to cause selling, or a lack of buying that would take the price higher.
The second reason is that rising rates in the US increases the yield differential between the US dollar and other world currencies, causing the path of least resistance for the greenback to be higher. The long-standing inverse price relationship between gold and the dollar means that strength in the US currency typically translates to weakness in the price of gold.
Gold reached its low in 2018 at $1161.40 when the dollar index rose to a new high at 96.865 in mid-August. However, when the dollar index rose to another new high in December of last year, gold did not fall to a lower low. Despite the wide interest rate differential between the dollar and the euro and yen currencies, there has been selling in the dollar each time the index attempts to climb above the 97 level on the dollar index. 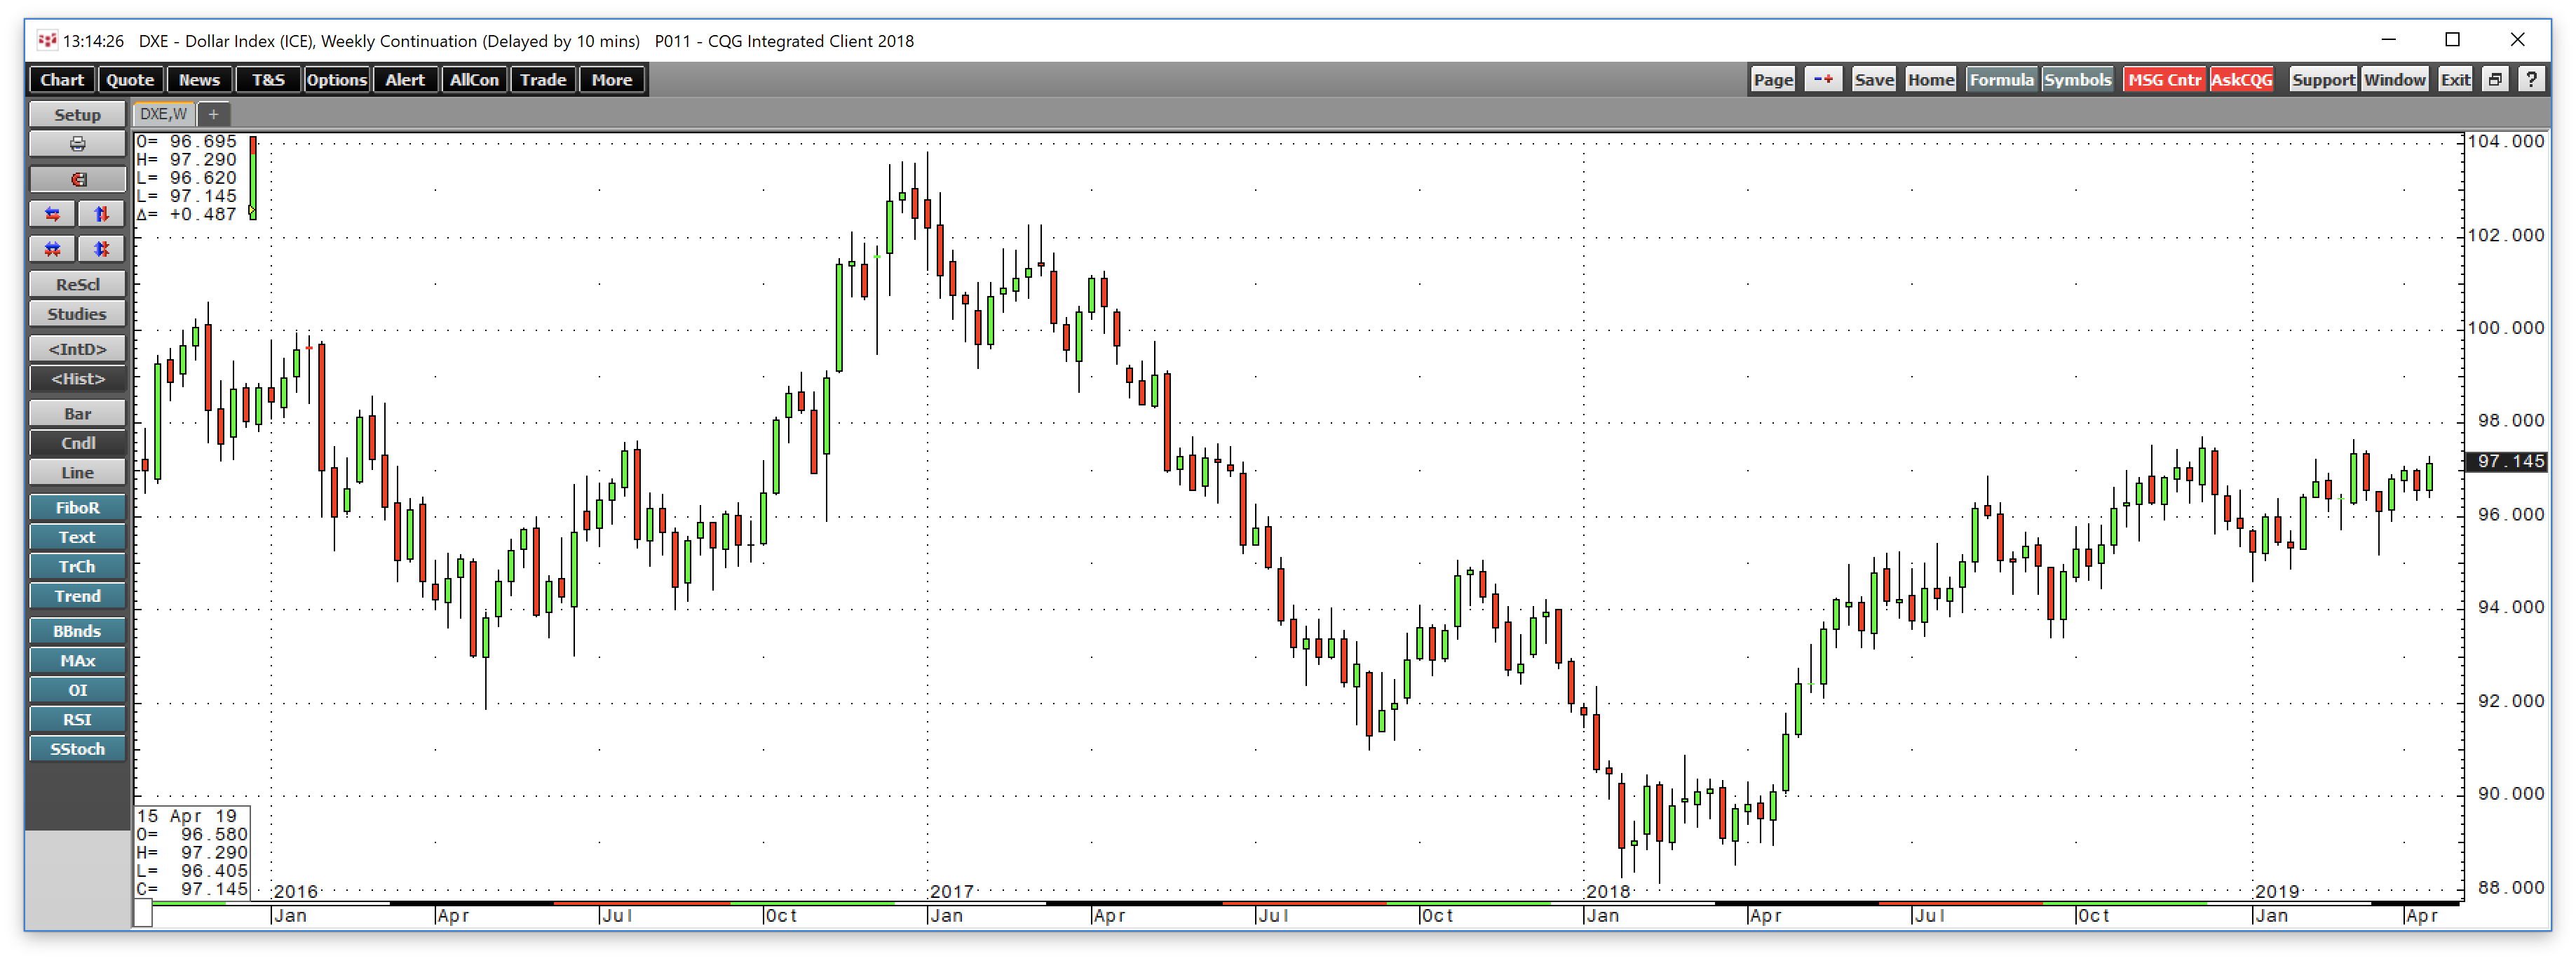
Source: CQG
As the weekly chart shows, the dollar index reached a high at 97.665 in early March, just shy of the December peak and failed sending the index back to a low at 95.17 two weeks later. The most recent attempt to rally took the dollar index to 97.29 at the end of last week. Time will tell if the index can power higher and through technical resistance, or if another retreat is in the cards for the greenback.
The dollar is the reserve currency of the world because of its stability. Part of the static dynamics of the dollar and other currency instruments is that governments work either independently or together to manage or manipulate the value of foreign exchange markets. The Trump administration has advocated for a weaker dollar starting on the campaign trail in 2016 as a lower dollar makes US exports more competitive in global markets. The dollar is likely a tool during the current trade negotiations with China and other trading partners around the world, so it should not come as a surprise if the administration is putting words into action and selling the dollar each time it threatens to move to a new high on the dollar index.
At his confirmation hearings, Secretary of the Treasury Steve Mnuchin spoke of the benefits of a weaker US currency. Secretary Mnuchin is intimately involved in trade negotiations and has his fingers on the pulse of the foreign exchange markets in his position as the leader of the Treasury. It is likely that US government intervention in the dollar is preventing it from running away on the upside, given the 2.65-2.90% short-term rate differential between the dollar and the euro and yen currencies.
While rising rates are bearish for gold, a continued inability of the dollar to break to the upside could turn out to be a bullish factor for the yellow metal. At the same time, lots of uncertainty from an economic and geopolitical perspective underpin demand for gold, and central banks around the world remain net buyers of the yellow metal. However, the most significant bullish factor for me these days is that years of accommodative monetary policy have weighed on the values of all fiat currencies. While we do not see the impact of historically low interest rates, even at current levels in the US, when looking at one currency against another, it does become apparent when measuring the dollar, the euro, and the yen against gold. 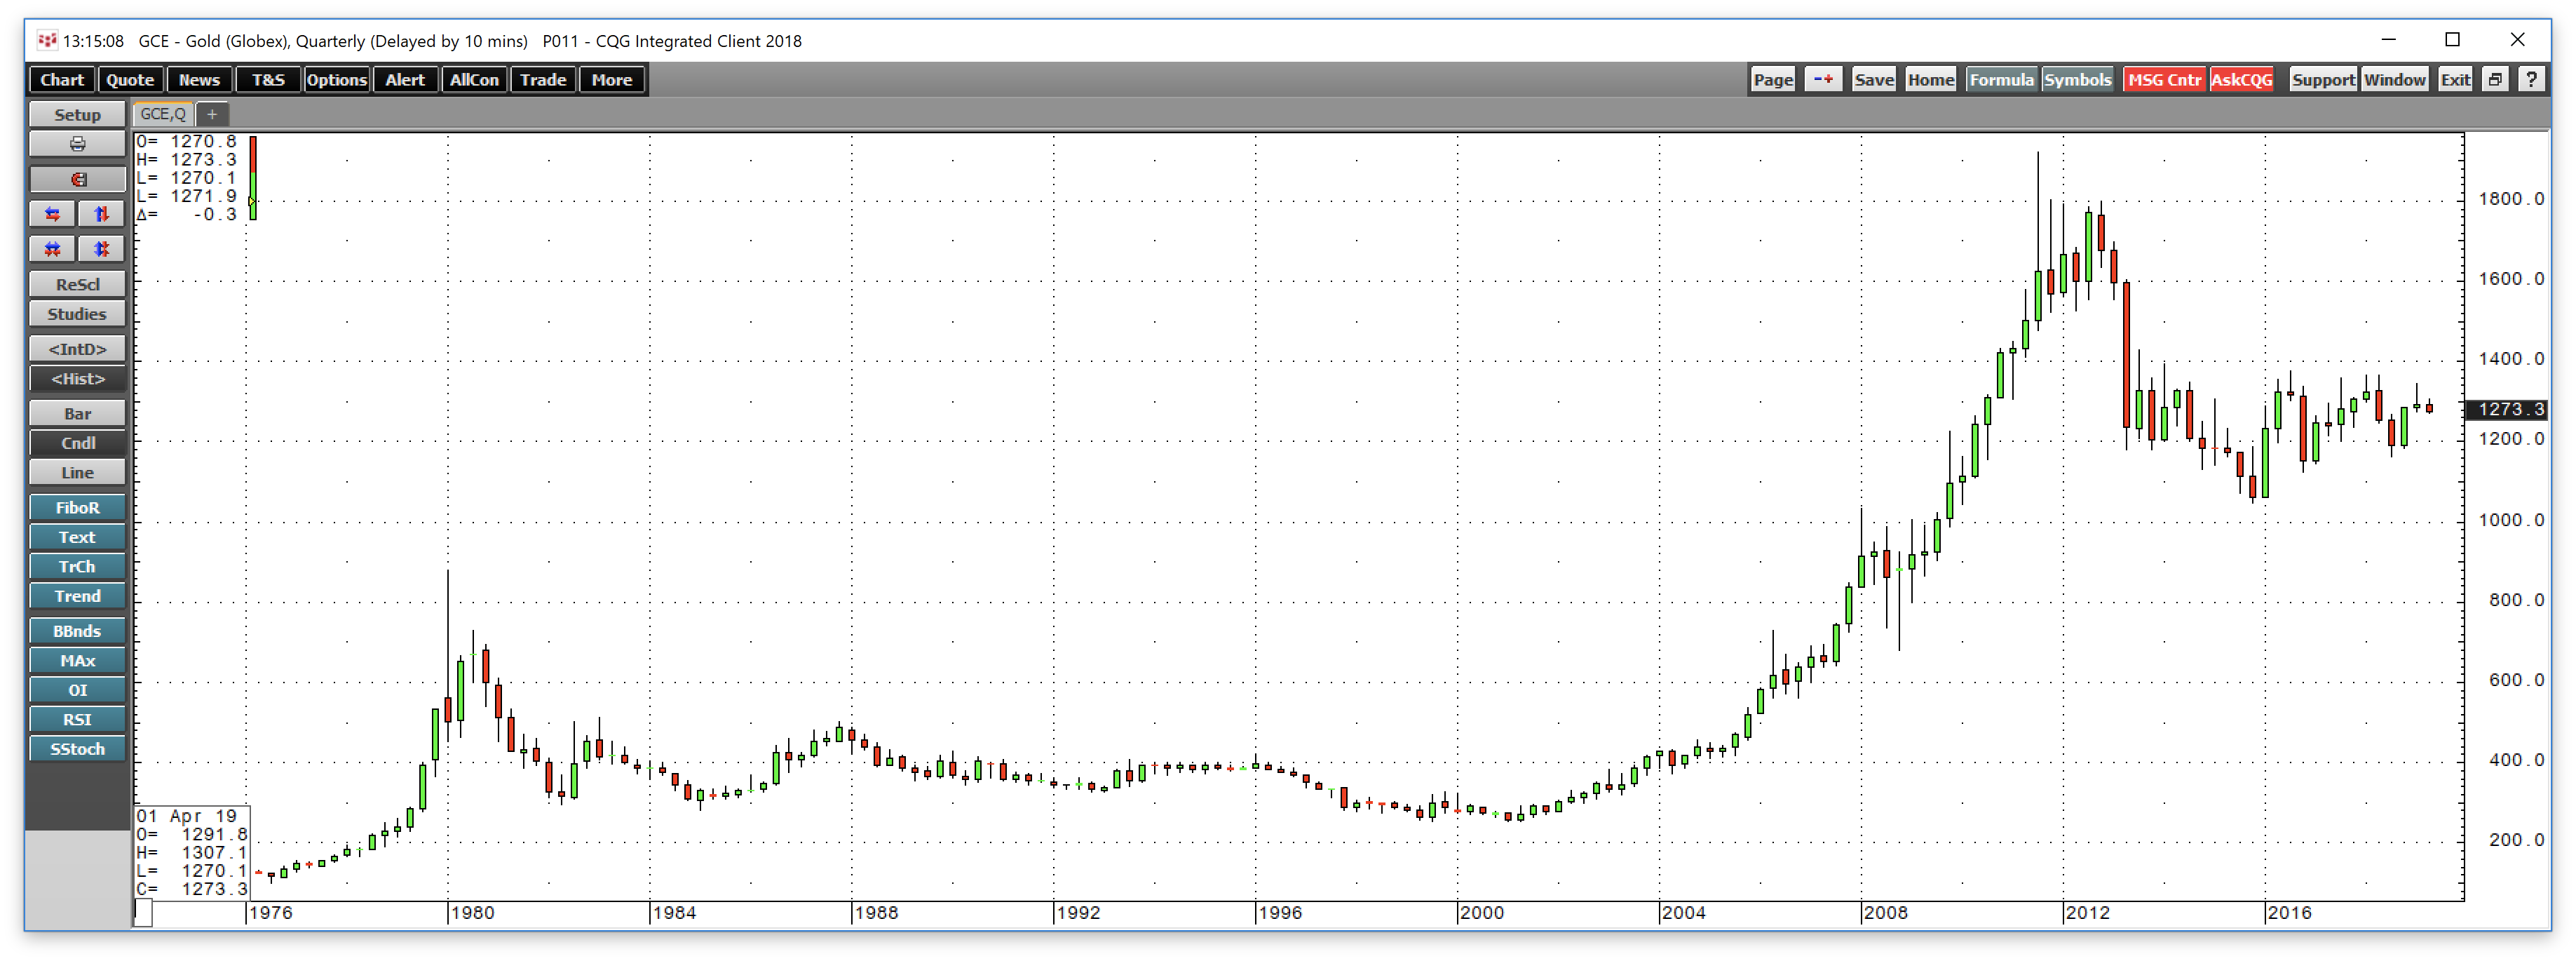
Source: CQG
As the quarterly chart of the price of gold in US dollar terms shows, since 2001, the dollar has depreciated against the yellow metal. 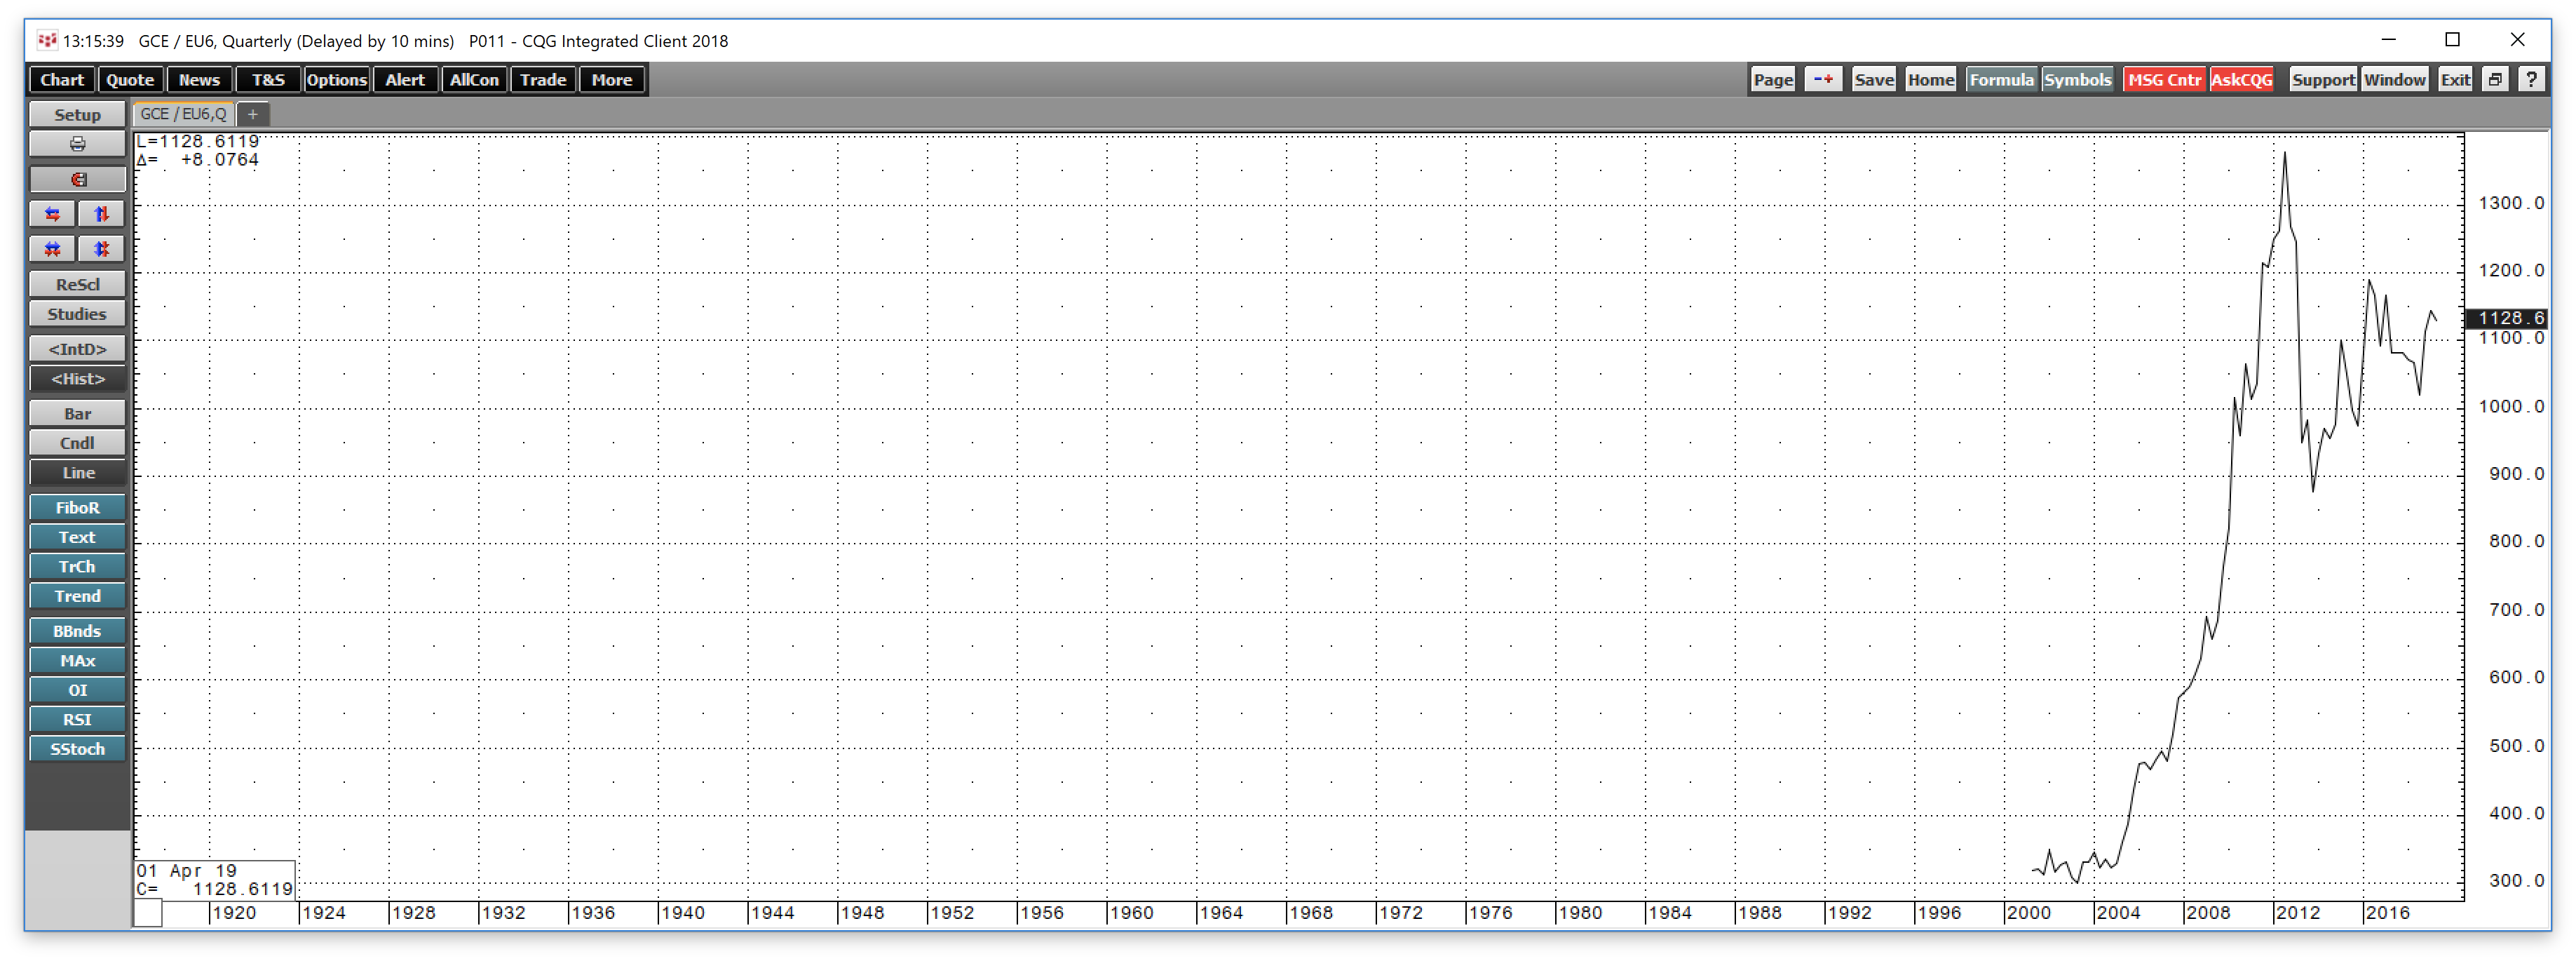
Source: CQG
Since 2003, the euro currency has declined against gold.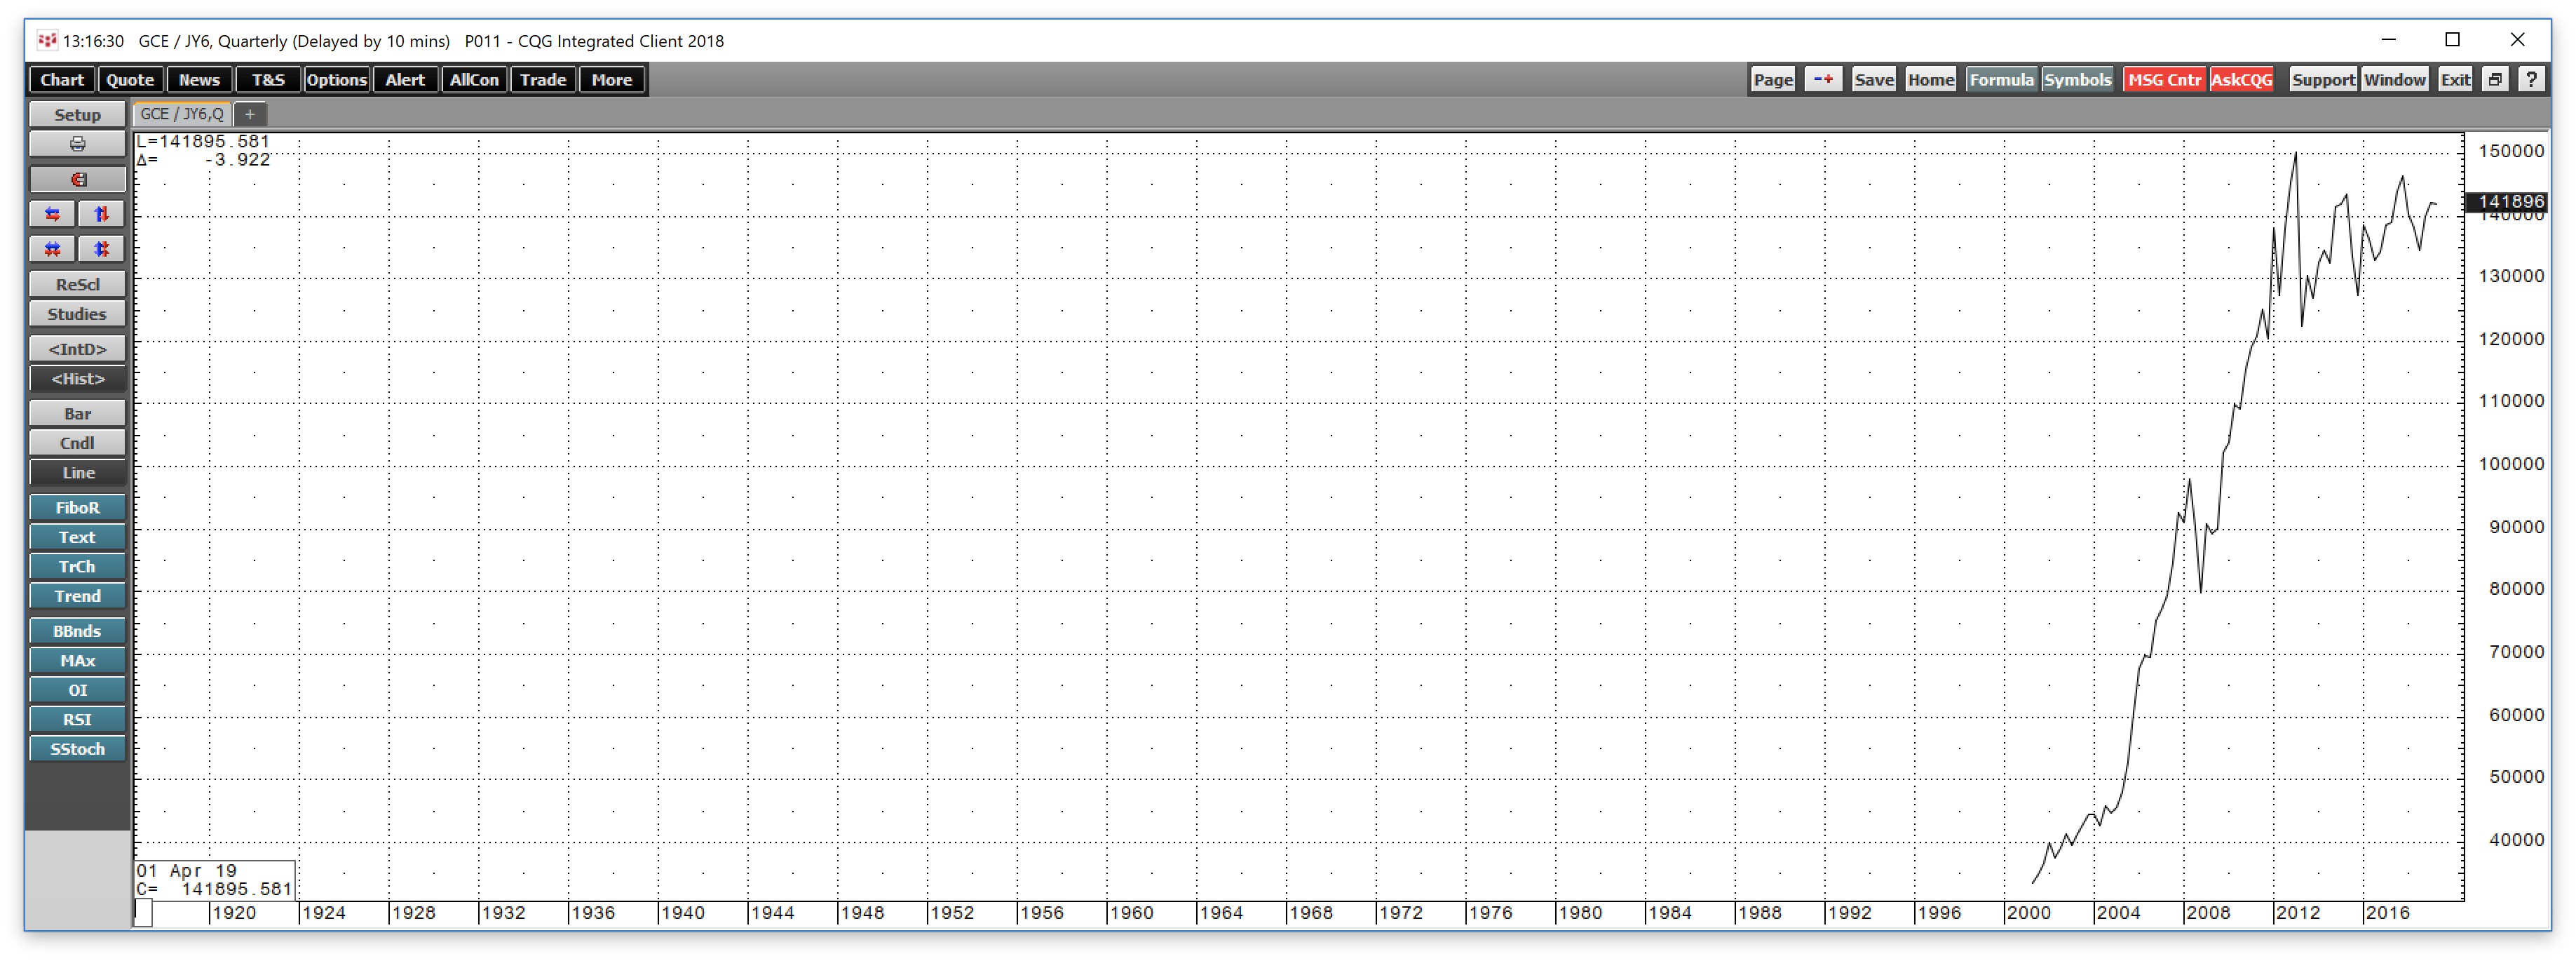
Source: CQG
Since 2001, gold has been rallying in Japanese yen terms. The bottom line is that the three fiat foreign exchange instruments that are the reserve currencies of the world have all depreciated in value against gold steadily for almost two decades.
The trend in gold suggests that the current dip caused by slightly higher interest rates and even a stronger dollar will be a temporary phenomenon and that any price weakness presents a buying opportunity in the yellow metal.
Looking to buy NUGT on any washout
I am a scale-down buyer of any gold-related instruments on price weakness including physical coins and bars, futures and futures options, gold mining stocks, and ETF/ETN products.
On a washout to the downside, like the one we witnessed in mid-2018 that took gold to the lowest price since early 2017 in mid-August last year, I will take a more aggressive stance using products like the Direxion Daily Gold Miners Index Bull 3X Shares. The fund summary for NUGT states:
The investment seeks daily investment results, before fees and expenses, of 300% of the daily performance of the NYSE Arca Gold Miners Index. The fund invests at least 80% of its net assets (plus borrowing for investment purposes) in financial instruments, such as swap agreements, and securities of the index, ETFs that track the index and other financial instruments that provide daily leveraged exposure to the index or ETFs that track the index. The index is a comprised of publicly traded companies that operate globally in both developed and emerging markets, and are involved primarily in mining for gold and, in mining for silver. It is non-diversified.
Gold mining shares tend to provide a leveraged performance compared to the gold price, and NUGT adds leverage to gold mining shares. However, triple-leveraged products like NUGT come at a price which is time decay. If the price of gold remains static or moves lower, products like NUGT tend to deteriorate quickly and are subject to reverse splits that destroy the value of the instrument over time. On a short-term basis, they magnify moves in the underlying gold market.
The price of gold rallied from $1275.30 during the week of January 22 to a high at $1344 during the week of February 19, a move of 5.4% to the upside. Over the same time, the GDX ETF product that holds shares in the leading gold producing companies moved from $20.22 to a high at $23.70 or 17.2% as the gold mining shares provided a leveraged return compared to the yellow metal. 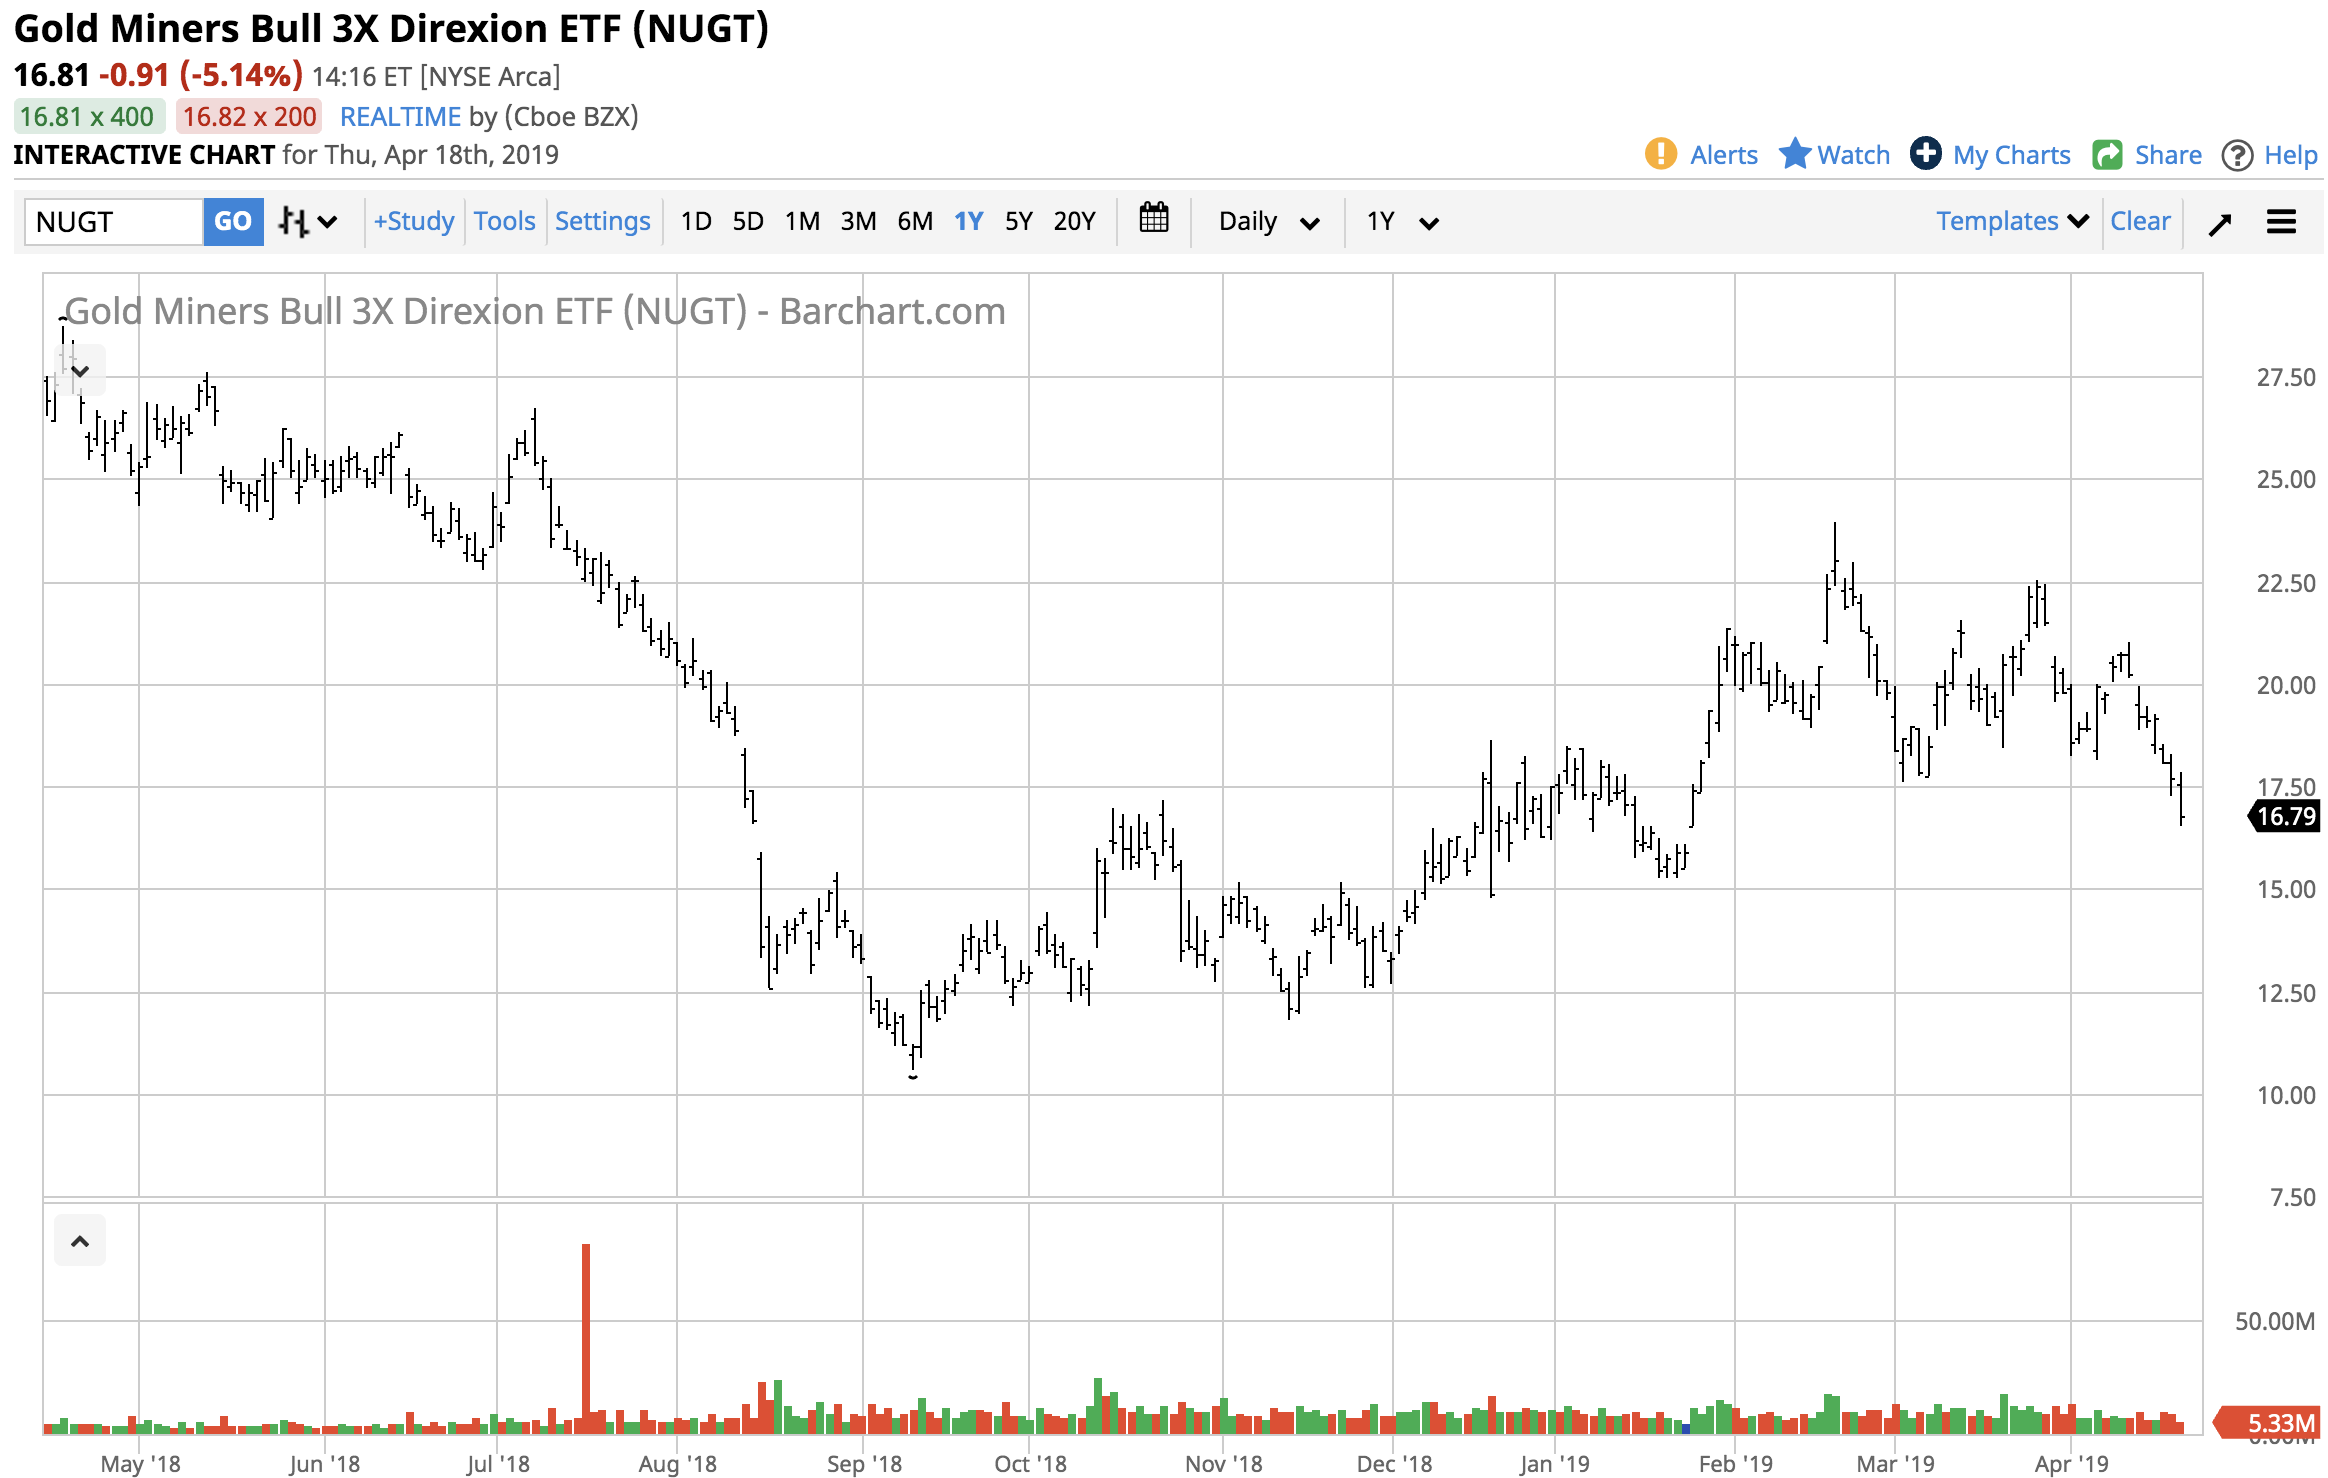
Source: Barchart
As the chart illustrates, over the same period, NUGT moved from $15.24 to $23.97 or 57.3% which was more than triple the percentage move in the GDX and over ten times the percentage move in gold.
Gold is correcting after the recent Fed minutes that have ended speculation that the central bank is about to cut interest rates. Time will tell how low the current selling will push the precious metal, and gold could need more time before it builds the strength to challenge technical resistance levels on the upside. However, there are more than a few signs that are flashing that the yellow metal will find a bottom sooner rather than later and we will be looking down rather than up at the $1300 per ounce level. For those who trade the gold market and will look to buy this dip with short-term tools, NUGT could be a golden choice when it comes to catching a rally on the percentage basis.
The Hecht Commodity Report is one of the most comprehensive commodities reports available today from the #2 ranked author in both commodities and precious metals. My weekly report covers the market movements of 20 different commodities and provides bullish, bearish and neutral calls, directional trading recommendations, and actionable ideas for traders. I just reworked the report to make it very actionable!
Disclosure: I/we have no positions in any stocks mentioned, and no plans to initiate any positions within the next 72 hours. I wrote this article myself, and it expresses my own opinions. I am not receiving compensation for it (other than from Seeking Alpha). I have no business relationship with any company whose stock is mentioned in this article.
Additional disclosure: The author always has positions in commodities markets in futures, options, ETF/ETN products, and commodity equities. These long and short positions tend to change on an intraday basis.The author is always long gold
Follow Andrew Hecht and get email alerts