Gold Now Has Major Institutional Support
Growing sovereign support will keep gold price buoyant in 2019.
Short-term, gold is on the cusp of another confirmed breakout.
Gold stocks, however, are still in a position of relative weakness.
The rise of official institutional involvement in the gold market, mainly in the form of central bank demand, will be one of the key factors behind gold's continued recovery in 2019. That assessment is now shared by a growing number of respected analysts and investors, and it's the argument we'll revisit in today's report. We'll also discuss gold's latest bottom signal, as well as the near-term outlook for the gold mining stocks.
One of the biggest supports for gold since its turnaround kicked off last year has been the notable increase in central bank activity in the gold market. According to the World Gold Council, central banks added the highest level of gold reserves in 2018 in over 50 years. China's central bank also increased its gold reserves to 60.62 million ounces in March from 60.26 million in February.
Another factor which has kept gold prices buoyant has been investors' rising fears that there is too much public and private sector debt, and that another debt crisis may be brewing. The IMF recently estimated global debt at $184 trillion, which is equivalent to 225 percent of GDP in 2017. These calculations are part of the IMF's Global Debt Database, which includes data on public and private debt for 190 countries.
Indeed, there has been a dramatic change in the way institutions view gold ownership today compared to years past. For example, the Bank of International Settlements has given a 0% credit risk weighting for banks that hold bullion. Instead of treating gold as a commodity, BIS views gold as a foreign exchange position, underscoring the perceived safety that gold ownership offers.
Goldman Sachs has even endorsed view that central bank demand is a major reason for expecting higher gold prices in the months ahead. Goldman analysts recently stated they expect gold to gradually move higher based partly on increased purchases from the central banks of China, Russia and Kazakhstan. Growing institutional support for the yellow metal is thus one of several reasons for expecting gold's recovery, which began last fall, to continue well into 2019.
The fact that gold prices have held firm for the last three months even as the U.S. dollar's strength has weakened gold's currency factor is a testament to the metal's institutional support. Gold's near-term outlook would be even stronger, however, if individual retail investors had more of a reason for buying right now. Two reasons which would increase gold's appeal among small investors are a weakening U.S. or global economic outlook and a weaker U.S. dollar index. The first reason is still somewhat of a factor right now since there is still plenty of pessimism to go around on the economic front. The IMF's recently released negative assessment of the world economy is a case in point. It's the second factor, viz. a weaker U.S. dollar, which would do the most to stimulate gold's near-term prospects.
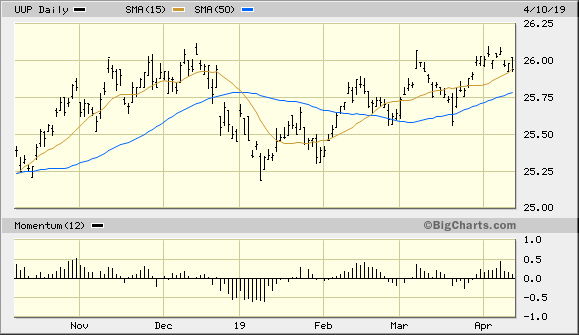
Shown here is the daily graph of the Invesco DB U.S. Dollar Index Bullish Fund (UUP), which can be used as a dollar index proxy. In recent reports I've made the case that a significant drop that pushes UUP's price below its 50-day moving average (blue line) on a weekly closing basis would be a strong rally catalyst for gold. As you can see here, UUP remains above both its 50-day and 15-day moving averages as of Apr. 10. This tells us that for now at least, gold's currency component is still likely too weak to support a sustained rally in the yellow metal's price.

Source: BigCharts
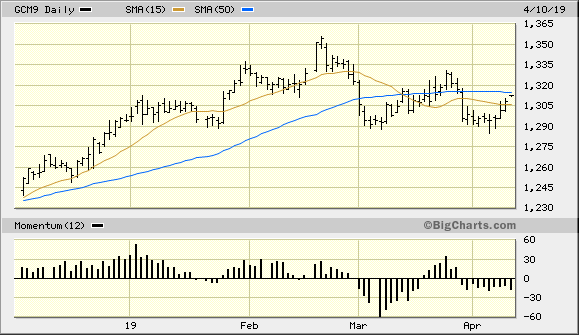
Meanwhile the June gold futures price will technically confirm an immediate-term bottom per the rules of my trading discipline on Thursday, provided it doesn't close below the $1,310.90 level (the Apr. 9 close). A simultaneous drop in the dollar's value while the gold price pushes above its 50-day moving average (blue line, below) would further increase the likelihood that gold has truly broken out and is on its way back to its Feb. 20 high of $1,354.

Source: BigCharts
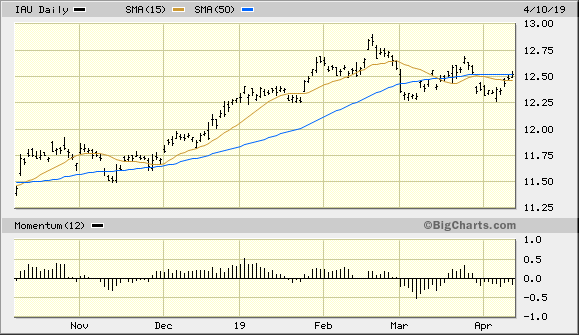
Turning our attention to my favorite gold tracking vehicle, let's take a look at the graph of the iShares Gold Trust (IAU). The IAU price rose conspicuously above its 15-day moving average on Apr. 9, which the first such time this has occurred in several weeks. After the latest rally, IAU has made a preliminary immediate-term bottom signal as of Apr. 10. Provided this signal isn't reversed on the Apr. 11 session with a reversal below the $12.48 level (the initial close above the 15-day moving average), we'll have another entry point for initiating a short-term trading position. More importantly, if IAU can manage to close decisive above its closely monitored 50-day moving average it will increase the strength of its latest trading signal.

Source: BigCharts
On the gold stock front, the benchmark PHLX Gold/Silver Index (XAU) remains below its previous peaks from February and March. The index is in a rising trend above its 50-day moving average, however. A more important factor for the gold mining stock outlook, though, is the need for an improvement in the internal strength of the actively traded mining shares. I touched on this earlier this week when I mentioned that of the 50 most actively traded U.S.-listed gold stocks, many have been making new lows of late. That's a sign that at least some degree of liquidation is underway, and this is a potential near-term negative.
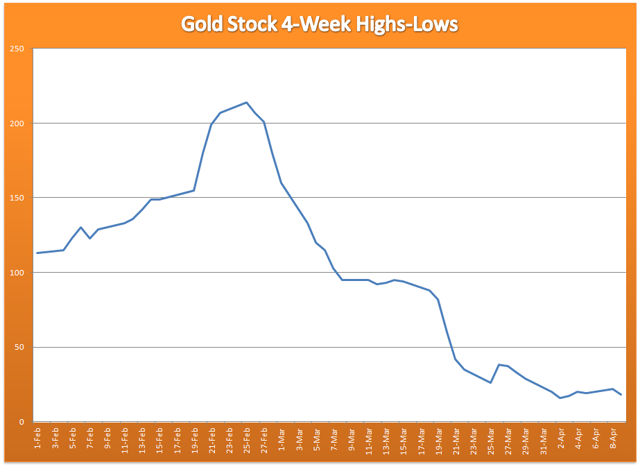
Below is a graph which details the declining trend in the 4-week rate of change (momentum) of the new highs and lows for the 50 most actively traded gold shares. This indicator is based on the net number of publicly listed mining and exploration companies which have made new 52-week highs minus lows on a quarterly basis. As you can see, there is a conspicuous decline in this indicator which is in contrast to the rising trend of the XAU index mentioned above.
Source: WSJ
This negative divergence between the XAU and the highs-lows isn't necessarily a reason to expect lower gold stock prices in the coming weeks. However, until the new highs-lows indicator shows improvement the conservative approach would be to hold off on initiating new long positions in gold stocks. For it's only when the XAU trend is synchronized with the trend of the new highs-lows that it's safe to buy. For now a defensive posture is warranted on the gold mining stocks in the aggregate.
While gold is very close to getting back above its 50-day moving average, we don't quite have an "all-in" buy signal yet. However, the fundamental and technical factors we've discussed here should keep the metal buoyant despite near term cross-currents. The growing appetite for the yellow metal among central banks is providing a fundamentally supportive backdrop for this bullish outlook. Only if the dollar breaks out decisively to a new 52-week high and continues to rise on a sustained basis would I be forced to reevaluate my bullish intermediate-term gold outlook.
On a strategic note, investors are justified in maintaining intermediate-term (3-9 month) long positions in gold based on the prevailing fundamental and psychological factors discussed in this report. Short-term gold ETF traders, however, are still on the sidelines and should wait for the gold price to confirm its latest breakout (as discussed here) before initiating new long positions.
Disclosure: I/we have no positions in any stocks mentioned, and no plans to initiate any positions within the next 72 hours. I wrote this article myself, and it expresses my own opinions. I am not receiving compensation for it (other than from Seeking Alpha). I have no business relationship with any company whose stock is mentioned in this article.
Follow Clif Droke and get email alerts