Gold Outlook: Reversal pattern is forming on daily chart but 20SMA limits recovery
January 22, 2019 / www.fxstreet.com / Article Link
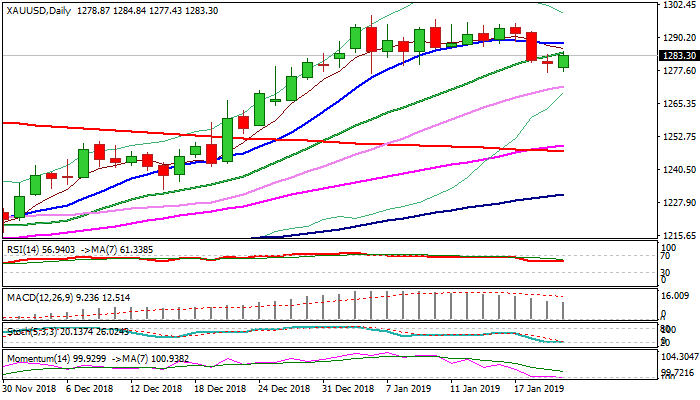
GOLD
Spot gold regained traction and bounced from Asian low at $1277, as renewed risk-off mode on IMF downgrade of global growth forecast increased safe-haven demand. Fresh gains struggle to return above rising 20SMA ($1284), close above which is needed to complete Doji reversal pattern on daily chart and shift near-term focus towards $1287 (10SMA) and $1292 (Friday's high). Flat momentum and slow stochastic on daily chart obstruct recovery for now and the downside would remain vulnerable on today's repeated close below 20SMA. This would keep pivotal supports at $1276/73 (Monday's low / Fibo 38.2% of $1232/$1298 upleg) exposed, with stronger bearish signal to be expected on break here.
Res: 1284; 1287; 1292; 1295 Sup: 1281; 1276; 1273; 1265
Interested in Gold technicals? Check out the key levels
R3 1288.85 R2 1286.24 R1 1281.12 PP 1278.51 S1 1273.39 S2 1270.78 S3 1265.66Recent News
Immediate trigger for crash was new Fed Chairman pick
February 02, 2026 / www.canadianminingreport.com
Gold stocks slump on metal price decline
February 02, 2026 / www.canadianminingreport.com
Is the gold market starting to turn 'irrationally exuberant'?
January 26, 2026 / www.canadianminingreport.com
Gold stocks explode up as equity markets languish
January 26, 2026 / www.canadianminingreport.com
Gold stocks outpace flat large caps
January 19, 2026 / www.canadianminingreport.com