Gold Price Confirmation of the Warning / Commodities / Gold & Silver 2019

 Aftergold’s plunge on Thursday, it made a comeback attempt on Friday. But thaterased only half of Thursday’s vigorous decline. The situation in silver and goldminers doesn’t provide much ground for optimism either. The silent scream wewrote about in the Wednesday’s Alert for our subscribers brought seriousrepercussions. Both immediately and step-by-step as in a trainwreck in slowmotion. Either way you look at it, just in time for our subscribers to reap thebenefits. Today, we will devote extraordinary attention to the USD Index andthe 2012-2013 – today link in gold.
In Thursday’sPart I,we shared with you the short-term check on precious metals sector health. In Friday’sPart II,we examined whether the most recent developments changed the long-term viewanyhow. Those articles were a limited sample of exclusive care our subscribersget on an everyday basis. Today, we will follow up with even more of such apeek under the hood - another sample of what our subscribers already enjoyed onThursday. Whether you are reading this article on our website or elsewhere onthe Internet, we will now share today’s full picture with you, the visitor, onthe USD Index including the Brexit tremors. On top, we will update you on theshort-term implications of the 2012-2013 –today analogy. That will be the cherry on the cake. We’ll also treat you toThursday’s summary that remains up-to-date also today.
Long-termUpdate on the USD Index and the Brexit Curveball
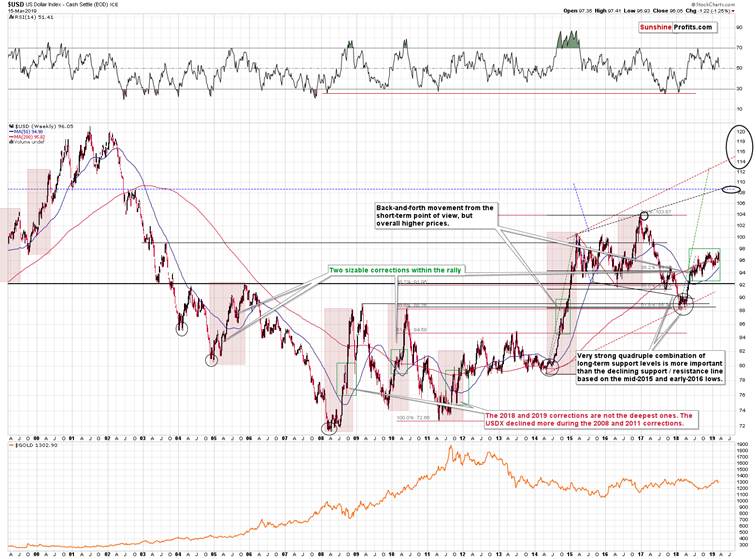
Wealready wrote about the running correction in the USD earlier on Thursday andthe above chart shows what we saw happen during the previous big upswings. In2010 and in 2014 (areas marked with green rectangles), we saw back and forthmovement during which the USD Index still moved higher overall. These runningcorrections took place close to the middle of the rally, a bit closer to itsstart than to its end. Applying this to the current situation suggests a movemuch higher, above the 2017 highs – likely to the 108 level or even slightlyhigher, to the rising blue resistance line based on the 2015 and 2017 highs.
Ofcourse, one may say that the USD can’t rally because of the USdebt and other problems related to the US economy, but… We would like to remind youabout two major things:
TheUS debt situation was not much better in 2014 when the USD Index started itsmassive 20+ index-point rally.TheUSD Index is based on currency exchange rates and the latter are relativevaluations of one currency vs. the other. Two biggest components of the USDIndex are US dollar’s exchange rates with the euro and with the Japanese yen.With all the troubles related to Brexit, the EU debt, therecent dovish comments from the ECB, and Japan’srelentless money printing, it’s not a question if the situation in the US isperfect. It’s a question whether it’s better than in the Eurozone and in Japan(and to smaller extent in other countries). And it doesn’t seem that things arebetter in the EU and Japan than they are in the US. The logic of internationalmoney flows is that money goes there where it’s treated best – and the U.S. isstill the best looking house in a bad neighborhood. And it can accommodatelarge international money flows due to the sheer depth of the Treasury markets.Take a look at the bondyield perspective – the Treasuries carry such yields that make them looklike junk bonds when compared internationally. Or, negative interest ratesanyone?Thelong-term outlook for the USD Index remains bullish and the implications forthe precious metals market remain bearish.
Bythe way, we promised to write a few words on Brexit. Many months ago, when theBrexit vote turned out to really be Brexit and not Bremain, we wrote that thisdoesn’t mean that the Brexit will really take place. The outcome of the votewas shocking to the authorities, which likely thought that this will simply bea formality that ends all the “let’s leave the EU” requests once and for all.And it turned out to be exactly the opposite. We wrote that the Powers That Behave a lot of aces up their sleeves and if there was one thing sure about theBrexit, it’s that it will appear that nothing bad happening happened as aresult of the government. And our bet was that the Brexit will not take placeat all. A lot of time has passed, a lot of discussions took place, and a lothas been done to change the views of the UK citizens. Now, the questionremains, how to design everything so that it still looks like all theauthorities did everything they could to be the best representatives of theirvoters.
Andit seems they found the way. Thisarticle shows what options are being discussed. Quoting:
On the other hand, it’s hard tosay what Parliament would hope to achieve with a delay. EU negotiators havemade it abundantly clear there will no more concessions, whether on an Irishbackstop or any of the other things Brexiteers find objectionable in May’sdeal. There is no doubt the niggling hope among many that somehowBritain—having made such a botch of this initial effort—will drop the whole idea of leaving the EU, or at least put it toanother plebiscite.
May even opened the door to thatspeculation with her comments after the negative vote, looking ahead toThursday’s choice of an extension. “The EU will want to know why we want thatextension," she said. "Thehouse will have to answer that question: does it want to suspend Article 50,does it want a second referendum, or does it want another deal, but not thisdeal.”
So,we have a situation in which there is no Brexit or there is Brexit on someother terms. Terms that are not realistic, because nobody wants to agree on thesame terms. The EU wants to teach the UK a lesson and show everyone else thatleaving the EU is a really bad and costly idea, and the UK doesn’t want to bearBrexit’s huge cost. They just can’t “cancel” Brexit without losing face infront of the voters, so they will keep pushing different terms and disagreeinguntil people panic and agree to some kind of compromise…
Whatis the compromise? Another vote. Only that this time it will end with the“right” choice and this time the choice will never be seriously questioned, andit will be viewed as final. To be clear, there will be voices of opposition,but nobody will take them seriously. Of course, there are no guarantees that itwill happen in this way, but that’s how I – PR – see it.
Howcould gold react to the above? Initially some volatile short-term swings, butoverall gold should plunge on the Bremain scenario, just like it soared on theBrexit vote. Bremain means more stability and it means that all the UK-relatedpolitical turmoil from the recent years would come to an end. The implicationsof the fact that a second referendum is being openly mentioned are bearish forthe gold price and for the rest of the precious metals market. All the Brexitsaga can be considered kind of a geopoliticalfactor in gold price determination: the key takeout is that theeffect of geopolitical concerns on the gold market tends to be overstated andof limited shelf life. Technical analysis is of a more lasting importance andwe invite you to examine for yourself our GoldTrading Tips.
Havingsaid that, let’s turn to the promised analytical dessert – the update on theshort-term implications of the 2012-2013 – now link.
Updatingthe 2012-2013 – Now Link in Gold
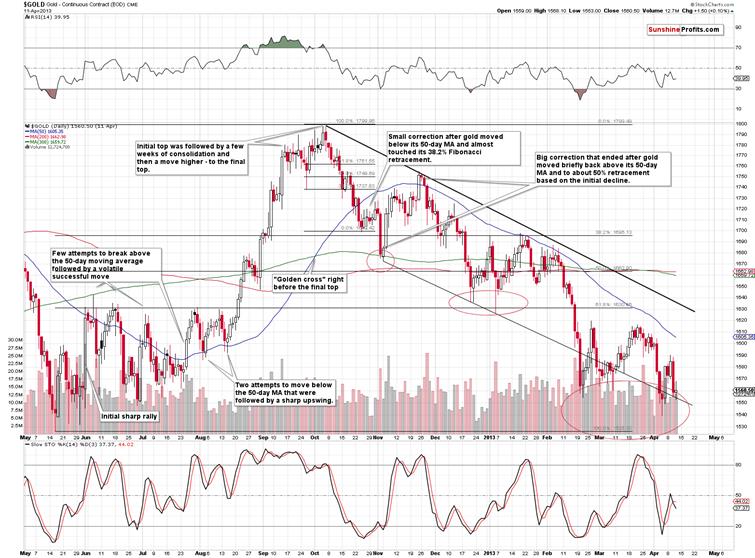
Basedon how similar the situation is now to how it was in 2012 from both: broad andshort-term perspectives, wepreviously created a series of target areas for gold. We wrote that thesetargets are just “default” values that will need to be adjusted as additionaldetails become available.
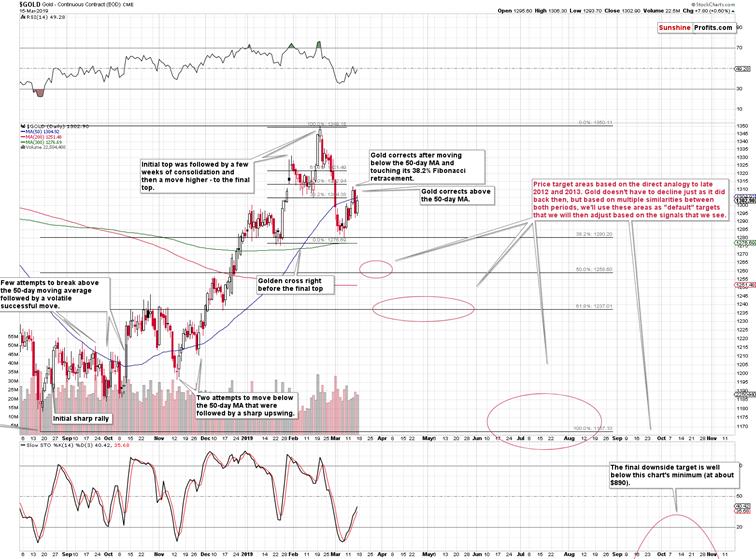
Wednesday’srally and the subsequent unsuccessful comeback attempt on Friday was one ofthose details. Gold moved above its 50-day moving average – something that in2012 meant that the initial sizable corrective upswing was over – it happenedin late November 2012. After this top, gold declined until reachingapproximately the 61.8% Fibonacciretracement based on the previous upswing, which corresponded roughly to previous localhighs. Right now, the analogous price level based on these techniques isapproximately $1,240. Does it mean that gold is likely to slide there shortly?It’s quite possible.
However,it’s still possible that gold is actually repeating only the very initial partof the upswing that is about to take gold to the 50% Fibonacci retracementfirst – just like what we saw in early November 2012. The key difference betweenboth rallies: the tiny late-October 2012 one and the bigger November 2012 oneis the level that was reached and the sharpness of the initial decline. Theinitial downswing was sharper this time, which means that the initialcounter-trend rally (just like the one that we saw in late October 2012) mighthave been also more volatile than the previous one. Therefore, the move abovethe 50-day goldmoving average is not necessarily something that implies that thebig corrective upswing is already over. That’s why we wrote that the move to$1,240 is only “quite possible”, instead of writing that it’s very likely. Tobe clear – it is very likely in the following several weeks regardless of thevery short-term outcome, and what we’re discussing is whether we’ll see itreally shortly (in a week or two) or not.
Theimplications are that when gold moves to$1260, it may not necessarily be the best decision to enter long positions ingold. At least not without meaningful confirmations. If the USD Index isgoing to break above the 2017 highs and confirm this move shortly, then gold islikely to drop significantly before we see any corrective upswing. This maymean a move to at least (!) $1,240 before we see even a weekly correction. Thiswould almost certainly not be the end of gold’s decline, but it could be atradable opportunity to benefit from the rebound.
Atthis time, we have two short-term scenarios that seem probable and they bothend with gold at much lower levels, but the shape of the decline differs. Itwill be important to either monitor the short-term developments closely, orsimply decide in advance to wait out any short-term strength while focusing onthe bigger decline. As a default decision, we will stick with the trend that ismost reliable (medium-term downtrend), but if we see strong bullishindications, we may enter a quick long position in the meantime.
Onemore thing before summarizing. Our subscribers surely recall the gold chartthat we featured on March 1st that had a different visual style thanwhat we usually provide. We’ll share it with you, our visitor, now.
Weput question marks on the above chart as what gold did might have potentiallyresulted in a head-and-shoulderstop in gold.Gold moved below the green support area and we were right not to close theposition at that time, but it turns out that the above might prove to beaccurate in terms of shape and in terms of the H&S pattern in general. Theright shoulder of the formation would be provided by the March upswing and thedecline that seems to have started on Wednesday and continued on Thursday. Oncegold confirms the breakdown below approximately $1,275, we’ll have a bearishhead and shoulders pattern and the downside target would point to a decline toabout $1,215. Naturally, the formation is not yet in place, so all the above isjust a potential move. Pattern analysis forms animportant part of the technical arsenal at our disposal. Still, this is yetanother factor that shows it might be a good idea to keep the short positionintact until strong bullish signs emerge to the contrary.
Summary
Summingup, it’s almost certain that the next big move lower has already begun and thatthe 2013-like slide is in its early stage. Based on the updatedversion of the 2013-now link, the implications are even morebearish than we had initially assumed. The downside target for gold remainsintact ($890), and the corrective upswing that we just saw seems to be rathernatural part of the bigger move lower – not a beginning of an important movehigher. And it seems that the correctivemove higher in the PMs is either over or about to be over shortly.
If you’d like to receive follow-ups to the aboveanalysis, we invite you to sign up to our gold newsletter. You’ll receive ourarticles for free and if you don’t like them, you can unsubscribe in just a fewseconds. Signme up!
Thank you.
Przemyslaw Radomski, CFA
Founder, Editor-in-chief
Toolsfor Effective Gold & Silver Investments - SunshineProfits.com
Tools für EffektivesGold- und Silber-Investment - SunshineProfits.DE
* * * * *
About Sunshine Profits
SunshineProfits enables anyone to forecast market changes with a level of accuracy thatwas once only available to closed-door institutions. It provides free trialaccess to its best investment tools (including lists of best gold stocks and best silver stocks),proprietary gold & silver indicators, buy & sell signals, weekly newsletter, and more. Seeing is believing.
Disclaimer
All essays, research and information found aboverepresent analyses and opinions of Przemyslaw Radomski, CFA and SunshineProfits' associates only. As such, it may prove wrong and be a subject tochange without notice. Opinions and analyses were based on data available toauthors of respective essays at the time of writing. Although the informationprovided above is based on careful research and sources that are believed to beaccurate, Przemyslaw Radomski, CFA and his associates do not guarantee theaccuracy or thoroughness of the data or information reported. The opinionspublished above are neither an offer nor a recommendation to purchase or sell anysecurities. Mr. Radomski is not a Registered Securities Advisor. By readingPrzemyslaw Radomski's, CFA reports you fully agree that he will not be heldresponsible or liable for any decisions you make regarding any informationprovided in these reports. Investing, trading and speculation in any financialmarkets may involve high risk of loss. Przemyslaw Radomski, CFA, SunshineProfits' employees and affiliates as well as members of their families may havea short or long position in any securities, including those mentioned in any ofthe reports or essays, and may make additional purchases and/or sales of thosesecurities without notice.
Przemyslaw Radomski Archive |
© 2005-2019 http://www.MarketOracle.co.uk - The Market Oracle is a FREE Daily Financial Markets Analysis & Forecasting online publication.