Gold Price Forecast to Exceed $10,000/Ounce / Commodities / Gold & Silver 2019

 Before making an investment decision, every investor should understand true inflation. But what is true inflation? Currently, inflation is measured using a floating basket of goods in the Consumer Price Index (CPI), which continues to understate true inflation.
Two useful tools fordetermining true inflation figures are John Williams’s Shadow Statistics andthe Chapwood Index. John Williams, arenowned economist, provides excellent insights about the severity of misstatedinflation rates. Using a fixed basket from 1980 to compare to today’s pricesdetermines that inflation is actually 9.46%, not 1.75% as represented by theCPI. Exhibit A provides a visual interpretationof discrepancies between reported inflation and true inflation.
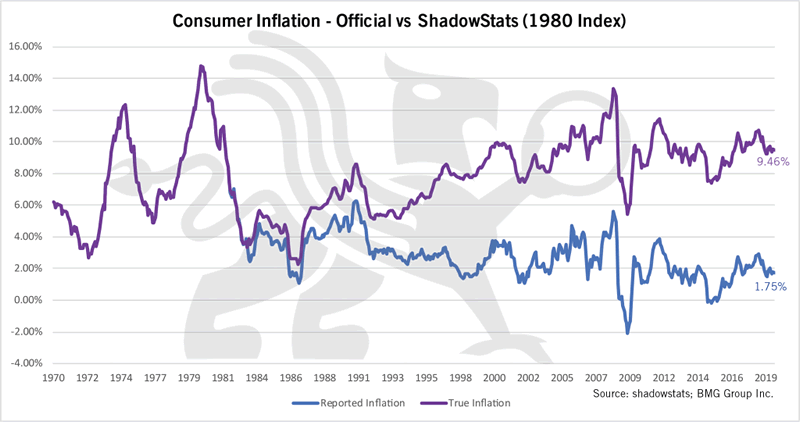
Exhibit A
To put this into perspective,we will use an example that affects many investors daily. Assuming inflation isheld at 2% (as desired by many economies), a bond yielding 3% would return 1%after the effects of inflation were taken into consideration. However, usingJohn Williams’s true measure of inflation (9.46% in this case), an investorwould quickly realize that they are losing 6.46% in annual purchasing power byholding onto the bonds. This is extremely valuable to investors, because itgoes against many conventional investment strategies displayed in the media.Understanding the true effects of inflation could be the difference betweencapital gains and capital losses for your portfolio.
Inaddition to ShadowStats, the Chapwood Index is a great tool for measuring real costof living increases, because it calculates the top 500 items Americans spendtheir after-tax dollars on in the 50 largest cities of the nation[1]. The Index reports the actualprice increase of the top 500 items with no seasonal adjustments and focuses onreal price changes. The average stated inflation rate among the 50 largestcities within the Index determined that true inflation is 10.7%, also muchhigher than the 1.75% reported by the CPI. Like the example previously used,investors would be losing purchasing power by holding onto investment vehicleswith yields lower than 10%.
Gold Is Not Simply A Disaster Hedge
Acommon misconception about gold is that it is simply a hedge against disasters.Although gold acts as a strong hedge against disaster, there are manyadditional benefits of holding gold that are rarely covered in mainstreammedia. Holding at least 10% of a portfolio in gold will reduce volatility andimprove returns. Because the risks of a market crash are significant, theminimum gold allocation today should be 20%.
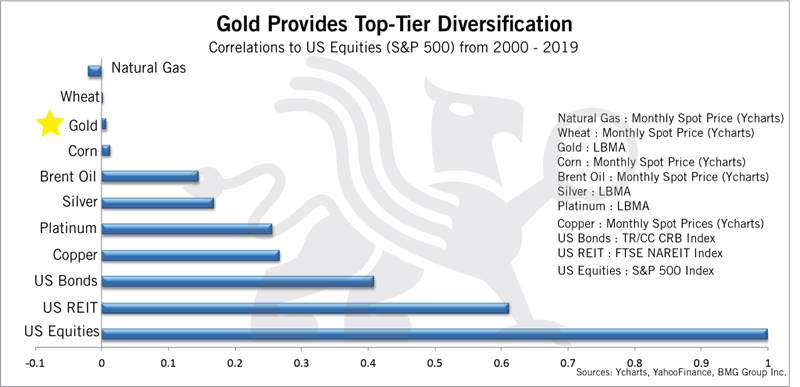
Exhibit B
ExhibitB showsthe correlation of various asset classes against US equities, which isimportant due to the typical weightings the equities carry within an investor’sportfolio. A portfolio consisting of 60% equities and 40% bonds is a commoninvestment allocation used within the marketplace today. Unfortunately, thisdoes not result in a fully diversified portfolio. According to Ibbotson &Associates, stocks and bonds have been correlated since 1969. If a marketcorrection were to occur, both equities and bonds would suffer declines and, asa result, a 60/40 portfolio is not fully diversified. Analyzing the table aboveshows that gold carries almost no correlation to US equities, and thus is anexcellent tool for truly diversifying your portfolio. If the economicindicators pointing towards an economic downturn prove to be correct, then goldis one of the best available methods for protecting your capital.
Asecondary benefit of gold is its ability to preserve purchasing power. This isextremely important across many demographic categories, but may be mostimportant for those planning their retirements. Upon retirement, theopportunity to increase your net worth begins to diminish, and makes loss ofcapital much more detrimental due to lack of time to recover from losses. On aninflation-adjusted basis, it took until 1984 to break even following the 1929crash. Exhibit C is a usefultable for displaying gold’s ability to maintain purchasing power throughouthistory. The table compares how many ounces of gold were required to buy a car,a home, or a share of the Dow Jones. Comparing the figures, it is evident thatless gold is required now than in 1971 when looking to make each of thepurchases. This indicates that gold maintains and even strengthens inpurchasing power over time, which cannot be said for simply holding cash orbonds throughout the investment horizon.
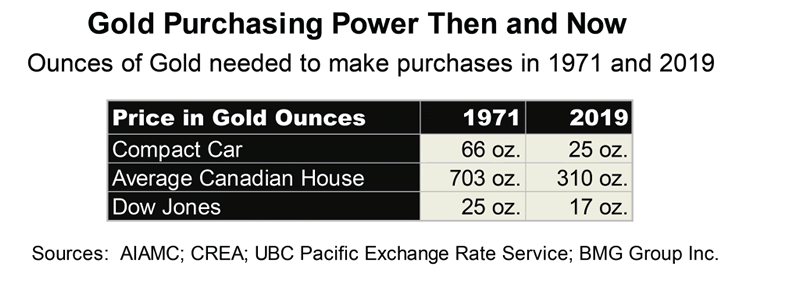
Exhibit C
ExhibitD looksat the central bank holdings of gold and how they have evolved. It is evidentthat up until 2007, the central banks were net sellers of their gold reserves;however, the financial crisis of 2008 forced the central banks to become netbuyers of gold. This shows the increased fear of a potential currency crisis,which can be accounted for by increasing consumer and government debt levelsthat have continued to increase even after the 2008 crisis. Quantitative easing(QE)was used during the 2008 recession to aid the economy; however, at currentdebt levels, additional QE will continue to hurt world currencies, and willpush gold on its continued upward trend.
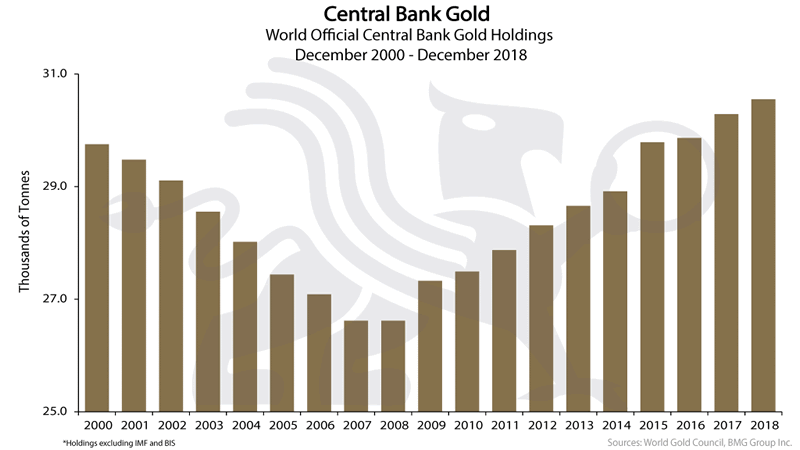
Exhibit D
Gold’s Performance in World Currencies
Theperformance of gold across various currencies is set out in the table below.
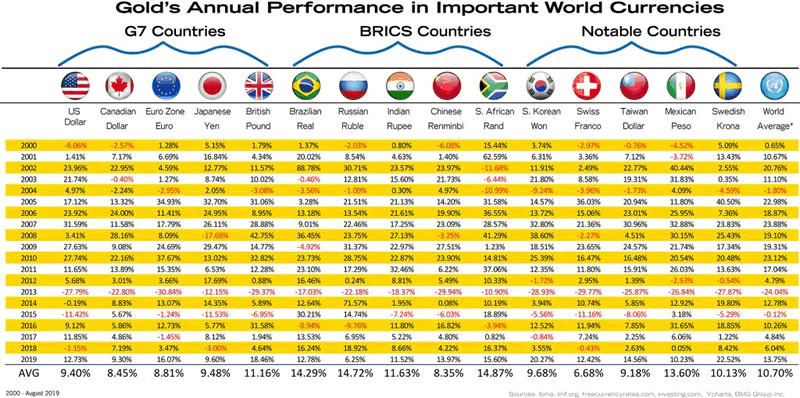
Exhibit E
Thetable above indicates that the average annual increase across all currencies isaround 11% annually since 2000. Given that many investor and pension portfolioshave not come close to this level of performance, it should be obvious toeveryone how adding gold will improve their portfolio.
Finally,as equities are viewed as the superior investment vehicle by many investors andadvisors, the performance of gold, as well as all asset classes, excludingcollectibles, is shown below in Exhibit F.
Periodic Table of Asset Classes
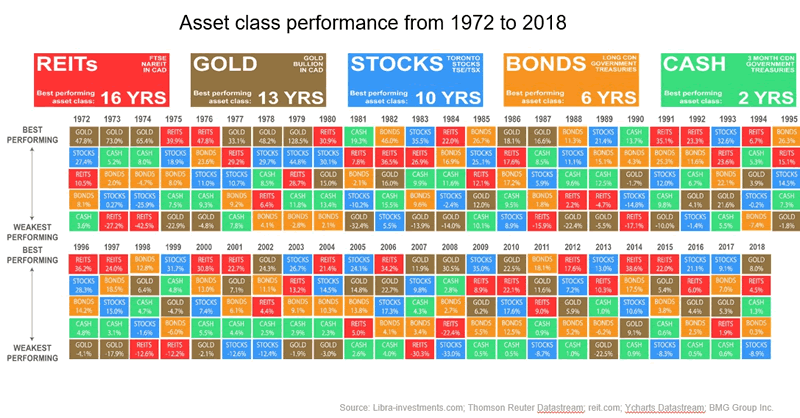
Exhibit F
Even when gold is compared to what manyinvestors and advisors believe is the best investor—Warren Buffett’s BerkshireHathaway— it has underperformed gold.
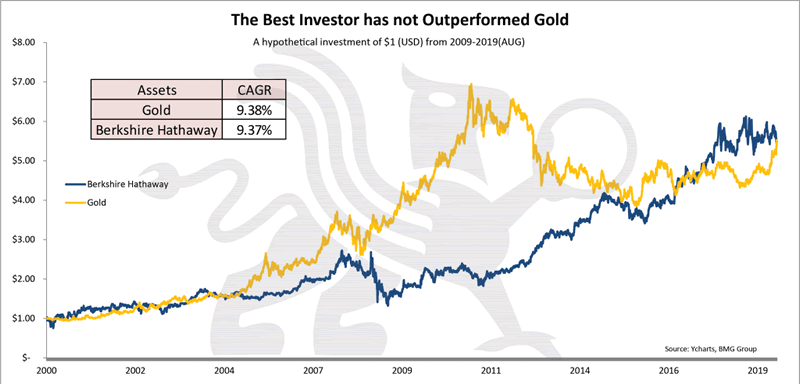
Exhibit G
To many, Buffett is one of the greatestinvestors of our generation, and potentially the greatest value investorthroughout history. Buffett’s flagship conglomerate Berkshire Hathaway is ahighly desirable asset to own, but at over US$315,000/share, with no dividends,the price tag to own is hefty. Exhibit G shows the returns of golddirectly compared to the returns from Berkshire Hathaway. As displayed above,gold has achieved a slightly greater CAGR (9.38%) than Berkshire Hathaway(9.37%). Although the returns are similar throughout the 19-year investmenthorizon, the underlying meaning to the graph is important. It implies that anindividual investor would have to achieve superior results to Buffett’s byeither hiring an advisor or by investing on their own, which is no easy feat.However, as an alternative, gold can achieve a slightly higher return over thelifetime of the investment and, does not carry many of the risks paired withsecurities selection.
WhyGold Is Rising
Gold’s performance throughout 2019 has been excellent, as it has returned 22% for investors, which is superior to S&P returns of 13.9%. This section focuses on certain elements that are accountable for the rise of gold throughout the year. These elements consist of central bank purchases, negative yield bonds, negative real interest rates, the triple bubble in stocks, bonds and real estate, and rising debt levels within western countries.
A primary reason for gold’s continued increasein price has been purchases from central banks. As previously discussed, ExhibitD displays the amount of gold purchases throughout history. The transitionfrom net sellers to net buyers has led to increasing levels of demand for gold.As central banks continue their purchasing programs in order to hedge against currencyrisks, a continued catalyst for gold appreciation stays readily available.
An additional reason for the appreciation ofgold focuses on the $13 trillion of debt with below-zero yields. Recently,countries such as Austria, Sweden, France, Japan and Germany joined the club ofgovernment debt with 10-year yields below zero[2].To put this into perspective, negative-yielding debt now comprises 24% of totalinvestment-grade bonds in the market. This points out many underlying pessimisticsignals, and central banks are trying to resolve the issues by reducinginterest rates. However, already low interest rates are presenting a liquiditytrap issue for countries. The issues arising from the current liquidity trapprovide a strong backing for gold appreciation, as QE will only further riskcurrency devaluation, which would see gold’s upward trend continue.
Furthermore, gold is rising due to the triplebubble that exists within stocks, bonds, and real estate asset classes. Movingback to our earlier discussion with respect to Exhibit B, gold’s low andalmost negative correlation to these asset classes signifies that it shouldn’tmove in same downward direction upon the collapse of these three asset classes.
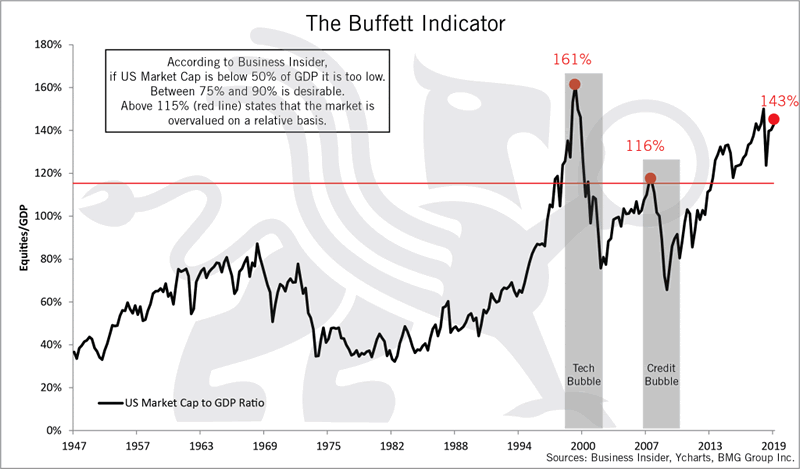
Exhibit H
The equity portion of the triple bubble has many indicators, such as Tobin’s Q Ratio and CAPE ratio that are pointing towards an economic downturn, and many of these signals can be viewed on our DIY investor page[3]. Exhibit I is an excellent example of one of the equity market indicators that is pointing towards a downtrend. The Buffett Indicator focuses on the ratio of market cap to GDP, and is seen as one of the best indicators for determining over-valued equity markets. As displayed, the ratio is currently at 143%, which is significantly higher than the ratio was at the time of the 2008 credit bubble (116%), and slightly less than the tech bubble (161%). The Buffett Indicator has proven to be a leading indicator for market bubbles such as the tech and credit bubble, and at current levels, the indicator is signifying that we are in another equity bubble.Exhibit H
Many of the world’s top financial experts, suchas Alan Greenspan, Ray Dalio, Jim Rickards, David Stockman and Kyle Bass, haveconcluded that the next market crash will be worse than 2008, and some concludethat it may even be worse than 1929.
In relation to negative bond yields andnegative yielding bonds, the second portion of the triple bubble focuses onproblems facing the bond market. The historical average for Canadian interestrates is 4.83%, and would prove to be an unsustainable metric in today’seconomy. As portrayed in the media, simple 0.25% movements in interest ratescan cause massive fluctuations across many markets. Exhibit I identifiesthat if interest rates were to move in line with their historical average, amassive economic collapse could result. Althoughit would be nearly impossible to attain these interest rates without aneconomic collapse, it points towards the necessity for an upward trend ininterest rate hikes, which would reduce lending and slow growth for the economyas a whole. Gold’s stable growth and limited correlation provide stable hedgesfor both of these asset classes.
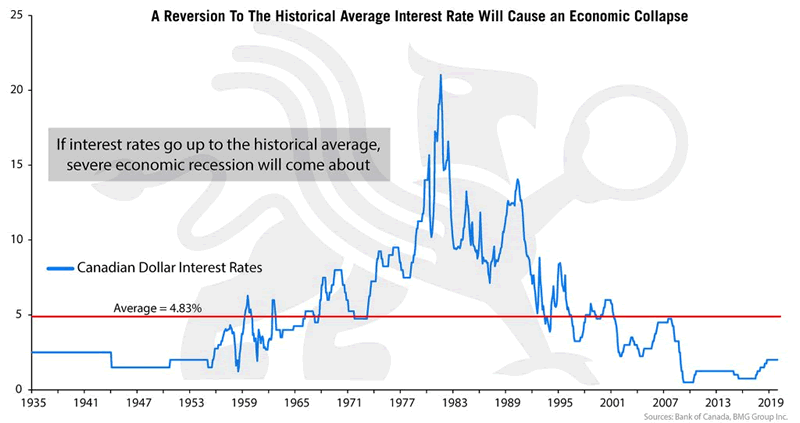
Exhibit I
The problem becomesexponential when analyzing the increasing debt levels facing western countries.Historically low interest rates have encouraged excessive lending by financialinstitutions, and has led to increasing debt at all levels within the economy.Leading up to the 2008 crash, interest rates were low and excessive lending wastaking place. However, following the 2008 crash, debt levels only continued togrow for western countries, which is causing increased uncertainty within theeconomy.
Finally, home prices arepointing towards a potential bubble that is occuring within real estatemarkets. Exhibit J utilizes the S&P/Case-Shiller U.S. National HomePrice Index, which measures U.S. residential real estate prices across 20metropolitan regions. Considering the circumstances of the 2008 recession, whichwas predominately caused by a housing/mortgage crisis, one would assume thatinvestors would have learned a lesson.
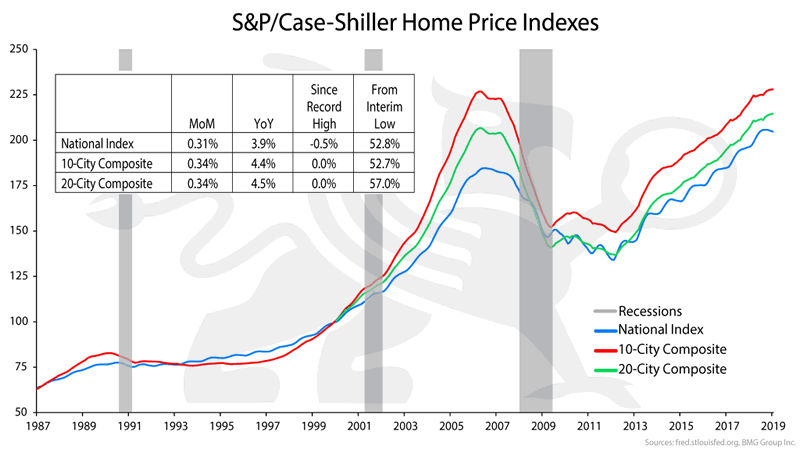
Exhibit J
However, as the above chartdisplays, home prices have now surpassed the 2007 level that led to the 2008recession. If history follows a similar path, real estate is poised for a majordecline.
WhyGold Is Poised to Go Higher
Ever since President Nixon abandoned the goldstandard in 1971, there have been significant attempts by multiple investmentinstitutions and media outlets to portray a negative bias against gold. Due toyears of negative publicity, many investors hold a negative bias towardsholding gold, or are unaware of the benefits of holding gold. The averageinvestor has been steered away from gold, which is resulting in limitedparticipation from pension funds and the public. Historically, it wasadvantageous to hold at least 5% gold within a portfolio in order to trulydiversify. Currently, pension funds only hold a 0.5% portfolio allocation,which is alarming considering the unfunded liabilities facing many of thesefunds. Exhibit K displays gold as a percentage of global financialassets, and displays the changes from 1960 until now. As discussed, it washistorically desirable to hold at least 5% gold within a portfolio, but at theend of 2018, gold only accounted for 0.5% holdings.
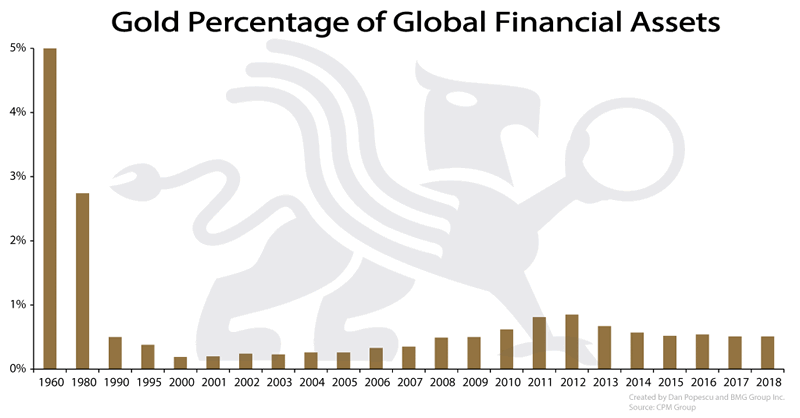
Exhibit K
When I wrote $10,000 Gold: Why Gold’s Inevitable Rise Is the Investor’s Safe Haven in 2013, I felt like a lone wolf in the wilderness with my prediction. Today, Pierre Lassonde has predicted $25,000 gold, and Jim Rickards $40,000 gold. While the predictions seem far-fetched to many investors, if we analyze the available supply of gold and the amount of financial assets in the marketplace, then we can attain a reasonable prediction for the gold price. There is a total of about $300 trillion in financial assets, consisting of stocks and bonds. While there is about $7.78 trillion of aboveground gold, only $1.64 trillion is investment-grade bullion. The remaining gold is typically found in jewellery ($3.7 trillion), official sectors ($1.34 trillion) or other sectors ($1.1 trillion). Of the $1.64 trillion of bullion, no one knows how much is held by the world’s richest families, such as the Rothschilds. This privately held bullion would not be exchanged for fiat currencies, regardless of the price. However, even if you assume that the entire $1.64 trillions’ worth of bullion were available, if 5% of investors in financial assets decided to allocate to bullion, that would equate to $15 trillion of demand. Since mine supply has been in decline, and it takes about 20 years to bring a mine from discovery to production, the only way you can divide $15 trillion into $1.64 trillion is for the price to go up to $11,500/oz.
[1] http://www.chapwoodindex.com/
[2] https://www.bloomberg.com/news/articles/2019-06-21/the-world-now-has-13-trillion-of-debt-with-below-zero-yields
[3] https://bmgdiyinvestor.com/
By Nick Barisheff
Nick Barisheff is the founder, president and CEO of Bullion Management Group Inc., a company dedicated to providing investors with a secure, cost-effective, transparent way to purchase and hold physical bullion. BMG is an Associate Member of the London Bullion Market Association (LBMA).
Widely recognized as international bullion expert, Nick has written numerous articles on bullion and current market trends, which have been published on various news and business websites. Nick has appeared on BNN, CBC, CNBC and Sun Media, and has been interviewed for countless articles by leading business publications across North America, Europe and Asia. His first book $10,000 Gold: Why Gold’s Inevitable Rise is the Investors Safe Haven, was published in the spring of 2013. Every investor who seeks the safety of sound money will benefit from Nick’s insights into the portfolio-preserving power of gold. www.bmgbullion.com
© 2019 Copyright Nick Barisheff - All Rights Reserved Disclaimer: The above is a matter of opinion provided for general information purposes only and is not intended as investment advice. Information and analysis above are derived from sources and utilising methods believed to be reliable, but we cannot accept responsibility for any losses you may incur as a result of this analysis. Individuals should consult with their personal financial advisors.
© 2005-2019 http://www.MarketOracle.co.uk - The Market Oracle is a FREE Daily Financial Markets Analysis & Forecasting online publication.