Gold Price Is Facing Triangle Pattern Resistance / Commodities / Gold and Silver 2018

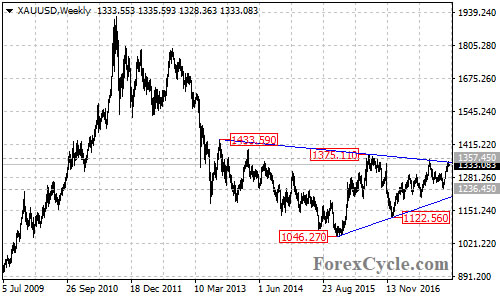
XAUUSD is facing the resistance of theupper trend line (now at around 1343.00) of the triangle pattern on its weeklychart once again. Being contained by the trend line, the gold price pulled back from 1344.65.
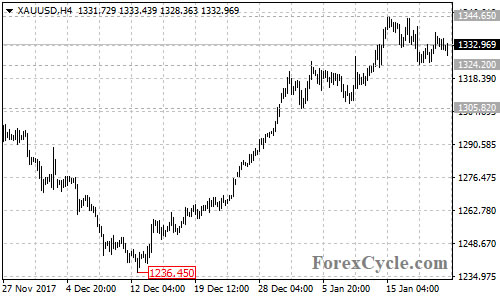
Let’s look into the 4-hour chart, the fallfrom 1344.65 is likely consolidation of the uptrend from 1236.45. Deeperdecline towards 1305.82 key support would likely be seen in the coming days. Aslong as this level holds, the uptrend could be expected to resume and anotherrise is still possible after the consolidation.
A breakout of 1344.65 resistance couldbring price to next resistance level at 1357.45. Above this level could triggerfurther upside movement towards 1375.11, followed by 1433.59.
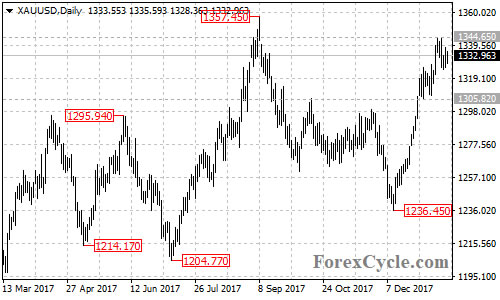
Near term support is at 1324.20. Abreakdown below this level could bring price back to test the key support at1305.82. Only breakthrough this level will indicate that the upside movementfrom 1236.45 had completed at 1344.65 already and lengthier sideways movementin the triangle pattern is underway, then the following downside movement couldtake price towards the lower trend line of the triangle pattern now at around1205.
Technical levels
Support levels: 1324.20, 1305.82, 1236.45,1205.00.
Resistance levels: 1344.65, 1357.45,1375.11, 1433.59.
This article is written by Franco Shao, a senior analyst at ForexCycle.
© 2018 Copyright Franco Shao - All Rights ReservedDisclaimer: The above is a matter of opinion provided for general information purposes only and is not intended as investment advice. Information and analysis above are derived from sources and utilising methods believed to be reliable, but we cannot accept responsibility for any losses you may incur as a result of this analysis. Individuals should consult with their personal financial advisors.
© 2005-2018 http://www.MarketOracle.co.uk - The Market Oracle is a FREE Daily Financial Markets Analysis & Forecasting online publication.