Gold Price Reversal Is the Name of the Game / Commodities / Gold and Silver 2021

When the USDX declines, the PMsusually celebrate and rise as a result. However, this was not the caseyesterday – and we can’t ignore it.
“Reversal” is the name of the game, atleast when it comes to the precious metals market.
The USD Index declined profoundly onceagain yesterday (May 18), and gold, silver, and mining stocks ignored thismove. They didn’t want to follow in its footsteps anymore.
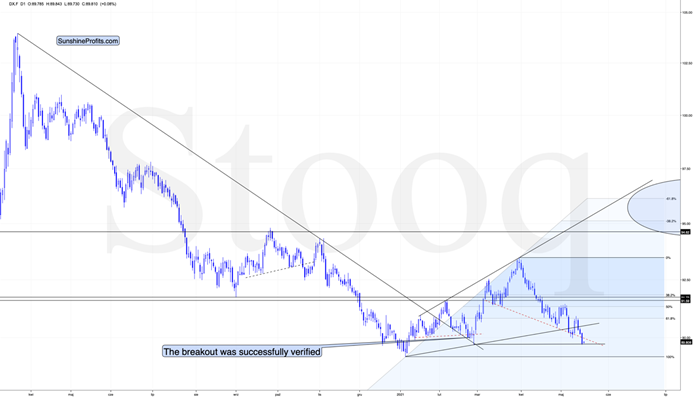
As you can see, the USD Index reached itshorizontal support provided by the previous important low. Low that was formedafter a fake breakdown below the neck level of a supposedly bearishhead-and-shoulders pattern. The USDX is not only at similar price levels; it’salso right after a supposedly bearish breakdown below. The reversal could bejust around the corner, or we might have already seen it, given today’s (small,but still) pre-market move higher.
As I mentioned above, yesterday’s sizabledecline in the USDX should have triggered substantial rallies in the PMs. Whathappened instead?
Reversals .
WhatHappened to Gold?
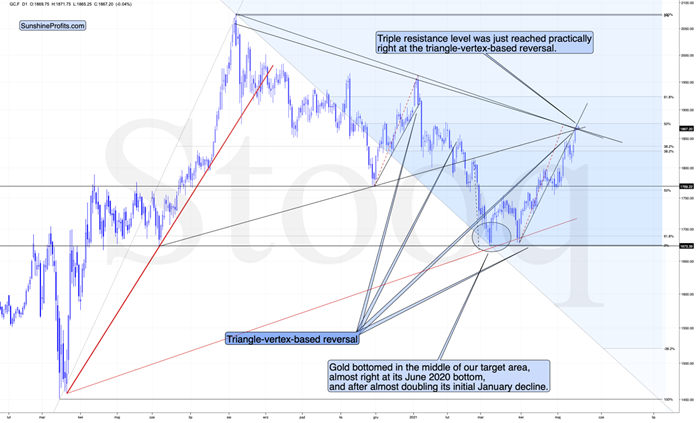
Gold reversed right at itstriangle-vertex-based… well, reversal, and the combination of resistance lines.
The reversal in gold took place aftergold moved very close to its mid-January highs and the 50% Fibonacciretracement based on the August 2020 – March 2021 decline.
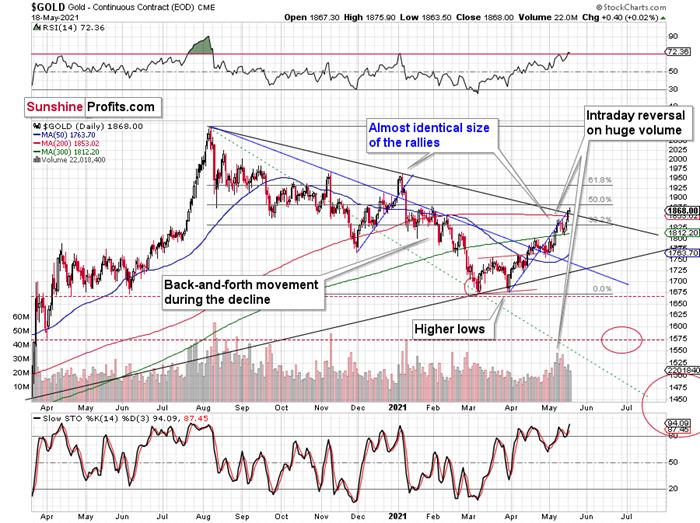
The sizes of the current rally (takingthe second March bottom as the starting point) and the rally that ended at thebeginning of this year are practically identical at the moment.
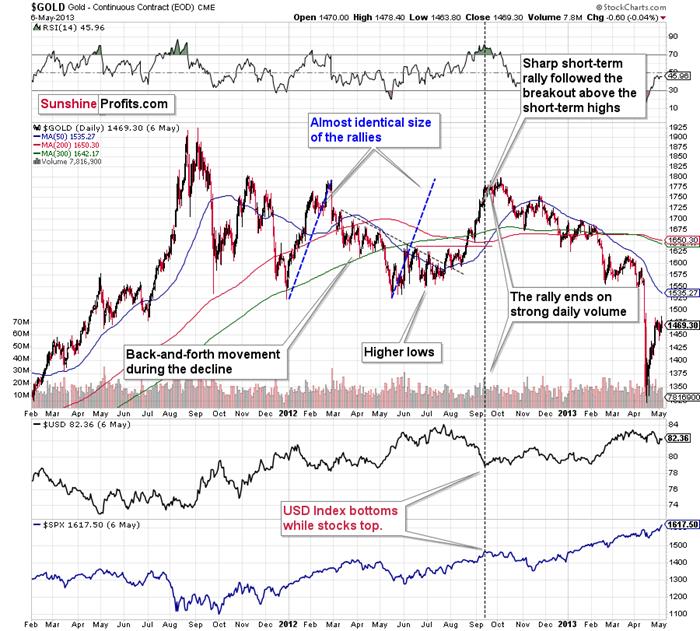
Just as the rallies from early 2012 andlate 2012 (marked with blue) were almost identical, the same could happen now.
The March 2021 low formed well below theprevious low, but as far as other things are concerned, the current situationis similar to what happened in 2012.
The relatively broad bottom with higherlows is what preceded both final short-term rallies – the current one, and the2012 one. Their shape as well as the shape of the decline that preceded thesebroad bottoms is very similar. In both cases, the preceding decline had someback-and-forth trading in its middle, and the final rally picked up pace afterbreaking above the initial short-term high.
Interestingly, the 2012 rally had endedin huge volume, which is exactly what we saw on Friday. To be 100% precise, the2012 rally didn’t end then, but it was when over 95% of the rally was over.Gold moved very insignificantly higher since that time. Most importantly,though, it was the “dollars to theupside, hundreds of dollars to the downside” situation. And it seems that weare in this kind of situation right now once again.
Interestingly, back in 2013 gold startedits gargantuan (…) slide from about $1,800 and it is not far from this levelalso today.
Moreover, let’s keep in mind that the RSI indicator just topped slightly above 70, which is what tends to happen when gold tops.The upside seems very limited. In fact, it seems that the top in gold isalready in.
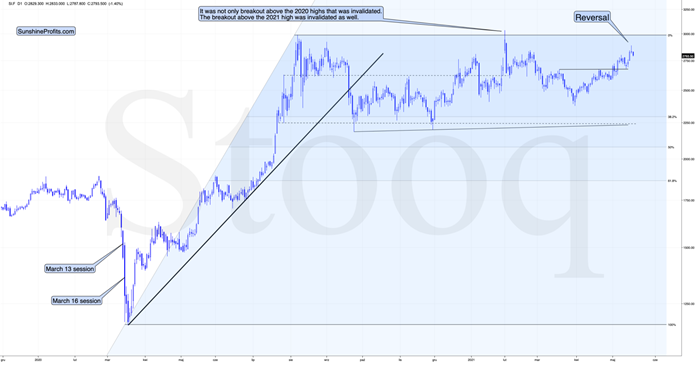
The lower part of the above chart showshow the USD Index and the general stock market performed when gold ended itslate-2012 rally and was starting its epic decline. In short, that was when theUSD Index bottomed, and when the general stock market topped. I don’t want toget into too many USD-related short-term details, as Idid that yesterday, but let’s take a closer look at the short-termdevelopments on the stock market .
StockMarket
In short, the situation doesn’t lookpretty. To explain, I wrote the following on May 11:
Themarkets are self-similar (which is another way of saying that they have afractal nature), which generally means that while the history tends to rhyme,it also tends to rhyme in similar shapes of alike or various sizes.
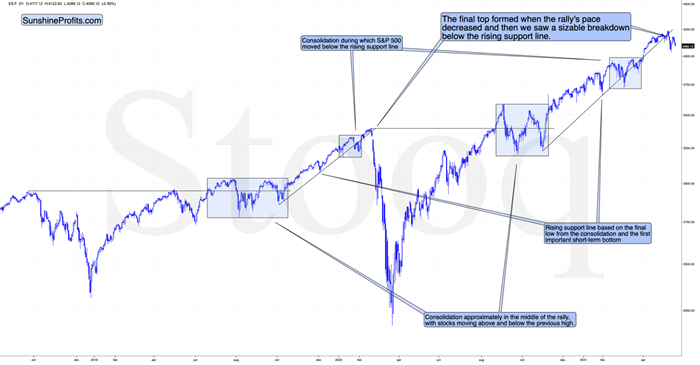
Forexample, the rally from 2018–2020 seems very similar to the rally from 2020 tothe present. Both rallies started after a sharp decline, and the first notablecorrection took the form of back-and-forth trading around the previous high. Imarked those situations with big rectangles.
Thenthe rally continued with relatively small week-to-week volatility. I createdrising support lines based on the final low of the broad short-termconsolidation and the first notable short-term bottom.
Thisline was broken, and some back-and-forth trading followed, but it was onlyabout half of the previous correction in terms of price and time.
Then,we saw a sharp rally that then leveled off. And that was the top . The thing thatconfirmed the top was the visible breakdown below the rising support line rightafter stocks invalidated a tiny breakout to new highs. That’s what happened inFebruary 2020, and that’s what happened this month.
“Time is more important than price; whenthe time comes, the price will reverse”. Both rallies took an almost identicalamount of time: 60 weeks vs. 59 weeks.
Stocks moved a bit higher recently, butyesterday’s and today’s pre-market decline seem to be telling investors thatthe initial slide was not just another correction in the bull market. This isthe first time when the S&P 500 was unable to get back above its risingsupport line after temporarily breaking below it. Instead, we saw an attempt torally, and now we see another slide lower.
This is bearish for gold’sforecast , but also very bearishfor silver and mining stocks, which are more correlated with the stock marketthan gold is.
Speaking of silver, let’s take a look atits price chart.
The white metal has clearly reversedyesterday (May 18), and at the moment of writing these words, it’s trading backbelow its May 10 high and the $28 level. Just like it is the case with gold, itseems to me that the outlookfor silver is bearish.
Mining stocks seem to have reversed in arather odd manner, but in one that’s ultimately in tune with how tops areformed based on technicalanalysis principles.
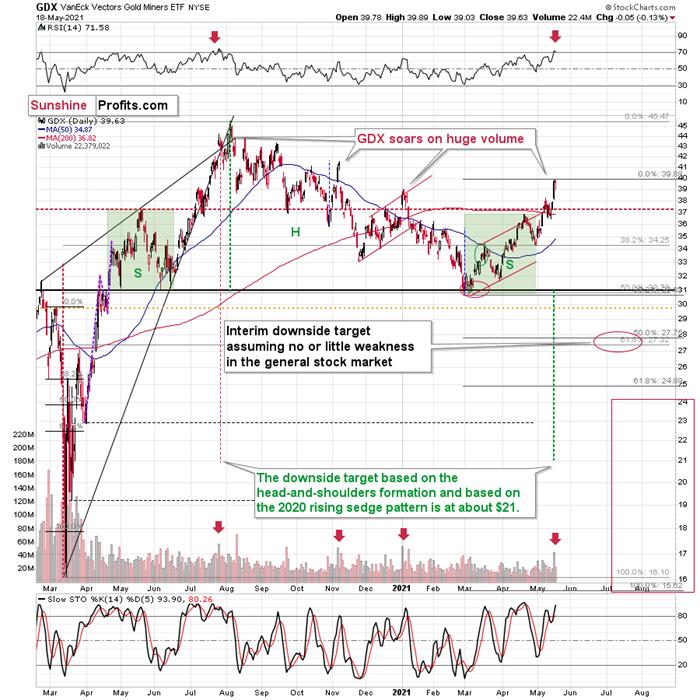
The same (or very similar) opening andclosing price levels accompanied by an intraday reversal after an intradaydecline – when seen after a short-term rally – are called a “hanging man”candlestick. In short, it’s one of the reversal candlestick patterns. It shouldhave been confirmed by a huge volume – it wasn’t, so it’s not that important,though.
The most important details are stillbased on the preceding day’s huge volume, the RSI, and the way the GDX ETFtopped in the past.
The GDX ETF soared to new highs on volumethat was much greater than 40M shares. This happened only three times in thepast 12 months. In each of those three cases, it was a major top, or it wasvery, very close to it.
The RSI just moved above 70, and ithappened only twice recently. One time it heralded the 2020 top, and the othertime we saw it in late February 2020 – right before a huge slide started.
Consequently, taking all the above intoaccount, it seems to me that the situation in the precious metals market isvery bearish right now, as it seems to be either topping or after the top. If Ididn’t have a short position in the junior mining stocks right now, I wouldhave opened it today.
Thank you for reading our free analysistoday. Please note that the above is just a small fraction of today’sall-encompassing Gold & Silver Trading Alert. The latter includes multiplepremium details such as the target for gold that could be reached in the nextfew weeks. If you’d like to read those premium details, we have good news foryou. As soon as you sign up for our free gold newsletter, you’ll get a free7-day no-obligation trial access to our premium Gold & Silver TradingAlerts. It’s really free – sign up today.
Przemyslaw Radomski, CFA
Founder, Editor-in-chief
Toolsfor Effective Gold & Silver Investments - SunshineProfits.com
Tools für EffektivesGold- und Silber-Investment - SunshineProfits.DE
* * * * *
About Sunshine Profits
SunshineProfits enables anyone to forecast market changes with a level of accuracy thatwas once only available to closed-door institutions. It provides free trialaccess to its best investment tools (including lists of best gold stocks and best silver stocks),proprietary gold & silver indicators, buy & sell signals, weekly newsletter, and more. Seeing is believing.
Disclaimer
All essays, research and information found aboverepresent analyses and opinions of Przemyslaw Radomski, CFA and SunshineProfits' associates only. As such, it may prove wrong and be a subject tochange without notice. Opinions and analyses were based on data available toauthors of respective essays at the time of writing. Although the informationprovided above is based on careful research and sources that are believed to beaccurate, Przemyslaw Radomski, CFA and his associates do not guarantee theaccuracy or thoroughness of the data or information reported. The opinionspublished above are neither an offer nor a recommendation to purchase or sell anysecurities. Mr. Radomski is not a Registered Securities Advisor. By readingPrzemyslaw Radomski's, CFA reports you fully agree that he will not be heldresponsible or liable for any decisions you make regarding any informationprovided in these reports. Investing, trading and speculation in any financialmarkets may involve high risk of loss. Przemyslaw Radomski, CFA, SunshineProfits' employees and affiliates as well as members of their families may havea short or long position in any securities, including those mentioned in any ofthe reports or essays, and may make additional purchases and/or sales of thosesecurities without notice.
Przemyslaw Radomski Archive |
© 2005-2019 http://www.MarketOracle.co.uk - The Market Oracle is a FREE Daily Financial Markets Analysis & Forecasting online publication.