Gold Price Summer Doldrums / Commodities / Gold and Silver 2021

Gold, silver, and theirminers’ stocks suffer their weakest seasonals of the year in early summers. With traders’ attention normally diverted to vacationsand summer fun, interest in and demand for precious metals usually wane. Without outsized investment demand, goldtends to drift sideways dragging silver and miners’ stocks with it. Long feared as the summer doldrums, they’ve reallymoderated in recent years.
This doldrums term is very apt for gold’s traditionalsummer predicament. It describes a zone surroundingthe equator in the world’s oceans. Therehot air is constantly rising, spawning long-lived low-pressure areas. They are often calm, with little prevailingwinds. History is full of accounts ofsailing ships getting trapped in this zone for days or weeks, unable to make headway. The doldrums were murder on ships’ morale.
Crews had no idea whenthe winds would pick up again, while they continued burning through their limitedstores of food and drink. Without movingair, the stifling heat and humidity were suffocating on these ships long beforeair conditioning. Misery and boredomwere extreme, leading to fights breaking out and occasional mutinies. Being trapped in the doldrums was viewed withdread, it was a very trying experience.
Gold investors cansomewhat relate. Like clockwork trudgingthrough early summers, gold starts driftinglistlessly sideways. It often can’tmake significant progress no matter what trends looked like heading into June,July, and August. As the days and weeksslowly pass, sentiment deteriorates markedly. Patience is gradually exhausted, supplanted with deep frustration. Plenty of traders capitulate, abandoningship.
June and early July inparticular have often proven desolate sentiment wastelands for precious metals,devoid of recurring seasonal demand surges. Unlike most of the rest of the year, the summer months simply lack anymajor income-cycle or cultural drivers of outsized gold investment demand. Yet three recent summers have been bigexceptions to these decades-old seasonals, and 2021’s could still prove another.
Quantifying gold’ssummer seasonal tendencies during bull markets requires all relevant years’ priceaction to be recast in perfectly-comparable percentage terms. That is accomplished by individually indexing each calendar year’s gold price to its lastclose before market summers, which is May’s final trading day. That is set at 100, then all gold-priceaction each summer is recalculated off that common indexed baseline.
So gold trading at anindexed level of 105 simply means it has rallied 5% from May’s final close,while 95 shows it is down 5%. Thismethodology renders all bull-market-year gold summers in like terms. That’s necessarysince gold’s price range has been so vast, from $257 in April 2001 to $2,062 inAugust 2020. That span encompassed twosecular gold bulls, the first soaring 638.2% over 10.4 years into August 2011!
While that previous mightybull ran from 2001 to 2011, 2012 was technically a bull year too since a 20%+drop back into formal bear territory wasn’t yet seen. That came in Q2’13, where gold plummeted22.8% in its worst quarterly performance in 93 years! The Fed’s unprecedented open-ended QE3 campaignwas ramping to full-speed, levitating stock markets which slaughtered demandfor alternative investments led by gold.
The resulting gold-bearyears ran from 2013 to 2015, which need to be excluded since gold behaves verydifferently in bull and bear markets. Thatultimately pounded gold to a 6.1-year secular low in December 2015, whichhelped birth today’s gold bull. It hasgradually powered higher on balance ever since, never suffering anybull-slaying 20%+ selloffs. So 2016 to 2021have proven gold-bull years to add into this analysis.
When all gold’s summerprice action from these modern gold-bull years is individually indexed andthrown into a single chart, this spilled-spaghetti mess is the result. 2001 to 2012 and 2016 to 2019 are rendered inyellow. Last summer’s action is shown inlight blue for easier comparison with this summer. Seeing all this perfectly-comparable indexedsummer price action at once reveals gold’s center-mass-drift tendency.
These summer seasonalsare further refined by averaging together all 17 of these gold-bull years intothe red line. Finally gold’ssummer-to-date action this year is superimposed over everything else in darkblue, showing how gold is performing compared to its seasonal mean. While gold began the summer of 2021 meanderingin line with seasonals, the hawkish-Fed-surprise-driven gold-futures purge utterlythrashed it!
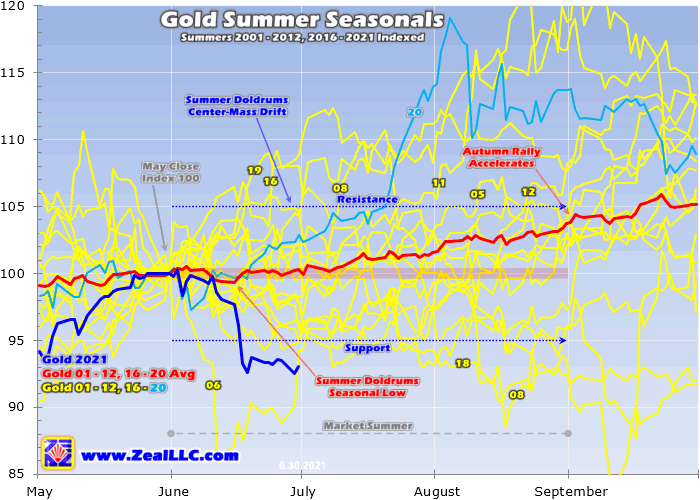
While there are outlieryears, gold generally drifts listlessly in the summer doldrums much like asailing ship trapped near the equator. Thecenter-mass-drift trend is crystal-clear in this chart. The vast majority of the time in June, July,and August, gold simply meanders between 5% from May’s final close. This year that equated to a probable summer rangebetween $1,808 to $1,998. Gold tends to remainwithin trend.
But interestingly “goldsummer doldrums” is increasingly a misnomer as more gold-bull years slowly reshapethe seasonal average. Gold’s summerseasonal low statistically has been gradually pulled all the way forward tomid-June. On June’s 11th trading day,which translated to June 15th this summer, gold has tended to carve its seasonallow. The worst of gold’s weak seasonalspass quickly in early summers!
At that mid-June nadir,gold has only been down an average of 0.7% from May’s close. From there this metal actually tends to startclimbing again into July and especially August. In average indexed terms, gold has tended to eke out 0.3% gains in Junes. They’re the real doldrums. Gold’s momentum starts building to 1.3% gainsin Julies, then really accelerates into summer-ends with hefty 2.2% gains inAugusts!
Between that mid-June seasonallow to the end of August, gold has averaged impressive 4.4% summer rallies in all these modern bull-market years! The summer doldrums have been compressed into a shorter time frame by severaloutlier years in today’s secular gold bull. They were its maiden 2016 summer, summer 2019, and last summer. Different catalysts each summer fueledoutsized investment demand.
Comprehensive globalgold fundamental supply-and-demand data including investment is only published quarterlyby the World Gold Council. And thatinvestment category has been increasingly dominated by gold-exchange-traded-fund capital flows over the past decade or so. Gold ETFs have eclipsed traditional gold investment since they are so cheapand easy to trade. They report their gold-bullionholdings daily.
So these holdings are a high-resolution proxy forglobal gold investment, the driving force reshaping the summer doldrums. The leading and dominant gold ETFs are theAmerican GLD SPDR Gold Shares and IAU iShares Gold Trust. Per the latest Q1’21 WGC data, at quarter-endGLD and IAU commanded 29% and 14% of all the physical gold held by allthe world’s gold ETFs! Third place wasway smaller near 6%.
Climbing GLD+IAUholdings reveal American stock-market capital flowing into gold, which hasoften been the largest share of overall world investment demand. In order to track the gold price, gold ETFshave to shunt excess ETF-share supply and demand directly into gold itself toequalize flow differentials. This isdone by issuing and redeeming baskets of ETF shares, with the resulting capitalused to buy and sell gold.
Gold’s summer doldrumsare moderating and compressing because American stock investors flooded intogold via GLD and IAU shares in 2016, 2019, and 2020. These counter-seasonal investment-demandspikes were all gold-price-driven. Gold was surging higher in bull uplegs, which fueled mounting bullish sentiment. Traders love chasing winners, so they piledinto gold-ETF shares accelerating gold’s gains.
Outsized gold investmentdemand flared in the summer of 2016, when this gold bull’s maiden upleg wasmaturing. Traders’ greed soared aftergold blasted higher for a half-year, slaying a secular bear. So they flooded into gold-ETF shares fastenough to drive gold 12.3% higher between the end of May to early July. GLD+IAU holdings soared 12.1% or 129.1 metrictons in that span, revealing big capital inflows into gold.
That left gold extremelyoverbought so that initial upleg gave up its ghost, but gold still ended summer2016 7.7% higher. Gold bucked thesummer-doldrums-drift trend that year because investment demand led byAmerican stock traders was strong! With GLD and IAU shares being bought faster than gold, their managersissued enough new shares to absorb that differential demand then used the proceedsto buy gold.
A similar gold-momentum-chasingdynamic unfolded in the summer of 2019, when another major gold upleg was maturing. Stock traders rushed to ride gold’s biggains, through heavy differential buying of GLD and IAU shares. Between the end of May to early Septemberthat year, gold rocketed up 19.0%! That sharprally was fueled by massive capital inflows into gold, with GLD+IAU holdingssoaring 19.0% or 194.8t!
During that full marketsummer from the ends of May to August 2019, gold’s huge counter-seasonal gainsclocked in at 16.7%. As long as gold is relatively-highand has been rallying on balance long enough to fuel greedy sentiment, Americanstock investors will increasingly flood in to chase those gains. That’s regardless of where the calendar happensto be. So strong gold prices unleash summer investment demand.
Last year in summer 2020another massive gold-bull upleg was maturing, a powerful mean reversion out ofMarch’s stock panic. Like usual thelonger and higher gold climbed, the more it attracted the attention and capitalof stock traders. As their excitementand greed mounted, they rushed to add shares of GLD and IAU for gold portfolio exposure. This catapulted gold 19.1% higher from the endof May to early August!
During that short span,GLD+IAU holdings soared 12.8% or 200.0t! For the third time in this relatively-young secular gold bull, big gain-chasingsummer investment demand easily overpowered gold’s normal summer-doldrumsseasonals. While gold had to correctafter being bid up to extraordinarily-overbought extremes, it stillended last summer up 13.7% through June, July, and August proper. That was a great summer.
Out of the 48 tradingdays in that terminal-upleg-climax span, fully 41 saw GLD+IAU holdings buildsthat averaged a sizable 0.3% each. The bigupside impact on gold those ETF capital inflows had is evident on this chart. Gold blasted much higher on momentum buyingand fears of the mind-boggling money printing underway at the Fed. That crazy pandemic-paranoia year shatteredgold’s summer-doldrums seasonals.
Now summer 2021 still hasthe potential to prove the third year in a row enjoying outsized investment demand,forcing gold prices much higher. Since arare extended correction bottomed in early March, gold has powered higher onbalance in its fifth upleg of this secular bull. That upside momentum lasted long enough andleft gold high enough to start enticing stock-market capital back into thoseleading gold-ETF shares.
American stock traders had fled during gold’sextended correction, exacerbating it. Butas gold bounced in a sharp mean-reversion early upleg, that differential sellingin GLD and IAU shares stalled. As gold’supleg gains mounted, that reversedinto buying as investors started chasing this metal’s strengthening upsidemomentum. That could still flare againthis summer, despite the recent FOMC-lobbed monkey wrench.
That mid-June FOMC decision changed nothing, leaving the Fed’s hyper-easy zero-interest-rate policy and$120b per month of quantitative-easing money printing in placeindefinitely. It was top Fed officials’individual outlooks, a third of these guys expecting a couple rate hikes overa couple years into the future, that unleashed fierce gold-futures selling. That leaves gold perfectly set up for astrong mean-reversion rebound.
Despite that hawkish-Fedscare, counter-seasonal gold demand is already modestly evident. In June, GLD+IAU Holdings still edged up 0.4%or 6.8t straddling that Fed-spawned gold-futures purge. If gold rebounds strongly as it ought togiven speculators now-super-bullish gold-futures positioning, so willgold investment buying. It is gold’s priceaction that drives stock traders’ sentiment, governing their gold-ETF buying.
This summer is also seeinganomalous catalysts that could really boost investment demand, which wouldshort-circuit the doldrums again. Chiefamong them is inflation, the soaring prices Americans are facing in everything. With the Fed continuing to conjure up that $120bper month of new dollars to monetize bonds, the money supply is still exploding. That deluge is bidding up the prices on goods and services universally.
In just 15.4 monthssince March 2020’s stock panic spawned by governments’ COVID-19 lockdowns, theFed’s balance sheet has skyrocketed 87.9% or $3,790b higher! That has nearly doubled the US money supplyin that short span, fueling soaring prices. The latest Consumer Price Index read in mid-June saw a 5.0%year-over-year headline surge, but that is lowballed with real-world prices actuallysoaring double digits.
The more speculators andinvestors worry about inflation, the more capital they will allocate to gold,silver, and their miners’ stocks. Longcenturies of thriving during episodes of profligate central banks foolishlydebasing their own currencies has crowned gold the ultimate inflation hedge. Gold investment demand should strengthen considerably,even this summer, as the drumbeat of scary inflationary news intensifies.
For many years I’vethrown in silver and the gold miners’ stocks in my gold-summer-doldrumsanalyses. Gold’s fortunes drive the entireprecious-metals complex. Silver and precious-metalsminers’ stocks are effectively leveraged plays on gold. Their summer behavior mirrors and amplifieswhatever is happening in gold. So if goldenjoys outsized gains later this summer, silver and their miners’ stocks shoulddo better.
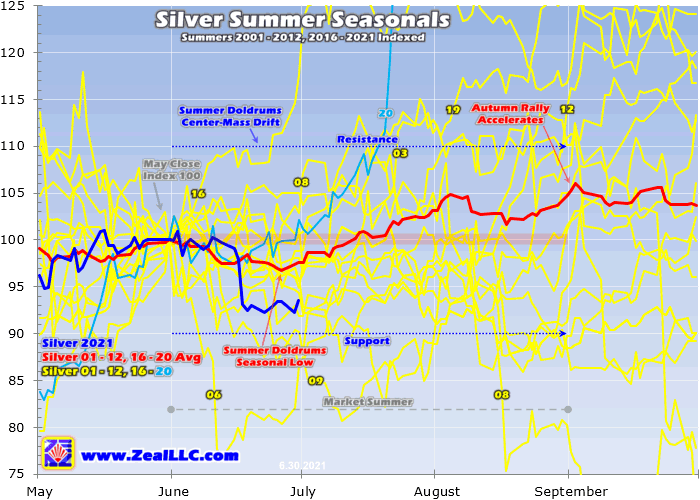
This silver-summer-seasonalsmethodology is the same as gold’s, showing how it has fared during gold’smodern bull-market years. With a far-smallerglobal market, silver is much-more-volatile than gold. So its center-mass summer drift is wider, running10% from May’s final close. That impliesa summer range between $25.11 to $30.69 this year. But silver’s summer seasonals have provenweaker overall than gold’s.
Silver’s summer-doldrumsseasonal low tends to arrive a couple weeks after gold’s in late June. That is averaging June’s 20th trading day,which translated to June 28th this year. And that saw silver being down 3.3% summer-to-date, much worse than gold’s0.7% average droop at its own summer seasonal low. But silver’s overall seasonal performance inmarket summers has improved in recent years with gold’s.
During those investment-drivensummer gold surges in 2016, 2019, and 2020, silver amplified gold’s counter-seasonalgains. The white metal soared 26.9%,34.5%, and 61.6% summer-to-date in those same spans where gold powered 12.3%,19.0%, and 19.1% higher! That made for2.2x, 1.8x, and 3.2x silver upside leverage to gold. The latter massive silver gains last summer reallyboosted its seasonals.
Through all these modern-gold-bull-yearsummers, silver has rallied an average of 4.6% from the end of May to the endof August. That is modestly better thangold’s 3.7% average full-summer gains. Ayear ago in my last iteration of this summer-doldrums research thread, I was lamenting silver’s seriousrelative underperformance compared to gold. Then their average summer gains were running just 1.3% and 3.1%.
As last summer’s astounding58.1% silver soaring proved, this precious metal can blast higher despite the doldrums. But silver is ever-dependent on gold,its dominant primary driver. Traders don’t flock to silver unless golditself is running in an attention-grabbing exciting way. In order for silver to enjoy large summergains on big capital inflows, gold needs to be powering considerably higher on flaringinvestment demand.
That could happen againlater this summer, lighting another fire under silver. The gold miners’ stocks are also bigbeneficiaries of gold strength. Forgold-stock summer seasonals, I’m using the older HUI gold-stock index which closelymirrors the GDX VanEckVectors Gold Miners ETF more popular today. Since GDX was only launched in May 2006, it has insufficient pricehistory to match these modern gold-bull years.
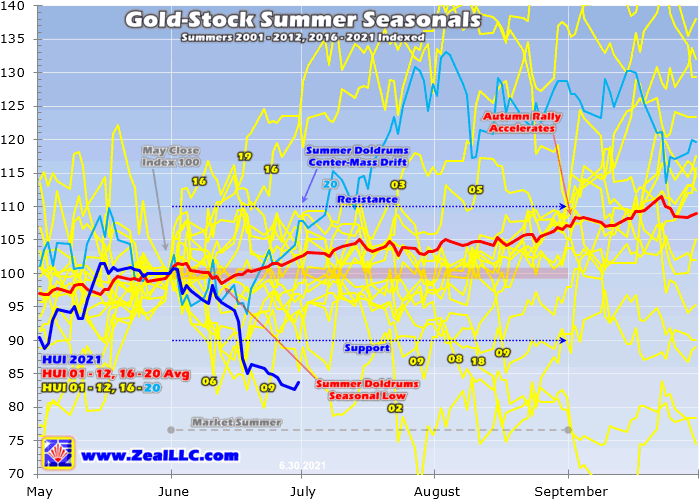
The major gold stocks’summer seasonals have also improved in recent years, thanks to those big goldsurges in 2016, 2019, and 2020. The more-volatilegold stocks also have a wider center-mass-drift summer trading range of 10%from May’s final close. In HUI termsthat runs from 287.0 to 350.7 this year. Applied to GDX, that equated to a probable summer-2021 trading range spanning$35.48 to $43.36.
Interestingly goldstocks’ average summer-doldrums low comes on June’s 10th trading day, which shookout to June 14th this year. That is rightin line with gold’s own summer seasonal low. The gold stocks per the HUI tend to slump 1.4% by then from May’s close,which amplifies gold’s early-summer weakness by 2.0x. The major gold stocks of the HUI and GDX generallytend to leverage material gold moves by 2x to 3x.
On average from 2001 to2012 and 2016 to 2020, the gold stocks have rallied 2.4% in June, slowed to 0.9%gains in July, and then finished summers strong with big 3.7% surges in August. This compares to +0.3%, +1.3%, and +2.2% forgold in these same market-summer months. Overall from the end of May to the end of August, the HUI has averaged 7.1%summer gains. That’s 1.9x gold’s 3.7%mean rally.
Like silver to a lesserextent, gold stocks fare best during market summers when gold is surging fastenough to generate excitement. That entices traders enjoying summers’ many pleasures back to markets tobuy in and chase those gains. In this goldbull’s surging summers of 2016, 2019, and 2020, GDX soared 35.3%, 43.4%, and28.9% summer-to-date during those spans where gold surged 12.3%, 19.0%, and19.1%!
That made for 2.9x, 2.3x,and 1.5x gold-stock upside leverage to gold. The latter result from last summer proved really anemic, but that is moreof a timing issue. If GDX is insteadmeasured during that entire gold upleg that crested in early August 2020, its107.9% gains amplified gold’s 40.0% total upleg by an excellent 2.7x. And as GDX didn’t bottom or top on the exactdays gold did, its own upleg actually ran +134.1%.
Like usual, gold stocks’fortunes this summer depend on gold’s. If its young upleg mean reverts sharply higher post-FOMC as gold-futuresspeculators return, fueling outsized investment demand reinforcing andaccelerating those gains, the gold stocks will catch a strong bid. Traders will up their gold-stock portfolioallocations to ride miners’ inherent profits leverage to gold. The rest of summer 2021 still has big upsidepotential.
If you lack sufficientgold-stock portfolio exposure for these extraordinary times when inflation issoaring, it isn’t too late to get deployed. At best GDX’s current fifth upleg of this bull has only rallied 28.4% sofar. The previous four GDX uplegs ofthis secular gold bull averagedhuge 99.2% gains! The trading booksof our newsletters are full of fundamentally-superior gold stocks, which arelikely to well outperform even GDX.
At Zeal we walk the contrarianwalk, buying low when few others are willing before later selling high when fewothers can. We overcome popular greedand fear by diligently studying market cycles. We trade on time-tested indicators derived from technical, sentimental,and fundamental research. That hasalready led to unrealized gains in this current young upleg as high as +64.9%on our recent newsletter stock trades!
To multiply your wealthtrading high-potential gold stocks, you need to stay informed about what’sgoing on in this sector. Stayingsubscribed to our popular and affordable weekly and monthly newsletters is agreat way. They draw on my vast experience,knowledge, wisdom, and ongoing research to explain what’s going on in the markets,why, and how to trade them with specific stocks. Subscribetoday while this gold-stock upleg remains young! Our newly-reformatted newsletters have expandedindividual-stock analysis.
The bottom line is themajor silver miners of the leading silver-stock ETF generally reported good resultsin Q1. Continuing their years-olddiversification trend, their silver production waned as their gold outputsurged. This ongoing shift continued todilute the purity of the traditional silver miners, leaving their stock pricesmore dependent on gold than silver. While more profitable, these silver stocks trade more like gold stocks.
The high prevailing silverprices did help drive big year-over-year surges in revenues, earnings, operatingcash flows generated, and cash treasuries. Those good fundamentals should attract capital, especially as silverpowers higher with gold. As thatReddit-silver-short-squeeze episode showed, traders still flock back to major silverminers when silver runs. While thatlasts, these stocks should still amplify silver’s gains.
Adam Hamilton, CPA
So how can you profit from this information? We publish an acclaimed monthly newsletter, Zeal Intelligence , that details exactly what we are doing in terms of actual stock and options trading based on all the lessons we have learned in our market research. Please consider joining us each month for tactical trading details and more in our premium Zeal Intelligence service at … www.zealllc.com/subscribe.htm
Questions for Adam? I would be more than happy to address them through my private consulting business. Please visit www.zealllc.com/adam.htm for more information.
Thoughts, comments, or flames? Fire away at zelotes@zealllc.com . Due to my staggering and perpetually increasing e-mail load, I regret that I am not able to respond to comments personally. I will read all messages though and really appreciate your feedback!
Copyright 2000 - 2019 Zeal Research ( www.ZealLLC.com )
Zeal_LLC Archive |
© 2005-2019 http://www.MarketOracle.co.uk - The Market Oracle is a FREE Daily Financial Markets Analysis & Forecasting online publication.