Gold Remains In Its Trading Range - A Move Could Be On The Horizon
Gold ignores the new high in the dollar.
Silver makes a lower low, but gold only probes below $1200.
Gold has been making higher lows since mid-August.
December has been an ugly month, but 2018 has been a year of departures for gold.
UGLD and DGLD for a volatile period before the end of this year.
In mid-August, the price of gold fell to $1161.40 which was its lowest level of 2018. The yellow metal had not seen that level since the first week of January in 2017. Gold fell to its low as the dollar index rose to a new and higher high for 2018 at 96.865 in August.
Gold is facing bullish and bearish factors these days, and the price of the metal has risen to the $1225.50 level on the nearby December futures contract as of Monday, November 19. December futures fell to $1167.10 in August, so the price is over $58 or 5% above its bottom for this year as we head into the final month of the year. A strong dollar and higher interest rates are bearish for the gold market, but volatility in the equities arena and the many issues facing the world that could quickly cause fear and uncertainty to drive capital into safe havens could benefit gold.
One of the most bullish signs for a market is when it does not decline during periods when factors that typically weigh on prices cannot push them to the downside. That is precisely what we witnessed on November 12 when the dollar index rose to another new high and gold barely made it below the $1200 per ounce level.
We could be on the verge of a significant move in the gold market. The Velocity Shares 3X Long Gold ETN product (UGLD) and its bearish counterpart (DGLD) are excellent short-term instruments for those market participants who do not venture into the futures arena but want turbocharged exposure to gold on the long or short side of the market over the coming days and weeks.
Gold ignores the new high in the dollar
On November 12, the dollar index rose to 97.53 on the December futures contract. 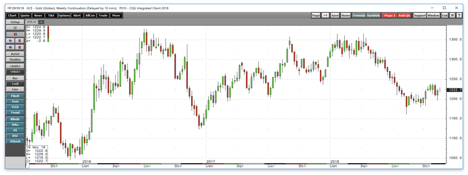
Source: CQG
As the weekly chart of the dollar index highlights, the U.S. currency rose to its highest level since June 2017 recently. Typically, a rise in the dollar causes the price of gold to slip, but this month, the yellow metal ignored the new peak in the greenback. 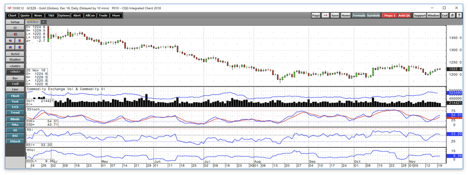
Source: CQG
December gold futures traded to just over the $1167 level in August when the dollar made a new high, but on November 12, it only made it down to a low of $1196.60. The dollar corrected lower following the new high, and gold posted five consecutive days of gains rising to the $1223 level on Tuesday, November 20. Open interest, the total number of open long and short positions in the COMEX gold futures market has moved higher from 477,460 contracts on August 16; the day gold hit its low for this year. As of November 19, the metric stood at 523,490 contracts, a rise of 46,030 or 9.6% over the period. Rising price alongside an increase in the open interest is typically a bullish sign for a futures market. Both price momentum and relative strength indicators have turned higher in neutral territory on the daily chart in the gold market.
Gold ignored the move in the dollar, and it also did not follow silver which made another head fake move to the downside on November 14.
Silver makes a lower low, but gold only probes below $1200
Silver tends to move a lot more than gold on a percentage basis which attracts trend-following speculators to the silver futures market. Silver can lead or follow gold over time, and the recent price action in the silver futures market shows that gold's refusal to follow its precious cousin, led to a rebound in silver and strength in the gold market. 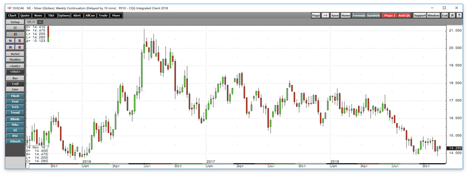
Source: CQG
As the weekly chart illustrates, the price of silver fell to a new and lower low at $13.86 on November 14, which was the lowest price for the metal since mid-January 2016 and dangerously close to silver's level of critical technical support. In December 2016, the price of silver found a bottom at $13.635, and last week it came within 22.5 cents of that level. Gold also reached a bottom during the final month of 2016 when it traded to $1046.20 per ounce. Gold's refusal to follow silver and a move lower from the high in the dollar caused silver to rally to a high of $14.475 after failing to follow through on the downside last week.
On Tuesday, November 20 with gold at $1223 and silver at $14.29 the yellow metal is $176.80 or 16.9% above its 2015 low and support level while silver is 65.5 cents or 4.8% above its level on the downside. Silver has been underperforming gold throughout most of 2018, and it has fallen to the lowest level against gold in a quarter of a century.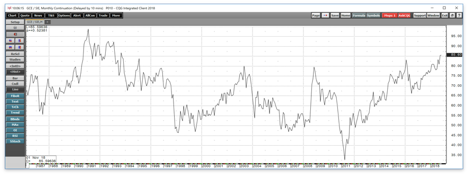
Source: CQG
As the monthly chart of the price of nearby gold futures divided by silver futures shows, it currently takes around 85.6 ounces of silver to purchase one ounce of gold. At the current differential, silver is trading at the lowest level against the yellow metal since 1993.
Gold has been making higher lows since mid-August
Gold's fall in mid-August took it to its lowest price since early 2017, but since then it has been working its way higher.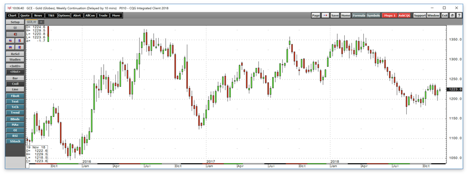
Source: CQG
The weekly gold chart shows that following the August low, the price has been making higher lows and higher highs reaching a peak at just under the $1240 level on the continuous futures contract. The weekly chart shows that the gold market began a significant correction to the downside in April that took the price from $1365.40 to $1161.40. The midpoint of that move is at the $1263.40 which could be a critical level on the upside if gold continues to make strides on the upside. However, it will need to get through next month which has been a disaster for the price of the precious metal over the past three years.
December has been an ugly month, but 2018 has been a year of departures for gold
The Fed pivoted from an accommodative stance towards monetary policy to tightening credit in December 2015 when they increased the Fed Funds rate from zero to 25 basis points. That month, the price of gold fell to a low of $1046.20 and found a bottom. The next rate hike came during the final month of 2016, and while gold spent the all of that year making higher lows and higher highs, it slipped to a higher low at $1123.90 in December 2016. While 2017 did not bring a higher high for the price of gold, the metal continued to make higher lows falling to a low at $1236.50 in December 2017 keeping the pattern of higher lows intact. 2018 began a lot like the last years with a rally in January and the price remaining above the December 2017 low until July when it gave way and the price broke the bullish trading pattern.
Gold broke through the December 2017 low this past summer, which was a departure from the price action witnessed over the past three years. As we enter the final month of 2018, we will find out if the current strength in the gold market holds and the price remains above the mid-August bottom. The first test came on November 12 when the dollar made a new high, and gold passed with flying colors. However, December will present another challenge for the gold market as the history of bearish price action is a warning sign. In 2016 and 2017 gold never traded below the December low from the previous year. In 2018, that has already occurred, and the mid-August bottom now stands as critical support for the price of the yellow metal.
UGLD and DGLD for a volatile period before the end of this year
The price of gold has been hanging in there, but the period of marginal higher lows has been more of a consolidation period than a bull market. The levels to watch over the rest of 2018 are the mid-August low at $1161.40 and the 50% retracement point of the move from the April peak to the August bottom at $1263.40 per ounce.
Gold will eventually break higher or lower from its current range, and I continue to favor the upside given the recent price action. However, if the price declined below the lows for this year, I would likely reconsider my bullish orientation to the market.
The most direct route for trading or investment in the gold market is via the highly-leveraged and volatile futures and futures options market on the COMEX division of the CME. While many ETF and ETN products replicate the price action in gold, the Velocity Shares 3X Long Gold ETN product and its bearish counterpart (DGLD) are ideally suited for those who wish to approach the market from the long or short side with a leveraged position without entering the futures arena. The fund summary for UCO states:
The investment seeks to replicate, net of expenses, three times the S&P GSCI Gold index ER. The index comprises futures contracts on a single commodity. The fluctuations in the values of it are intended generally to correlate with changes in the price of gold in global markets.
Both UGLD and DGLD use leverage to replicate a triple performance compared to gold futures. Leverage comes at a price which is time decay. Therefore, these products are only appropriate for very short-term forays into the gold market on the long or short side as time decay eats away at their values and both are susceptible to reverse splits. Most recently, gold rose from a low of $1196.60 on November 14 to a high of $1226.50 on November 19, a rise of 2.5%.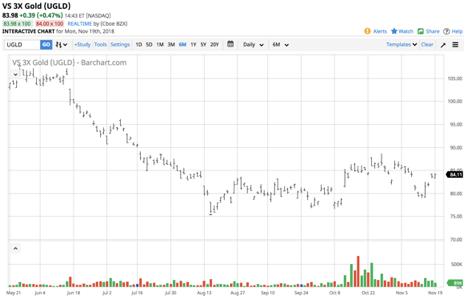
Source: Barchart
As the chart shows, UGLD rose from $78.98 on November 13 to a high of $84.33 per share on November 19, a rise of 6.8% or a little less than three times the percentage gain in the price of gold.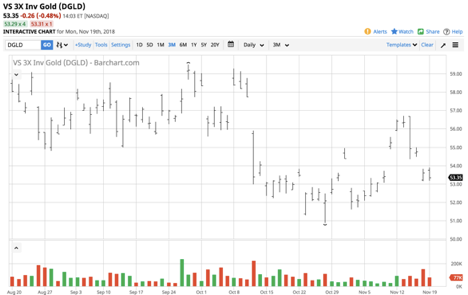
Source: Barchart
At the same time, DGLD, the bearish triple-leveraged ETN product fell from $56.70 to a low of $53.14 over the period or 6.3%.
Gold survived a new high in the dollar and a new low in silver without moving below its mid-August nadir which I believe is a bullish sign for the yellow metal. December has been a volatile month in the gold market over the past three years, so UGLD and DGLD are products that can enhance your short-term trading and investing over the coming weeks if the price of gold is going to make a move.
The Hecht Commodity Report is one of the most comprehensive commodities reports available today from the #2 ranked author in both commodities and precious metals. My weekly report covers the market movements of 20 different commodities and provides bullish, bearish and neutral calls; directional trading recommendations, and actionable ideas for traders. More than 120 subscribers are deriving real value from the Hecht Commodity Report.
Disclosure: I/we have no positions in any stocks mentioned, and no plans to initiate any positions within the next 72 hours.
I wrote this article myself, and it expresses my own opinions. I am not receiving compensation for it (other than from Seeking Alpha). I have no business relationship with any company whose stock is mentioned in this article.
Additional disclosure: The author always has positions in commodities markets in futures, options, ETF/ETN products, and commodity equities. These long and short positions tend to change on an intraday basis.
Follow Andrew Hecht and get email alerts