Gold Resource Corporation: Breaking Out
Despite the Gold Miners Index being flat last week, Gold Resource Corporation put up an impressive 8% weekly gain.
The stock has been much stronger than the mining indexes all year, with a 20% out-performance annually so far vs. the Junior Gold Miners Index.
The company has a tight share structure, no debt, and has paid over $100 million in dividends to shareholders since its inception.
While the Gold Miners Index (GDX) and Junior Gold Miners Index (GDXJ) continue to trade in ranges below their 20-month moving averages, there are a few leading names beginning to poke their head out above key resistance levels. This is the spot where I tend to focus on within the group, as these names are less at mercy to the gyrations of the mining indexes, and tend to trade in their own world. The benefit of buying leading stocks is that they correct less than the sector during declines and they tend to also appreciate more during sector advances. Gold Resource Corporation (GORO) is one such company that is clearly showing some technical signs that it may be a new emerging leader. It's for this reason that I've started a new position in the stock at $4.88 US and will look for follow-up buy points to potentially add to my position upon further confirmation of this "leader" thesis being validated.
Technicals - Acting Like A Leader
(Source: TC2000.com)
(Source: TC2000.com)
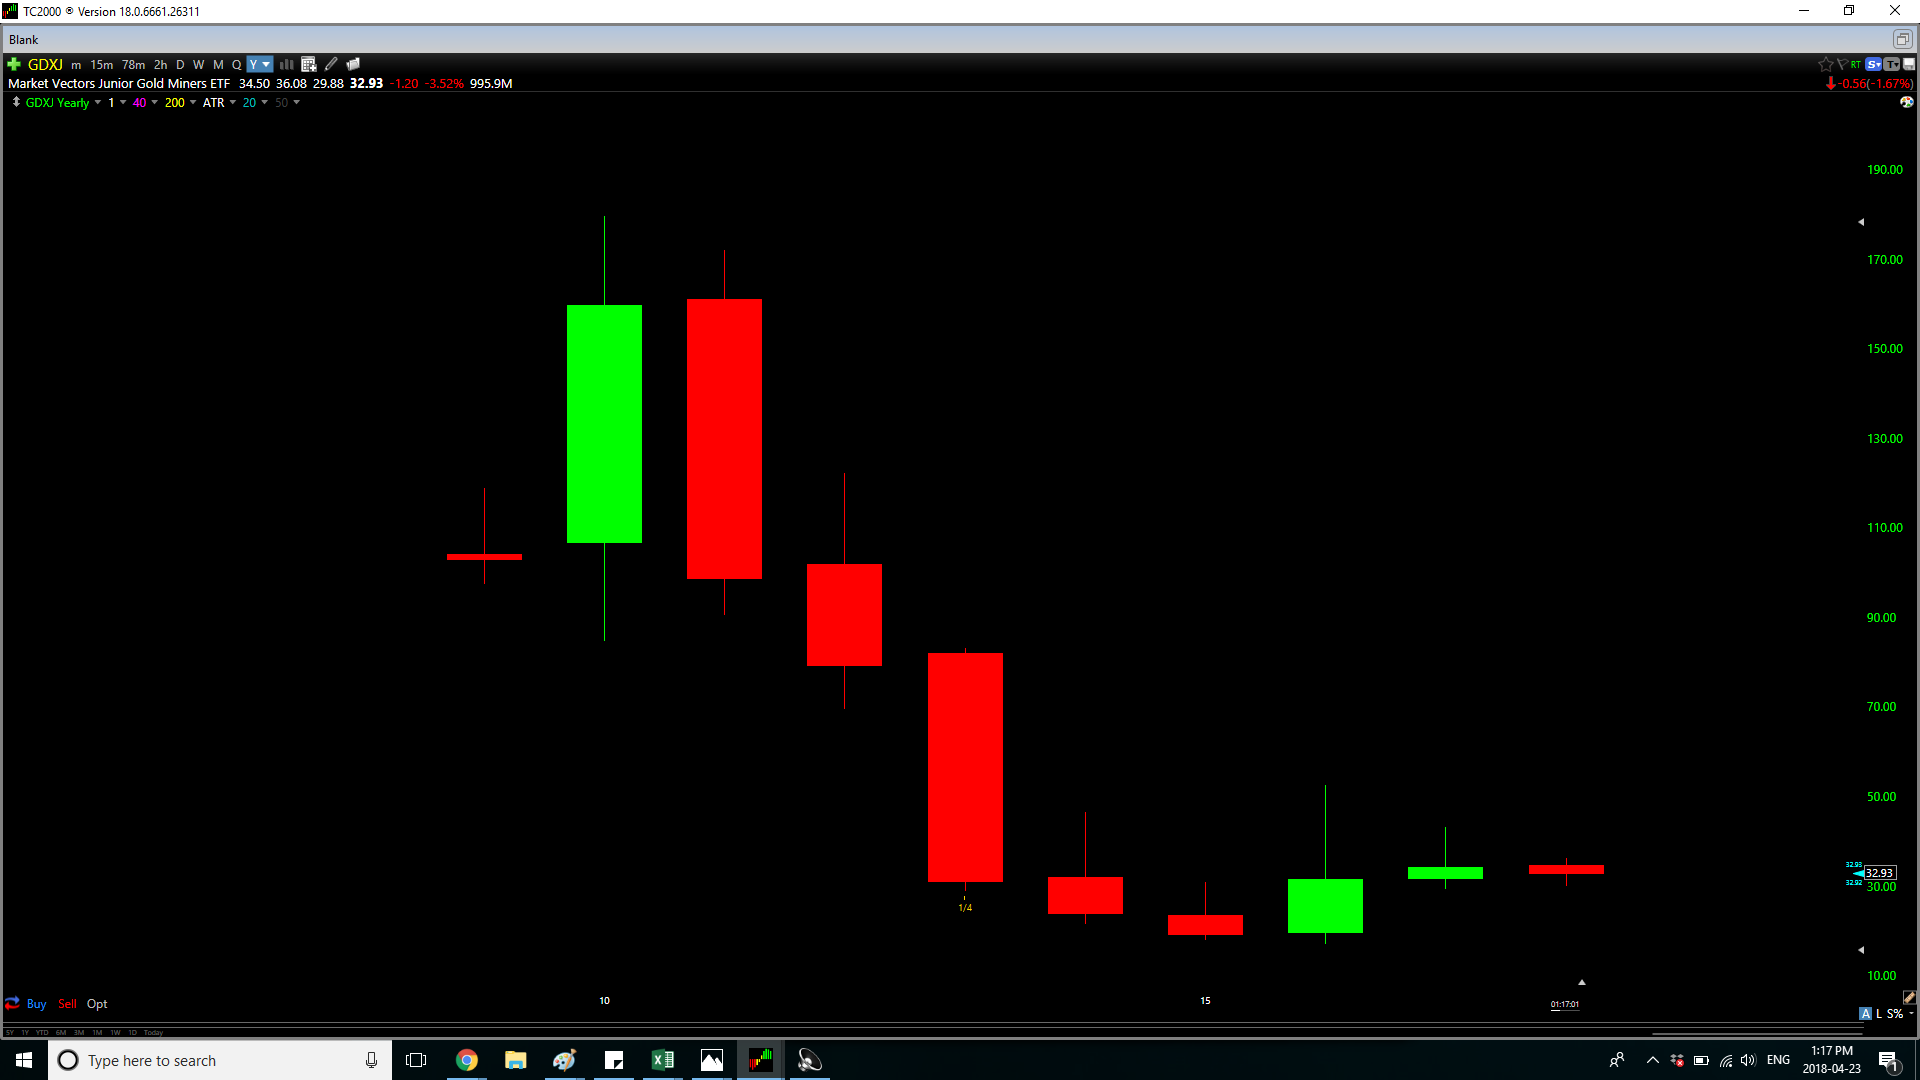
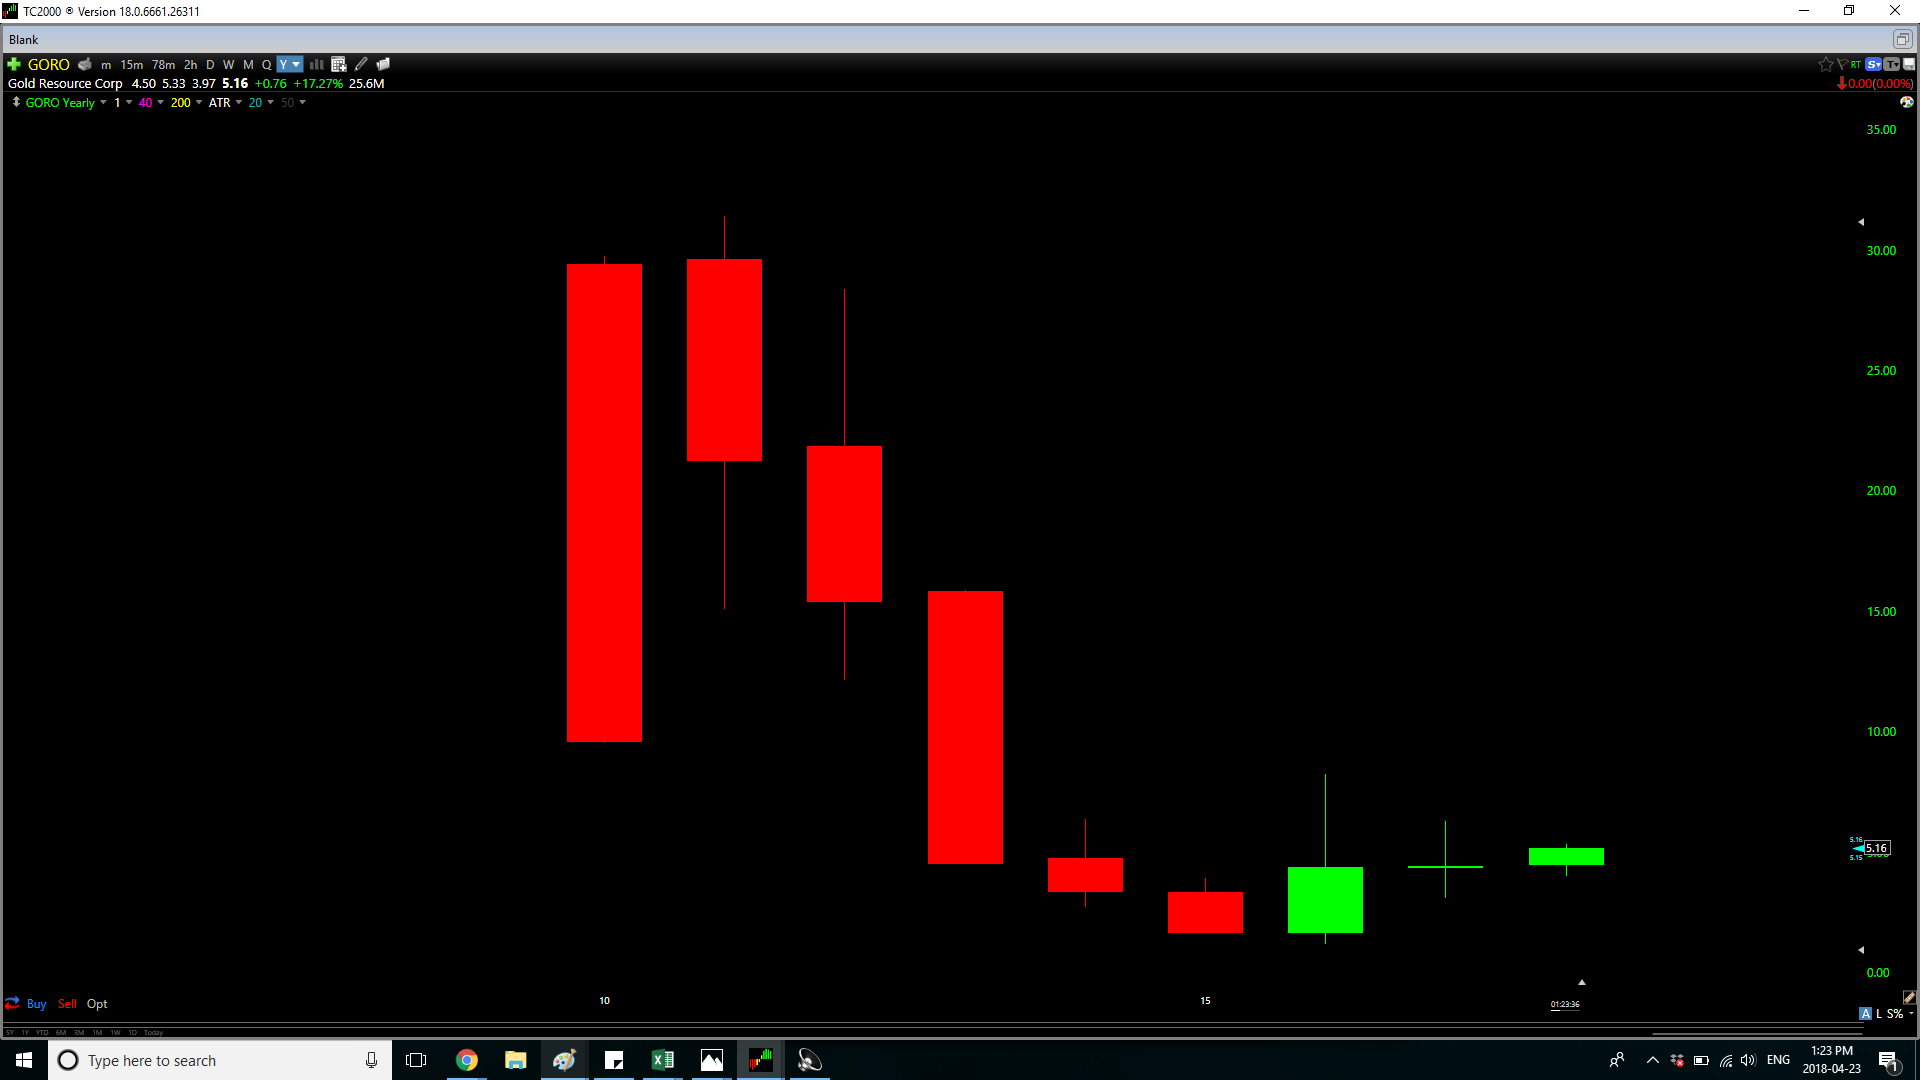
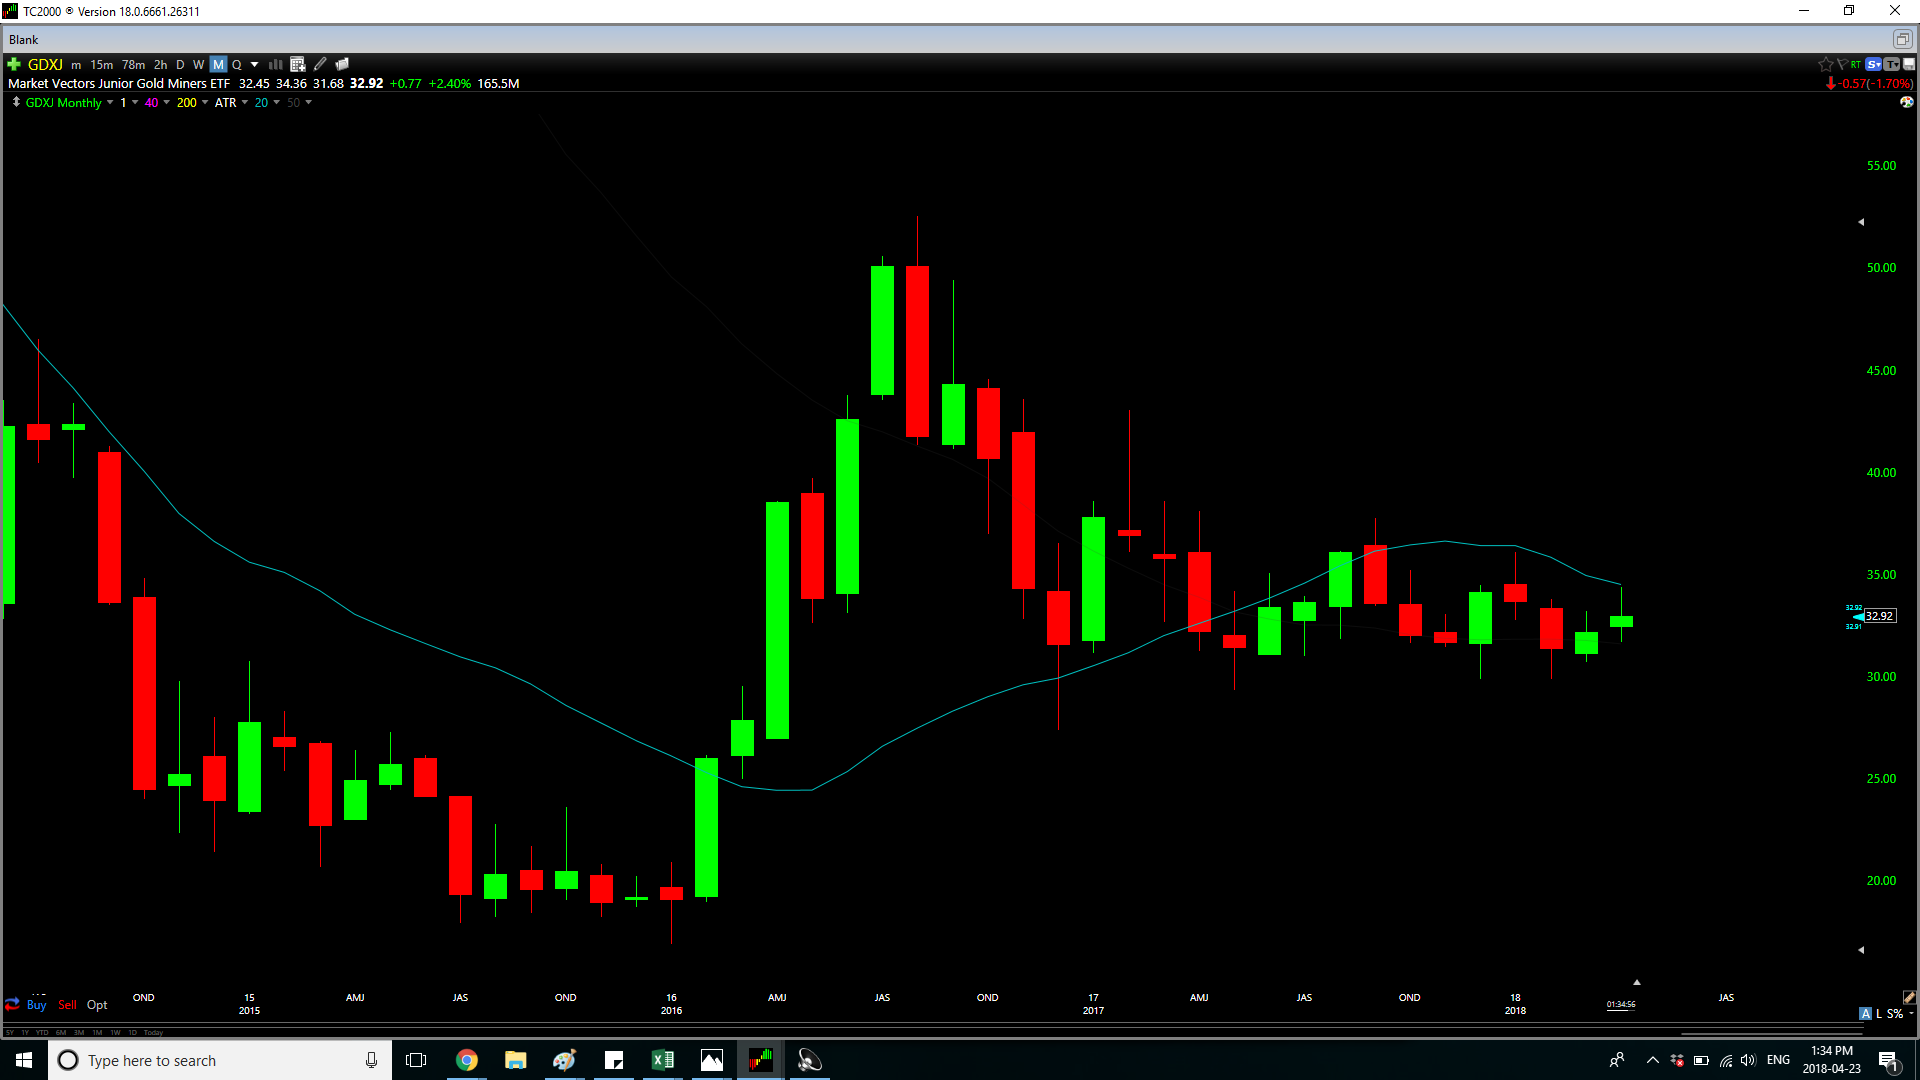
While the Junior Gold Miners Index (GDXJ) tries to find its bearings down 4% for the year, there are some names that have actually put up positive and double-digit year-to-date returns. Despite the GDXJ's negative year-to-date return thus far, Gold Resource Corporation is up 17% for the year and managed to put up an 8% gain last week while the mining indexes were flat. The divergence may not be as apparent on the two yearly charts shown above, but the divergence becomes much more clear after zooming in a little as displayed below. Despite both the GDXJ and GORO declining significantly after the Q3 2016 top, GORO is up more than 75% off its lows and the stock continues to make higher weekly swing lows. Meanwhile, the GDXJ is up only 25% off of its lows and while it's making marginal higher weekly swing lows, it's quite a distance from making any clear higher weekly swing highs. This tells me immediately that GDXJ is a range-bound chart (higher lows but lower highs) and GORO is attempting to start a new uptrend (higher lows and also higher highs).
 (Source: TC2000.com)
 (Source: TC2000.com)
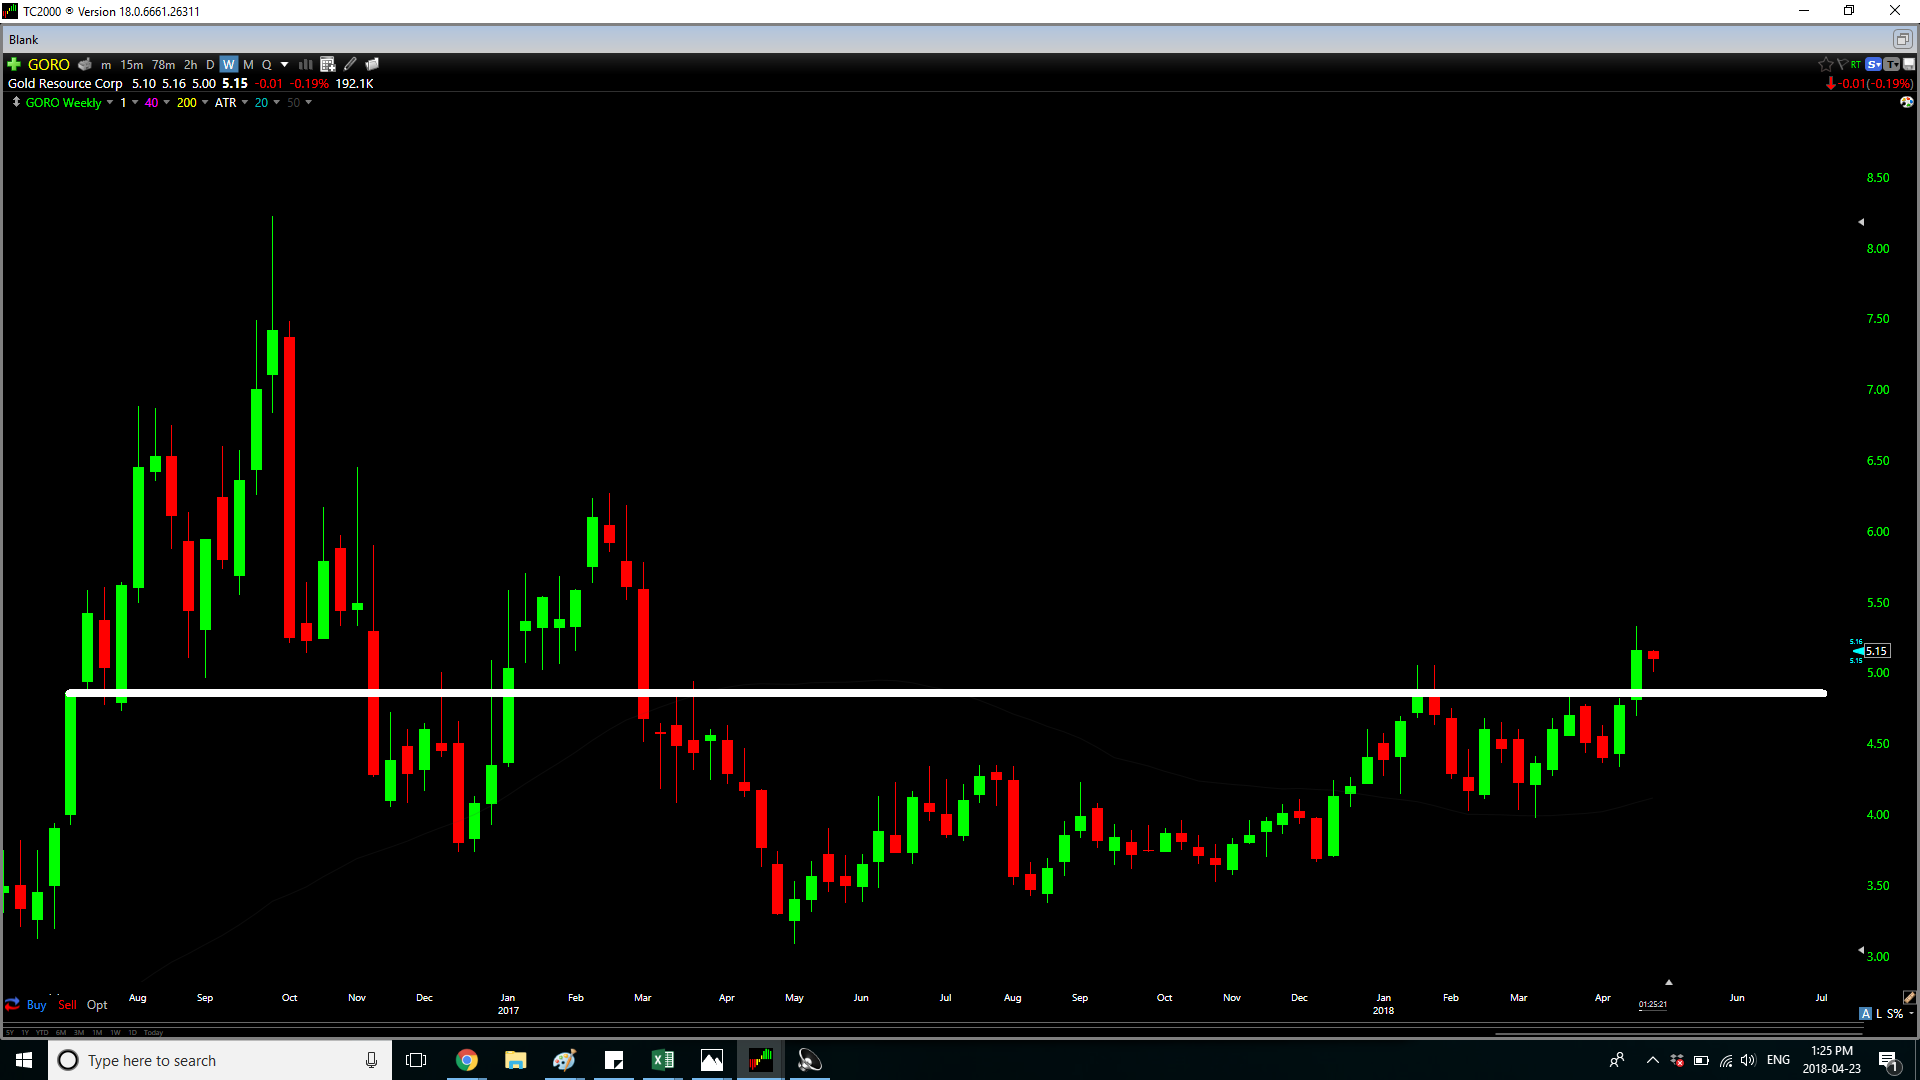
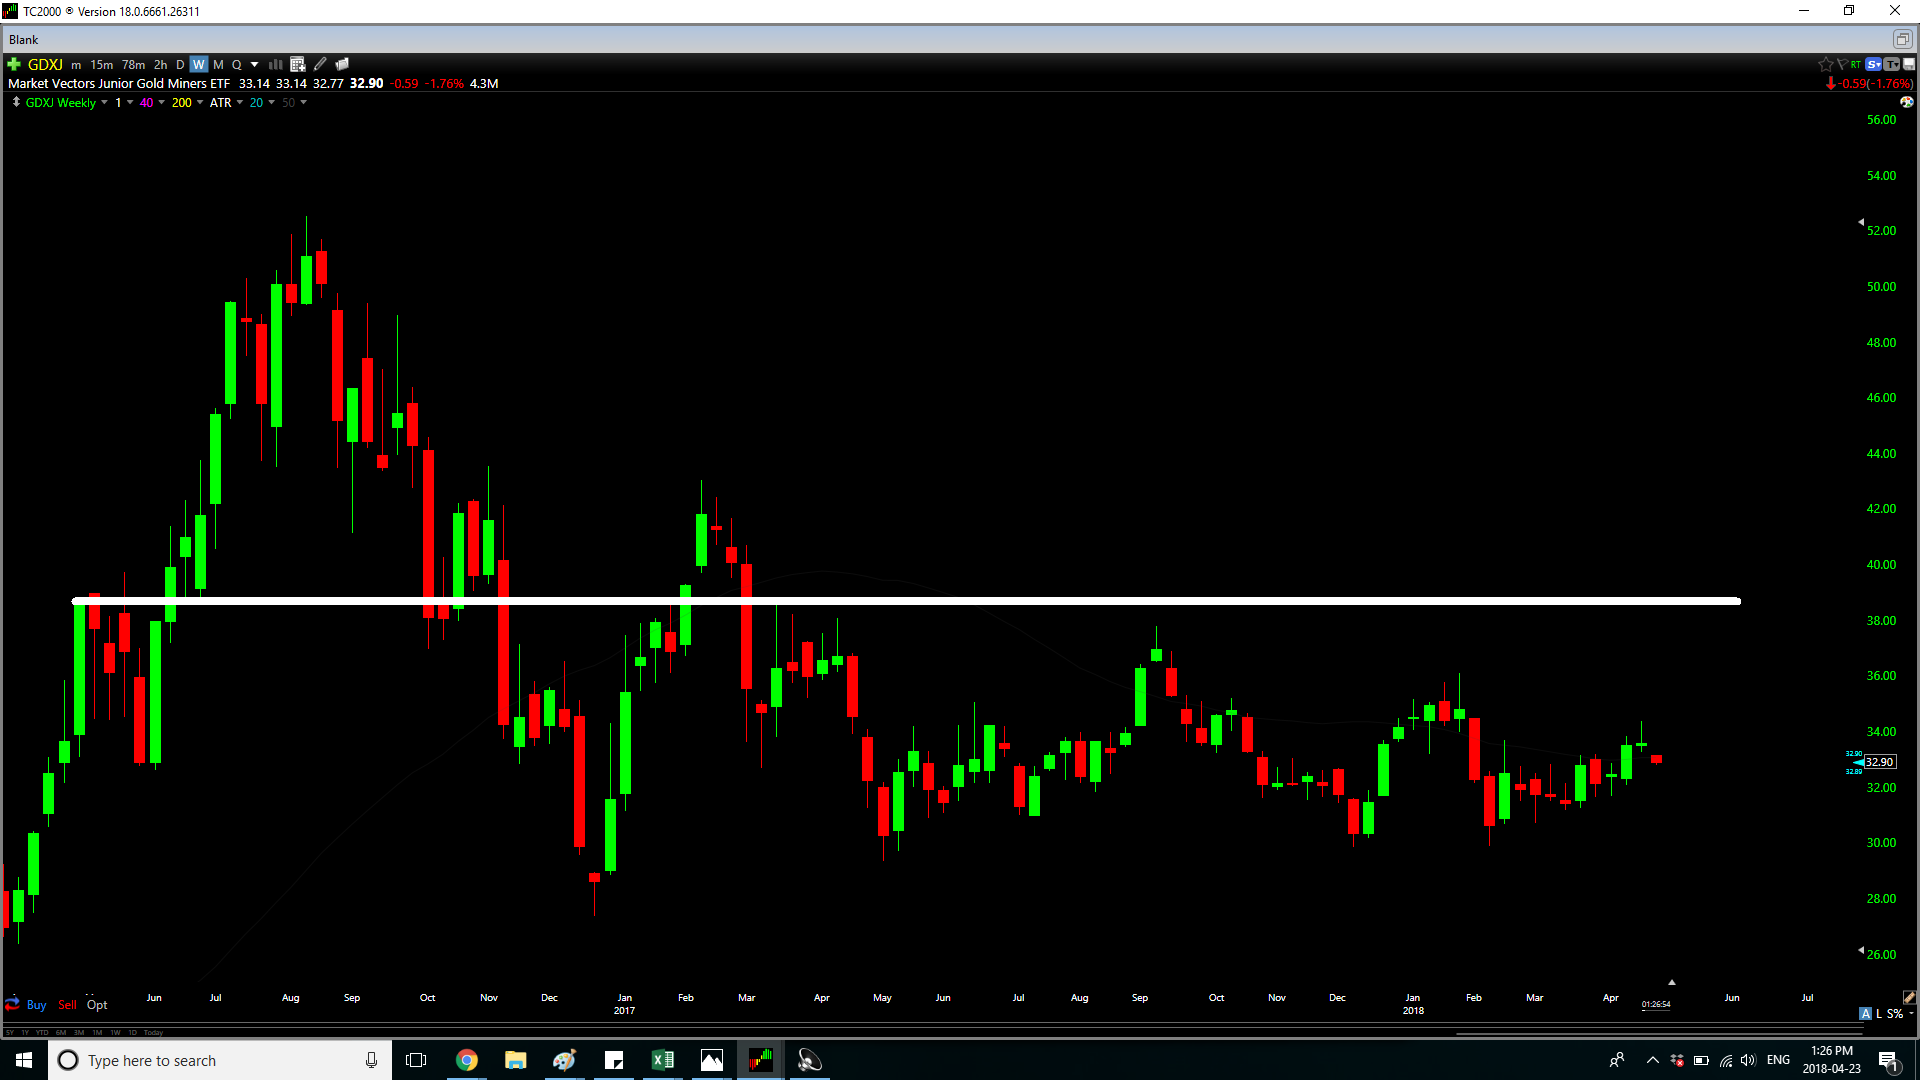
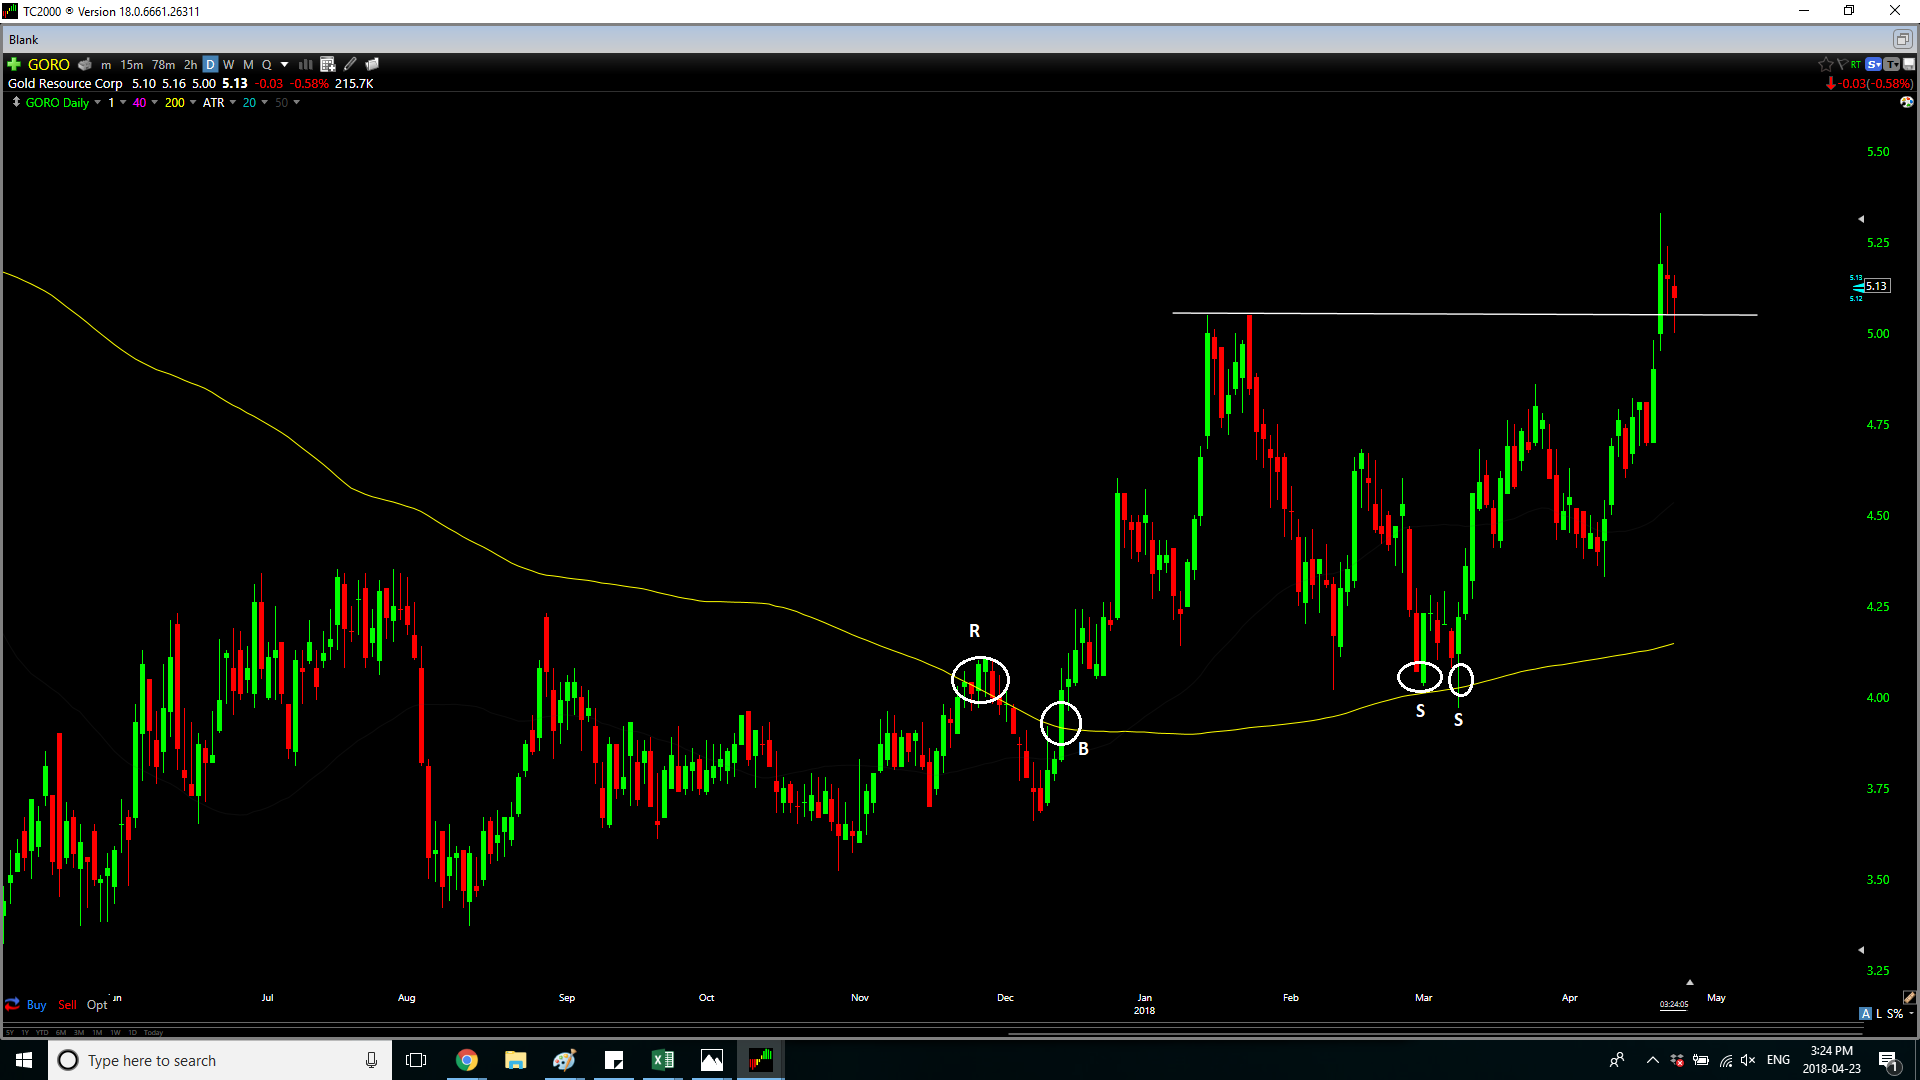
Using a slightly more objective approach and purely moving averages, the same divergence is very clearly visible. While the GDXJ continues to get rejected by any rallies near its 20-month moving average, GORO has broken back above its 20-month moving average and is set for its first clean close back above it in 9 months. The key for the stock is closing the month above $4.50 US as this would confirm a clean close back above this level which has since provided some resistance.
 (Source: TC2000.com)
 (Source: TC2000.com)
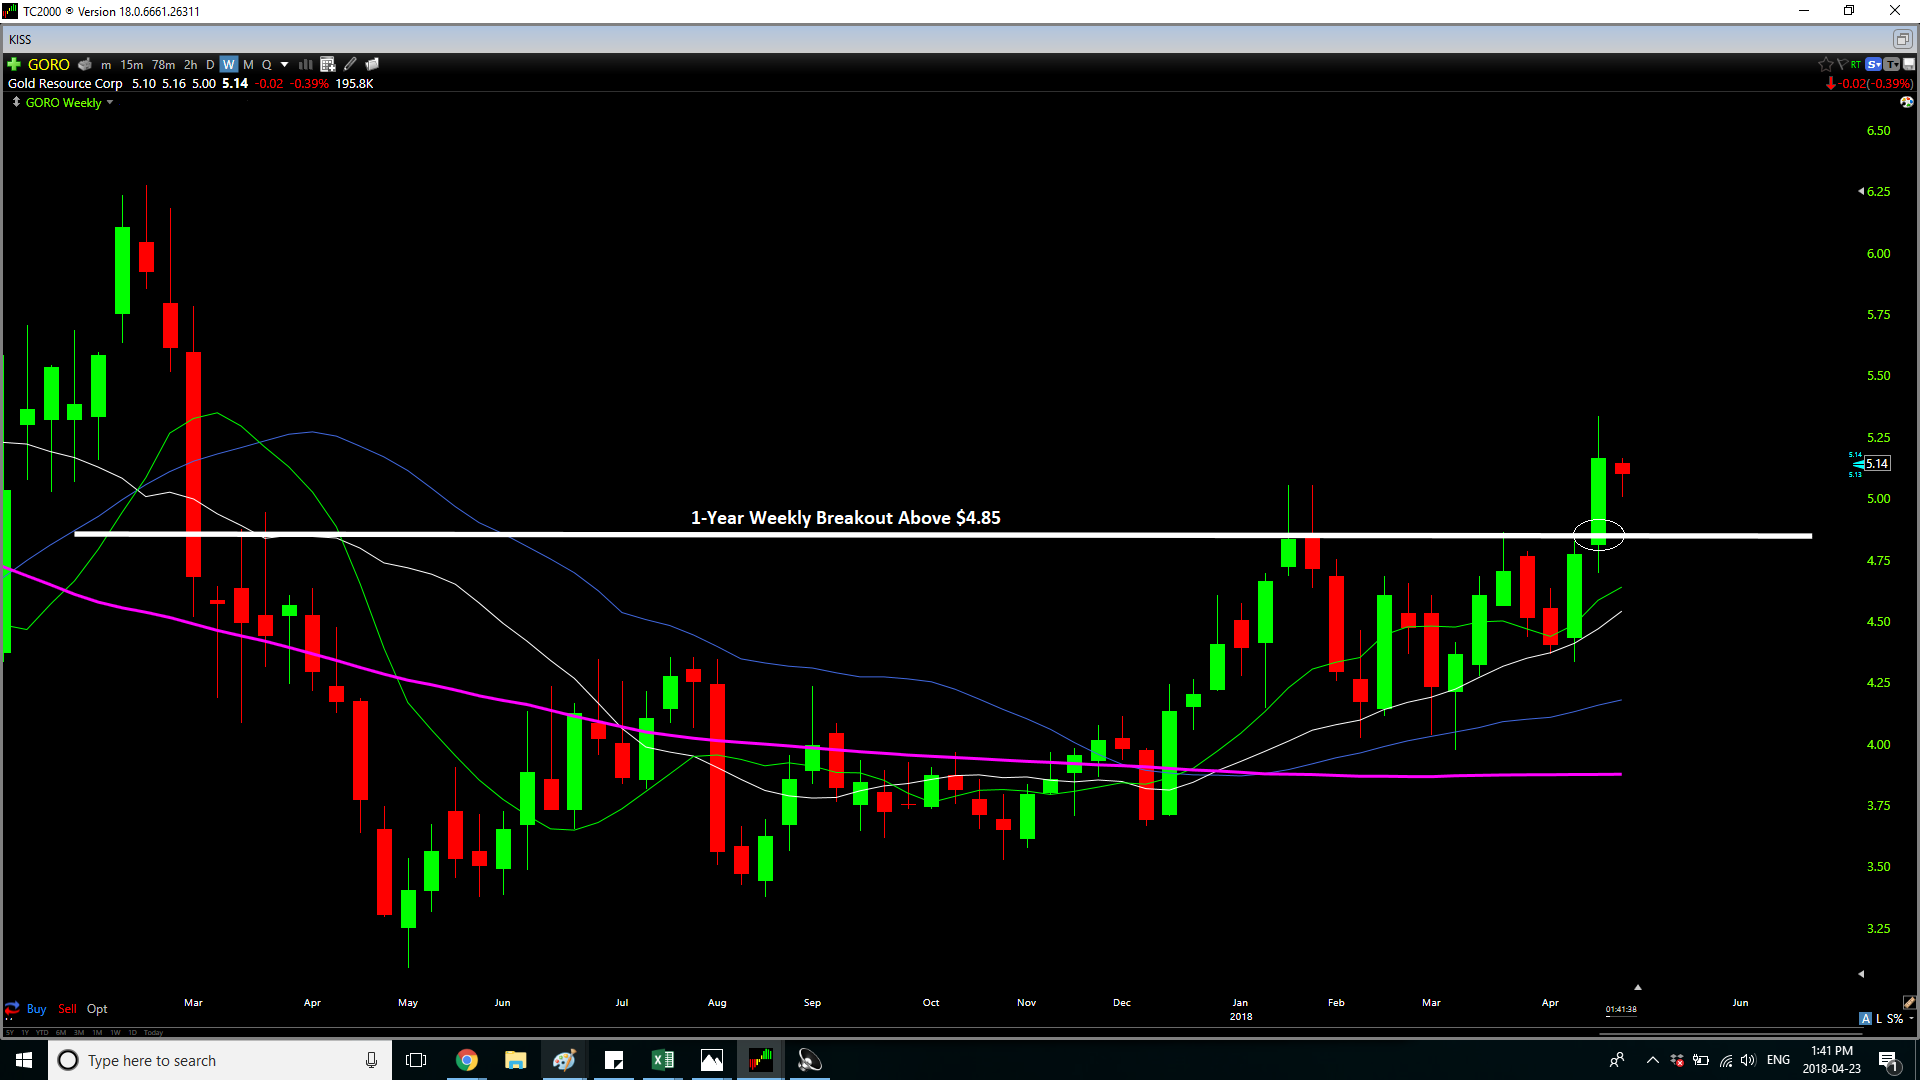
As we can see from the below chart, Gold Resource Corporation registered a 1-year breakout on the weekly chart last week above the key $4.85 level. This level has provided resistance on several occasions over the past 6 months and this supply looks to finally be accumulated by stronger hands. As of last week, the bulls have plowed through the $4.85 level with ease and this will be a key level for them to defend going forward on a weekly closing basis.
 (Source: TC2000.com)
Fundamentals - Costs Down, Production Headed Up
Gold Resource Corporation is situated in Oaxaca, Mexico and Nevada, US, with operations in the former and development stage projects in the latter. The company has produced an average of 27,5000 gold ounces the past two years, in addition to over 1.7 million ounces of silver. Guidance is expected to stay the same for 2018 with roughly 27,000 ounces of gold for 2018, as well as 1.7 million ounces of silver.
While this may not seem all that exciting as Gold Resource Corp. is a relatively small producer, the company has enjoyed exceptional margins recently. Due to the increase in base metal prices and the areas being mined recently, total all-in sustaining gold equivalent cash costs came in at $590/oz for 2017, a decrease of $380/oz from $970/oz from 2016 levels. This works out to margins of over $700/oz on gold equivalent ounces sold, significantly better than the industry average margin of roughly $400/oz. It should be noted that much of this decrease in all-in sustaining cash costs was due mainly to strong base metal prices (zinc, copper).
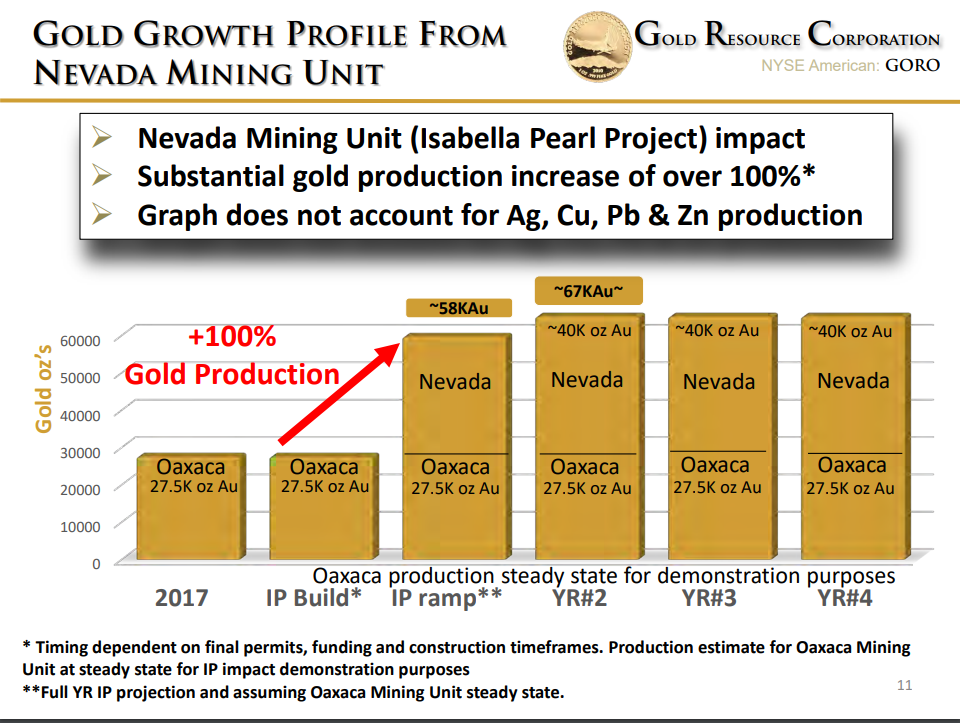
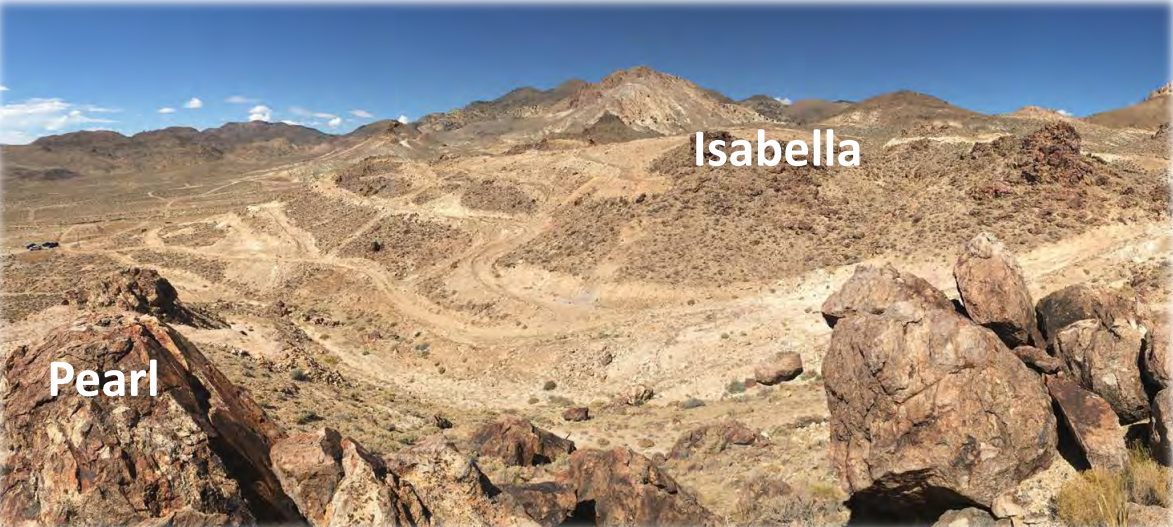
So what's so great about a small scale producer with strong margins in Mexico? The growth potential from their Nevada Project. The company recently released news that their Isabella Pearl Gold Project in Nevada has seen reserves increase by more than double, equating to 190,000+ ounces of gold and over 1.1 million ounces of silver. The grades on these ounces are quite impressive at 2.2 grams per tonne gold and 13 grams per tonne silver on average, with the Proven portion showing higher grades of 5.44 grams per tonne gold and 37 grams per tonne silver on half of the reserves. Based on the potential for this to be a heap-leach project, capital expenditures remaining to put the Isabella Pearl Project in development are between $15 - $20 million. While this may not be able to be covered purely by cash-flow, the majority of it should be. The company also has a current cash balance of over $20 million.
(Source: Company Presentation)
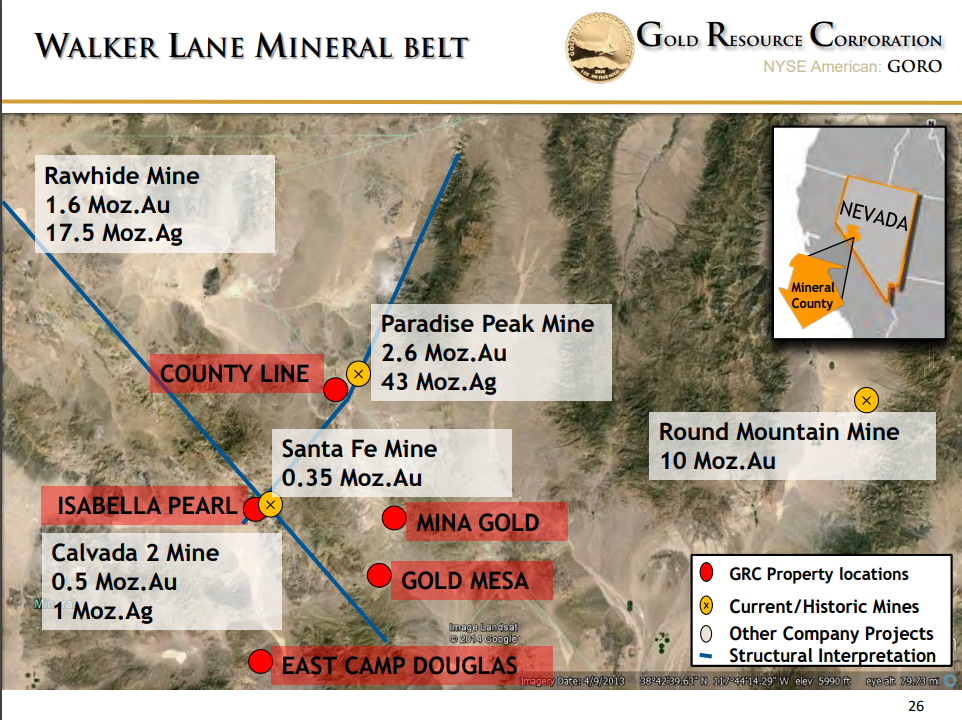
More work is still required to finalize a production decision at Isabella Pearl, but conservative targeted production ranges are for 20,000+ ounces per year of gold production, and the potential for 30,000+ ounces a year by Year 2-3. This would allow the company the ability to nearly double their current production by the year 2020 based on a 2018 production decision. As a bonus to the Nevada story, the company has four other high-grade gold projects in the Walker Lane gold mining district of Nevada, each with strong historic drill results. All of the projects are located within 30 miles of each-other and have the potential to act as satellite deposits if Isabella Pearl can move into production and exploration continues to be a success. While these are a lot of if's to work with, it never hurts to have a reasonable amount of exploration upside in a jurisdiction where a company is looking to begin production.
(Source: Company Presentation)
(Source: Company Presentation)
Gold Resource Corporation is not my typical pick for a mining play given its small production scale and its operations in Mexico. Having said that, the bonus is clearly the Nevada side of the story, and the potential to double annual production within the next two years if things move ahead smoothly. This would be less attractive if this required meaningful capital expenditures to move into production, but this is not the case whatsoever with Gold Resource Corporation. The company has a cash position of over $20 million, has no debt, and remaining capital expenditures for the project is slated at $20 million or so (requiring minimal dilution if financing is required to fund start-up).
 (Source: TC2000.com)
 (Source: TC2000.com)
On top of what looks to be a reasonable fundamental growth story, the technicals are acting great and telling me the stock seems to be a leader among the other miners. While the majority of other miners can barely get their heads back above their 200-day moving averages for more than a few days, Gold Resource Corp. has been trending higher above its 200-day moving average for months now. The stock broke out above its 200-day moving average in mid-December shown on the chart and then found support on following tests of the 200-day moving average. This tells me that the 200-day moving average has likely flipped to support going forward and a new uptrend may have begun in this name. When we compare this with the GDXJ chart above, we can see this is a massive out-performance. The GDXJ cannot seem to spend any meaningful time above its 200-day moving average and is clearly not trending above it at all.
So what if I'm wrong in my assessment of GORO?
As always, all of my entries have stops mapped out, and I have an "uncle" point for every trade. A move below the $4.50 level would tell me that this stock may need more work in building a base and this would force me to exit the position at less than an 8% loss from my $4.88 entry last week. The thinking behind this stop is that this stock has significant return potential if this is a new uptrend, but a minimal risk to my portfolio if my assessment turns out to be incorrect. As I have stated several times over in previous articles and unlike many analysts in the mining space, I do not care about being right, I just care about making money. I do not let my positions drop 40-50% to protect my ego and I don't make bullish calls without explicitly stating where my thesis would be invalidated. My trading philosophy is "strong opinions, weakly held" and while I am extremely bullish on Gold Resource Corp. which prompted my entry at $4.88 US, I would move to neutral and to the sidelines if price were to violate the $4.50 US level.
If the Gold Miners Index and or Junior Gold Miners Index should finally be able to gain some traction and break out of their long-term bases, I would expect Gold Resource Corporation to be a leader in the space. The stock started trending modestly higher earlier this year without the help of the indexes, has made a 1-year breakout without the help of the indexes and should benefit from any tailwinds from the indexes in the future. My assessment of the stock as a leader would dampen if the $4.55 level is lost.
Disclosure: I am/we are long GORO.
I wrote this article myself, and it expresses my own opinions. I am not receiving compensation for it (other than from Seeking Alpha). I have no business relationship with any company whose stock is mentioned in this article.
Follow Taylor Dart and get email alerts