Gold's Outlook CPI Data / Commodities / Gold & Silver 2024

The CPI data isgoing to be released today, so the markets are tense.
Gold'sGains Limited by Short-Term Resistance
Gold moved slightly higher, but thevery short-term resistance line based on the previous highs keeps gold’s gainsin check.
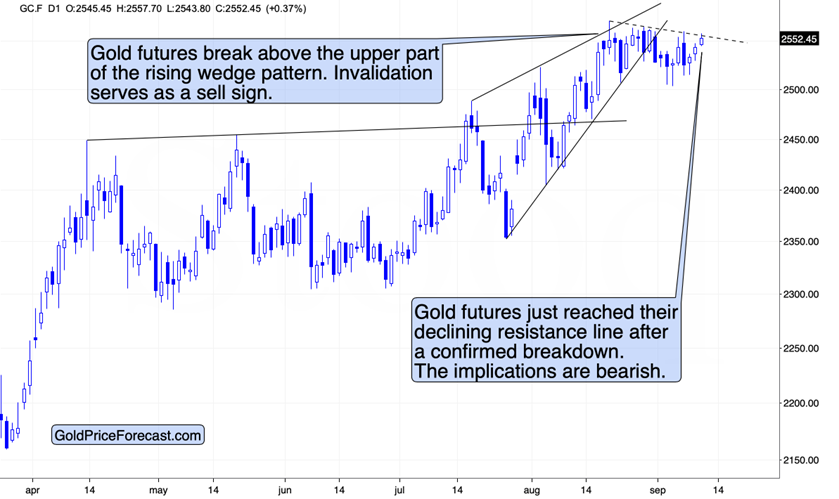
The fact that goldalready confirmed the breakdown below its rising wedge channel makes the following declines likely from the short-term point of view.
And from the medium-term point of view, we get similar (but stronger) indication from thecurrent seasonality. Afterall, we’re after the U.S. Labor Day.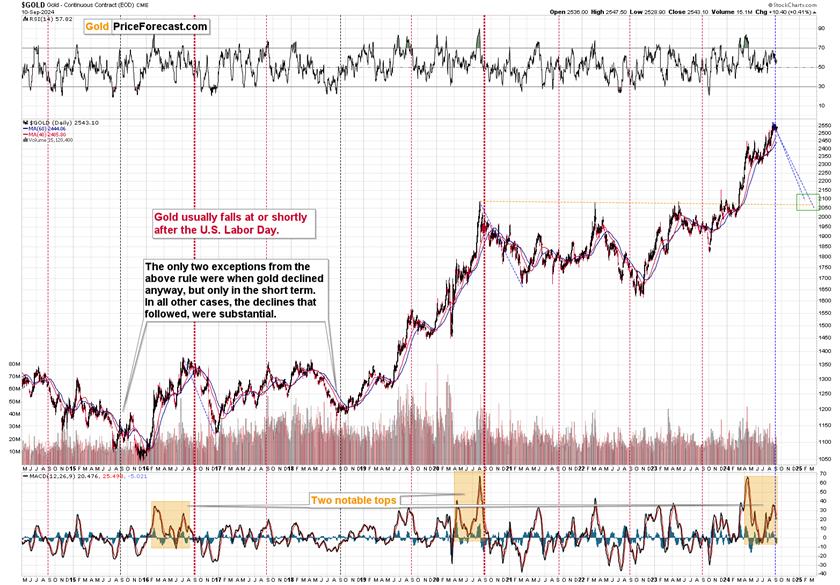
The bearish implications of thisimportant point in time haven’t played out yet,but it doesn’t mean that they are any less likely to take gold lower in the following days or weeks. As I wrotepreviously, gold price doesn’t have to decline immediately after Labor Day – itcould trade sideways for some time, and then decline in a meaningful way.
It’s not the exact timing that has been so consistent over the previous years, but the importance of thedeclines that (sooner or later) followed.
Given the similarity that we see in the MACD indicator (bottom of the above chart) to the 2020 and 2016 tops and the factthat those two years were also the U.S. presidential election years (just likethe current year), it seems that we can expect much lower gold prices in thefollowing weeks and months.
GDXJ PatternEchoes Previous Declines
Let’s see what the GDXJ did in thoseyears.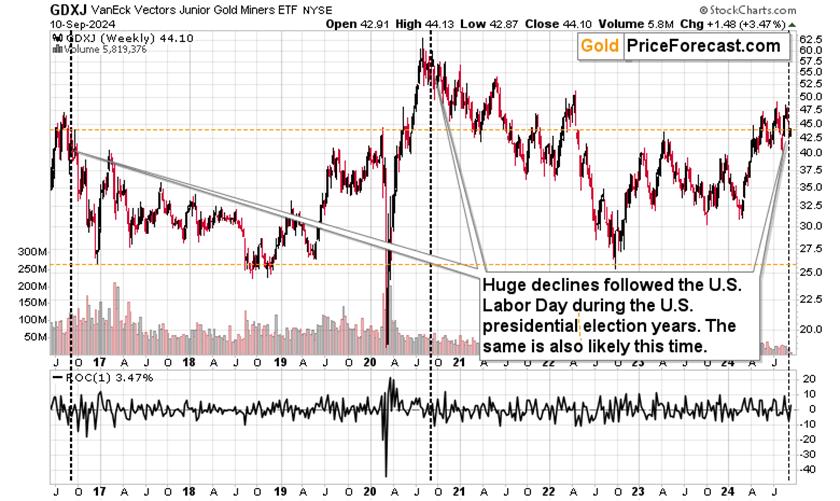
Of course, it declined. What’s not soobvious before one looks at the above chart is that those Labor Days were thestarting points (approximately – the tops actually formed earlier, just like ithappened this year) of really big declines in the junior mining stocks.
In particular, the 2016 case seemssimilar as the GDXJ is trading at very similar price levels (note the orange,dashed lines). If history rhymes, then we can expect the GDXJ to decline to its2022 low or so. That would be an almost $20 downswing – a truly powerful one.
Now, in those two years, the stock marketdidn’t decline, and it’s quite likely to decline this year. This means that thedeclines in the GDXJ could be bigger than what we saw in 2016 or after the 2020top. After all, the above chart includes one case when stocks plunged – inearly 2020 during the Covid/lockdown scare – miners declined very fast in thiscase. The same was the case in 2008 when stock plunged.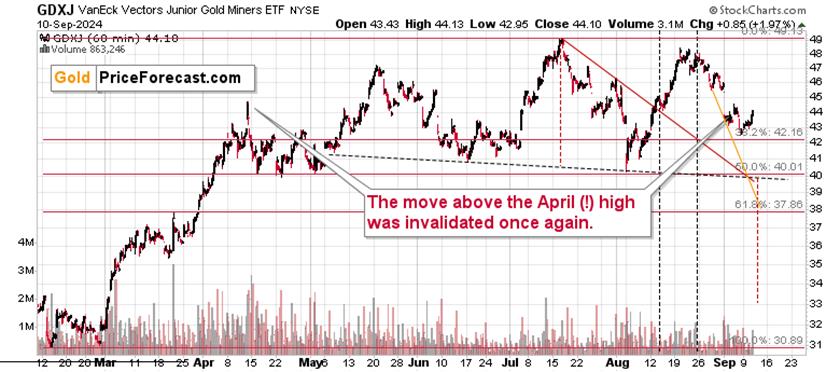
On a very short-term basis, we saw arebound, which took place right at the triangle-vertex-based turning point. Ipreviously wrote about the possibility that GDXJ could decline to about $40 andperhaps bottom there (for a short while) at this turning point (yesterday), but instead another – also probable – scenariohappened. We got a small rebound.
This doesn’t change the fact that the twosupport lines and the 50% Fibonacci retracement still provide a quite strong(but short-term only) support at about $40, so we might get a rebound when GDXJmoves to this level.
Then – as I discussed above – minerswould be likely to decline once again.
Naturally, the above is up-to-date at themoment when it was written. When the outlook changes, I’ll provide an update.If you’d like to read it as well as other exclusive gold and silver priceanalyses, I encourage you to sign up for our freegold newsletter.
Przemyslaw Radomski, CFA
Founder, Editor-in-chief
Toolsfor Effective Gold & Silver Investments - SunshineProfits.com
Tools für EffektivesGold- und Silber-Investment - SunshineProfits.DE
* * * * *
About Sunshine Profits
SunshineProfits enables anyone to forecast market changes with a level of accuracy thatwas once only available to closed-door institutions. It provides free trialaccess to its best investment tools (including lists of best gold stocks and best silver stocks),proprietary gold & silver indicators, buy & sell signals, weekly newsletter, and more. Seeing is believing.
Disclaimer
All essays, research and information found aboverepresent analyses and opinions of Przemyslaw Radomski, CFA and SunshineProfits' associates only. As such, it may prove wrong and be a subject tochange without notice. Opinions and analyses were based on data available toauthors of respective essays at the time of writing. Although the informationprovided above is based on careful research and sources that are believed to beaccurate, Przemyslaw Radomski, CFA and his associates do not guarantee theaccuracy or thoroughness of the data or information reported. The opinionspublished above are neither an offer nor a recommendation to purchase or sell anysecurities. Mr. Radomski is not a Registered Securities Advisor. By readingPrzemyslaw Radomski's, CFA reports you fully agree that he will not be heldresponsible or liable for any decisions you make regarding any informationprovided in these reports. Investing, trading and speculation in any financialmarkets may involve high risk of loss. Przemyslaw Radomski, CFA, SunshineProfits' employees and affiliates as well as members of their families may havea short or long position in any securities, including those mentioned in any ofthe reports or essays, and may make additional purchases and/or sales of thosesecurities without notice.
Przemyslaw Radomski Archive |
© 2005-2022 http://www.MarketOracle.co.uk - The Market Oracle is a FREE Daily Financial Markets Analysis & Forecasting online publication.