Gold's Summer Doldrums? / Commodities / Gold & Silver 2019

 Gold’s incrediblestrength this summer is very unusual, as early summers are the weakest times ofthe year seasonally for gold, silver, and their miners’ stocks. With traders’ attention diverted to vacationsand summer fun, interest in and demand for precious metals normally wane. So this entire sector tends to suffer aseasonal lull, along with the general markets. This June’s bull-market breakout is a momentous anomaly.
This doldrums term is very apt for gold’s usualsummer predicament. It describes a zonein the world’s oceans surrounding the equator. There hot air is constantly rising, creating long-lived low-pressureareas. They are often calm, with littleor no prevailing winds. History is fullof accounts of sailing ships getting trapped in this zone for days or weeks,unable to make headway. The doldrumswere murder on ships’ morale.
Crews had no idea whenthe winds would pick up again, while they continued burning through their limitedstores of food and drink. Without movingair, the stifling heat and humidity were suffocating on these ships long beforeair conditioning. Misery and boredomwere extreme, leading to fights breaking out and occasional mutinies. Being trapped in the doldrums was viewed withdread, it was a very trying experience.
Gold investors cansomewhat relate. Like clockwork nearlyevery summer, gold starts driftinglistlessly sideways. It often can’tmake significant progress no matter what the trends looked like heading intoJune, July, and August. As the days andweeks slowly pass, sentiment deteriorates markedly. Patience is gradually exhausted, supplantedwith deep frustration. Plenty of traderscapitulate, abandoning ship.
Thus after decades oftrading gold, silver, and their miners’ stocks, I’ve come to call this time ofyear the summer doldrums. Junes and Julies in particular are usuallydesolate sentiment wastelands for precious metals, totally devoid of recurringseasonal demand surges. Unlike much of therest of the year, these summer months simply lack any major income-cycle orcultural drivers of outsized gold investment demand.
The vast majority ofthe world’s investors and speculators live in the northern hemisphere, somarkets take a back seat to the great joys of summer. Traders take advantage of the long sunny daysand kids being out of school to go on extended vacations, hang out withfriends, and enjoy life. And when theyaren’t paying much attention to the markets, naturally they aren’t allocatingmuch new capital to gold.
Given gold’s dullsummer action historically, it is never wise to expect too much from it thistime of year. Summer rallies can happen,but they aren’t common. So expectationsneed to be tempered, especially in Junes and Julies. That early-1990s Gin Blossoms song “HeyJealousy” comes to mind, declaring “If you don’t expect too much from me, youmight not be let down.” The markets areultimately an expectations game.
Quantifying gold’ssummer seasonal tendencies during bull markets requires all relevant years’ priceaction to be recast in perfectly-comparable percentage terms. That is accomplished by individually indexing each calendar year’s gold price to its lastclose before market summers, which is May’s final trading day. That is set at 100, then all gold-priceaction each summer is recalculated off that common indexed baseline.
So gold trading at anindexed level of 105 simply means it has rallied 5% from May’s final close,while 95 shows it is down 5%. Thismethodology renders all bull-market-year gold summers in like terms. That’s necessarysince gold’s price range has been so vast, from $257 in April 2001 to $1894 inAugust 2011. That span encompassedgold’s last secular bull, which enjoyed a colossal 638.2% gain over those 10.4 years!
Obviously 2001 to 2011 werecertainly bull years. 2012 wastechnically one too, despite gold suffering a major correction following thatpowerful bull run. At worst that year,gold fell 18.8% from its 2011 peak. Thatwas not quite enough to enter formal bear territory at a 20%+ drop. But 2013 to 2015 were definitely brutal bearyears, which need to be excluded since gold behaves very differently in bulland bear markets.
In early 2013 the Fed’swildly-unprecedented open-ended QE3 campaign ramped to full speed, radically distortingthe markets. Stock markets levitated onthe Fed’s implied backstopping, slaughtering demand for alternative investmentsled by gold. So in Q2’13 alone, gold plummeted22.8% which proved its worst quarter in an astounding 93 years! Gold’s bearcontinued until the Fed started hiking rates again in late 2015.
The day after thatfirst rate hike in 9.5 years in mid-December 2015, gold plunged to a major6.1-year secular low. Then it surged outof that irrational rate-hikescare, formally crossing the +20% new-bull threshold in early March2016. Ever since, gold has remained in this current bull. At worst in December 2016 after gold was crushedon the post-election Trumphoria stock-market surge, it hadonly corrected 17.3%.
So the bull-marketyears for gold in modern history ran from 2001 to 2012, skipped the interveningbear-market years of 2013 to 2015, then resumed in 2016 to 2019. Thus these are the years most relevant tounderstanding gold’s typical summer-doldrums performance, which is necessaryfor managing your own expectations this time of year. This spilled-spaghetti mess of a chart is fairlysimple and easy to understand.
The yellow lines showgold’s individual-year summer price action indexed from each May’s final closefor all years from 2001 to 2012 and 2016 to 2017. 2018’s is rendered in light blue. Together these establish gold’s summertrading range. All those past bull-marketyears’ individual indexes are averaged together in the red line, revealing gold’scentral summer tendency. 2019’s indexedaction is superimposed in dark blue.
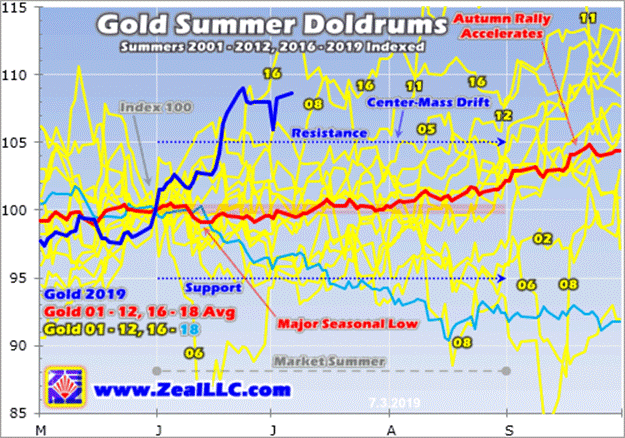
While there are outlieryears, gold generally drifts listlessly in the summer doldrums much like asailing ship trapped near the equator. The center-mass drift trend is crystal-clear in this chart. The vast majority of the time in June, July,and August, gold simply meanders between 5% from May’s final close. This year that equated to a probable summerrange between $1240 to $1370. Gold tendsto stay well within trend.
Obviously this year hasproven a huge exception to that normal summer rule, with gold rocketing higherto a major bull-marketbreakout! Gold blasted to its bestearly-summer performance ever seen in all modern bull-market years. Comparing this current summer’s dark-blueline to past years’ price action certainly drives home how unique, exceptional,and special gold’s breakout surge to major new secular highs has been.
Still, understandinggold’s typical behavior this time of year is important for traders. Sentiment isn’t only determined by outcome,but by the interplay between outcome andexpectations. If gold rallies 5% butyou expected 10% gains, you will be disappointed and grow discouraged andbearish. But if gold rallies that same5% and you expected no gains, you’ll be excited and get optimistic andbullish. Expectations are key.
History has proven it iswise not to expect too much from gold in these lazy market summers,particularly Junes and Julies. Occasionallygold still manages to stage a summer rally, like this year’s monster. But most of the time gold doesn’t veermaterially from its usual summer-drift trading range, where it is often adriftlike a classic tall ship. With rangebreakouts either way uncommon, there’s often little to get excited about.
In this chart I labeledsome of the outlying years where gold burst out of its usual summer-drifttrend, both to the upside and downside. But these exciting summers are atypical, and can’t be expected veryoften. Most of the time gold grinds sideways on balance not far from itsMay close. Traders not armed with thiscritical knowledge often wax bearish during gold’s summer doldrums and exit infrustration, a real mistake.
Gold’s summer-doldrumslull marks the best time of the year seasonally to deploy capital, to buy low at a time when few others are willing. Gold enjoys powerful seasonal rallies that start in Augusts and run until the following Mays! These are fueled by outsized investment demanddriven by a series of major income-cycle and cultural factors from around theworld. Summer is when investors shouldbe bullish, not bearish.
The red average indexedline above encompassing 2001 to 2012 and 2016 to 2018 reveals gold’s trueunderlying summer trend in bull-market years. Technically gold’s major seasonal low arrives relatively early insummers, mid-June. On average throughall these modern bull-market years, gold slumped 0.9% between May’s close andthat summer nadir. But seasonally that’sstill on the early side to deploy capital.
Check out the yellowindexed lines in this chart. They tendto cluster closer to flatlined in mid-June than through all of July. The only reason gold’s seasonal low appearsin mid-June mathematically is a single extreme-outlier year, 2006. The spring seasonal rally wasepic that year, gold rocketed 33.4% higher to a dazzling new bull high of $720in just 2.0 months between mid-March to mid-May! That was incredible.
Extreme euphoria hadcatapulted gold an astounding 38.9% above its 200-day moving average, radicallyoverbought by any standard. That was waytoo far too fast to be sustainable, so after that gold had to pay the piper ina sharp mean-reversion overshoot. Soover the next month or so into mid-June, gold’s overheated price plummeted21.9%! That crazy outlier is the onlyreason gold’s major summer low isn’t later.
There were 15bull-market years from 2001 to 2012 and 2016 to 2018. That is a big-enough sample to smooth out thetrend, but not large enough to prevent extreme deviations from skewing it abit. Gold sees a series of marginally-higherlows in late June, early July, and even late July. In this dataset they came in 0.0%, 0.3%, and0.8% higher than mid-June’s initial low. And that last late-July one arrives over 6 weeks later.
So generally there’s nohurry to deploy capital right at that initial mid-June seasonal low. Gold tends to drift nearly flatlined over thenext several weeks into early July, trying traders’ patience. Buying within a few trading days of the US IndependenceDay holiday seems to have the best odds of catching gold near its summer-doldrumslows. Investment capital inflows usuallybegin ramping back up after that as traders return.
On average in thesemodern bull-market years, gold slipped 0.4% in Junes before rallying 0.7% inJulies. After July’s initial lazy summerweek, gold tends to gradually start clawing its way back higher again. But this is so subtle that Julies often stillfeel summer-doldrumsy. By the final tradingday in July, gold is still only 0.3% higher than its May close kicking offsummers. That’s too small to restoredamaged sentiment.
Since gold exited May2019 at $1305, an average 0.3% rally by July’s end would put it at $1309. That’s hardly enough to generate excitementafter two psychologically-grating months of drifting. But the best times to deploy any investmentcapital are when no one else wants to so prices are low. Gold’s summer doldrumscome to swift ends in Augusts, which saw hefty average gains of 1.9% in thesebull-market years!
And that’s just thestart of gold’s major autumnseasonal rally, which has averaged strong 5.7% gains between mid-Junes tolate Septembers. That is driven by Asiangold demand coming back online, first post-harvest-surplus buying and laterIndian-wedding-season buying. June isthe worst of gold’s summer doldrums, and thefirst half of July is when to buy back in. It’s important to be fully deployed before August.
These gold summerdoldrums driven by investors pulling back from the markets to enjoy theirvacation season don’t exist in a vacuum. Gold’s fortunes drive the entireprecious-metals complex, including both silver and the stocks of the goldand silver miners. These are effectivelyleveraged plays on gold, so the summer doldrums in them mirror and exaggerategold’s own. Check out this same charttype applied to silver.
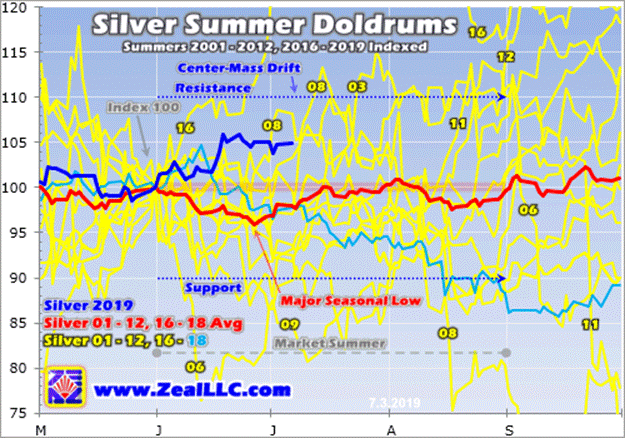
Since silver is muchmore volatile than gold, naturally its summer-doldrums-drift trading range iswider. The great majority of the time,silver meanders between 10% from its final May close. That came in at $14.56 this year, implying asummer-2019 silver trading range between $13.10 to $16.02. While silver suffered that extreme June-2006selling anomaly too, its major seasonal low arrives a couple weeks aftergold’s.
Given gold’sspectacular bull-market-breakout surge last month, silver’s summer performancethis year has been utterly dismal. Normally silver amplifies gold upside by at least 2x. But silver has been bombed out and languishingfor so long that investors and speculators still want nothing to do withit. Silver often acts as a goldsentiment gauge, and gold hasn’t been over $1400 long enough yet to shiftpsychology to bullish.
On average in thesesame gold-bull-market years of 2001 to 2012 and 2016 to 2018, silver dropped 4.1%between May’s close and late June. Thatis much deeper than gold’s 0.9% seasonal slump, which isn’t surprising givensilver’s leverage to gold. Silver’ssummer performances are also much lumpier than gold’s. Junes see average silver losses of 3.2%, butthose are more than erased in strong rebounds in Julies.
Silver’s big 3.6%average rally in Julies amplifies gold’s gains by an impressive 5.1x! But unfortunately silver hasn’t been able tomaintain that seasonal momentum, with Augusts averaging a modest decline of 0.7%. Overall from the end of May to the end ofAugust, silver’s summer-doldrums performance tends to drift lower. Silver averaged a 0.4% full-summer loss, waybehind gold’s 2.2% gain through June, July, and August.
That means silversentiment this time of year is often worse than gold’s, which is alreadyplenty bearish. The summer doldrums aremore challenging for silver than gold. Being in the newsletter business for a couple decades now, I’ve heardfrom countless discouraged investors over the summers. While I haven’t tracked this, it sure feelslike silver investors have been disproportionally represented in that feedback.
Since gold is silver’s primary driver,this white metal is stuck in the same dull drifting boat as gold in the marketsummers. Silver usually leverageswhatever is happening in gold, both good and bad. But again the brunt of silver’s summerweakness is borne in Junes. Fully expectingthis seasonal weakness and rolling with the punches helps prevent gettingdisheartened, which in turn can lead to irrationally selling low.
The gold miners’ stocksare also hostage to gold’s summer doldrums. This last chart applies this same methodology to the flagship HUIgold-stock index, which mostly closely mirrors that leading GDX VanEckVectors Gold Miners ETF. The major goldstocks tend to amplify gold’s gains and losses by 2x to 3x, so it is not surprisingthat the HUI’s summer-doldrums-drift trading range is also twice as wide asgold’s own.
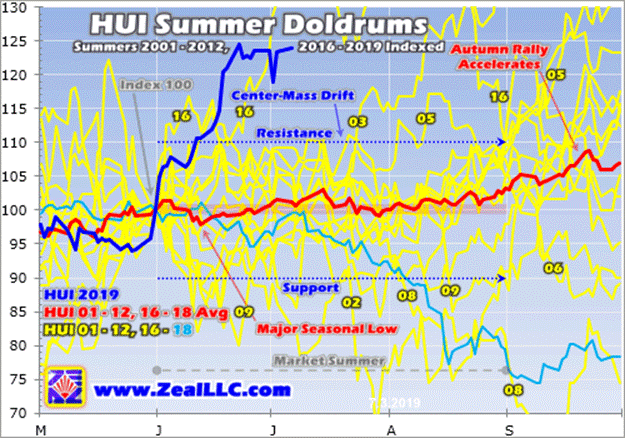
The gold miners’ stocks share silver’scenter-mass summer drift running 10% from May’s close. This year the HUI entered the summer doldrumsat 157.1, implying a June, July, and August trading range of 141.4 to 172.8. While gold stocks’ GDX ETF is too young to dolong-term seasonal analysis on, in GDX terms this summer range translates to $19.43to $23.75 this year. That’s based off aMay 31st close of $21.59.
Thanks to gold’sdazzling bull-market breakout, gold stocks have defied these weak summerseasonals this year to soar to their own major decisive breakout! This high-potentialcontrarian sector has enjoyed its best early-summer performance everwitnessed in gold’s modern bull-market years. While I hope this incredible outperformance persists,the summer doldrums could still reassert themselves if gold retreats.
Like gold, the gold stocks’ major summerseasonal low arrives in mid-June. Onaverage in these gold-bull-market years of 2001 to 2012 and 2016 to 2018, bythen the HUI had slid 2.1% from its May close. Then gold stocks tended to more than fully rebound by the end ofJune, making for an average 0.6% gain that month. But there is no follow-through in July, wherethe gold stocks averaged a modest 0.5% loss.
Overall between the end of May and the endof July, which encompasses the dark heart of the summer doldrums, the HUI proveddead flat on average. Again two solidmonths of grinding sideways on balance is hard for traders to stomach,especially if they’re not aware of the summer-doldrums drift. The key to surviving it with minimum psychologicalangst is to fully expect it. Managingexpectations in markets is essential!
But also like gold, the big payoff forweathering the gold-stock summer starts in August. With gold’s major autumn rally gettingunderway, the gold stocks as measured by the HUI amplify it with good averagegains of 3.1% in Augusts! And that’s onlythe start of gold stocks’ parallelautumn rally with gold’s, which has averaged 9.3% gains from late Julies tolate Septembers. Gold-stock upside resumes in late summers.
Like much in life,withstanding the precious-metals summer doldrums is less challenging if youknow they’re coming. While outlyingyears happen, they aren’t common. So theonly safe bet to make is expecting gold, silver, and the stocks of their miners to languish in Junes and Julies. Then when these drifts again come to pass,you won’t be surprised and won’t get too bearish. That will protect you from selling low.
The precious-metals sectorradically bucked its seasonal-slump trend this year, surging to a recordstart. Gold began blasting higher onMay’s final trading day, and that sharp rally carried into early June. New trade-war tariff threats were ramping upmarket fears, driving the US stock markets to selloff lows following late April’sall-time record highs. So tradersremembered diversifying with gold and flocked back to it.
In mid-June gold’sgains accelerated after the Fed reversed its future-rate outlook from hikingback to cutting. That propelled gold to itsfirst new bull-market highs in 3.0 years, with it surging to a 5.8-yearsecular high on that late-June breakout day. That momentum fed on itself and carried gold back over $1400 for thefirst time since early September 2013. Those awesome $1400+ levels have mostly held since.
The gold miners’ stocksnaturally leveraged gold’s gains, enjoying their own epic early-summer action. The precious-metals sector is doing wildlybetter than last summer, when gold rolled over in mid-June on a sharp US dollarrally. Hyper-leveraged gold-futuresspeculators watch the dollar’s fortunes for trading cues. Hopefully gold’s huge early-summer gains canhold, and it consolidates sideways in coming weeks.
Gold’s massive and exceptionalJune rally was mostly fueled by speculators buying enormous quantities of gold futures. That has largelyexhausted their available capital firepower, and left their collective betson gold exceedingly bullish. These positionsmust be partially unwound with selling, which forces gold into a highconsolidation at best and a sharp selloff at worst. So gold isn’t out of the summer-doldrumswoods yet.
The inevitable cominggold-futures selling could be largely offset by investment buying. Investors are radically underinvested in goldafter the second-largest and first-longest stock bull in US history, giving thembig room to buy to reestablish normal portfolio allocations. Since they love chasing winners, gold’s powerful new-high psychology is starting to attract them back. Their return could dwarf gold-futuresselling.
Given gold’s long-establishedlackluster summer-doldrums performance record, it is probably not prudent tochase this rally with gold-futures speculators effectively all-in longs andall-out shorts. But the metal and itsminers’ stocks can be accumulated aggressively on any significantweakness. All portfolios need a 10%allocation in gold and gold stocks! Far-moreupside is coming after recent overboughtness is worked off.
One of my core missionsat Zeal is relentlessly studying the gold-stock world to uncover the stocks withsuperior fundamentals and upside potential. The trading books in both our popular weekly and monthly newsletters are currentlyfull of these better gold and silver miners. Mostly added in recent months as gold stocks recoveredfrom selloffs, their unrealized gains were already running as high as +105% thisweek!
If you want to multiplyyour capital in the markets, you have to stay informed. Our newsletters are a great way, easy to readand affordable. They draw on my vast experience,knowledge, wisdom, and ongoing research to explain what’s going on in themarkets, why, and how to trade them with specific stocks. As of Q1 we’ve recommended and realized 1089newsletter stock trades since 2001, averaging annualized realized gains of +15.8%! That’s nearly double the long-term stock-marketaverage. Subscribe today and take advantageof our 20%-off summer-doldrums sale!
The bottom line isgold, silver, and their miners’ stocks usually drift listlessly during marketsummers. As investors shift their focusfrom markets to vacations, capital inflows wane. Junes and Julies in particular are simplydevoid of the big recurring gold-investment-demand surges seen during much ofthe rest of the year, leaving them weak. Investors need to expect lackluster sideways action on balance this timeof year.
This summer has provenan epic exception, with gold rocketing to its first major bull-market breakout inyears! That has catapulted both themetal and its miners’ stocks to their best early-summer performances in gold’smodern bull-market years. But the summerdoldrums could still reassert themselves as specs’ excessively-bullish gold-futuresbets are bled off. So enjoy these biganomalous gains, but remain wary.
Adam Hamilton, CPA
So how can you profit from this information? We publish an acclaimed monthly newsletter, Zeal Intelligence , that details exactly what we are doing in terms of actual stock and options trading based on all the lessons we have learned in our market research. Please consider joining us each month for tactical trading details and more in our premium Zeal Intelligence service at … www.zealllc.com/subscribe.htm
Questions for Adam? I would be more than happy to address them through my private consulting business. Please visit www.zealllc.com/adam.htm for more information.
Thoughts, comments, or flames? Fire away at zelotes@zealllc.com . Due to my staggering and perpetually increasing e-mail load, I regret that I am not able to respond to comments personally. I will read all messages though and really appreciate your feedback!
Copyright 2000 - 2019 Zeal Research ( www.ZealLLC.com )
Zeal_LLC Archive |
© 2005-2019 http://www.MarketOracle.co.uk - The Market Oracle is a FREE Daily Financial Markets Analysis & Forecasting online publication.