Gold, Silver and the Commodities Supercycle / Commodities / Commodities Trading

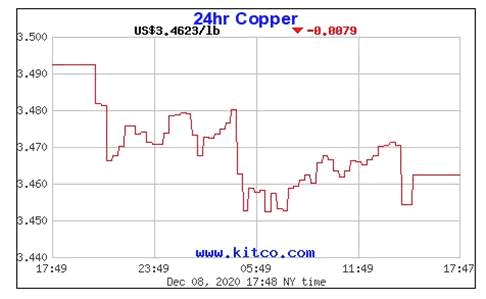
OnTuesday, Nov. 24 copper prices hit a fresh 2020 pinnacle of $3.52 per pound onthe Comex in New York. The red metal’s best performance in seven years was onthe strength of Chinese manufacturing and construction expanding at its fastestin a decade. The country’s manufacturing PMI for November, seen as a leadingindicator of copper usage, rose to 52.1 while the Caixin manufacturing PMI,which includes both large and small firms, jumped to a 10-year high of 54.9.Any number above 50 indicates an expansion. The construction index leapt from59.8 in October to 60.5.
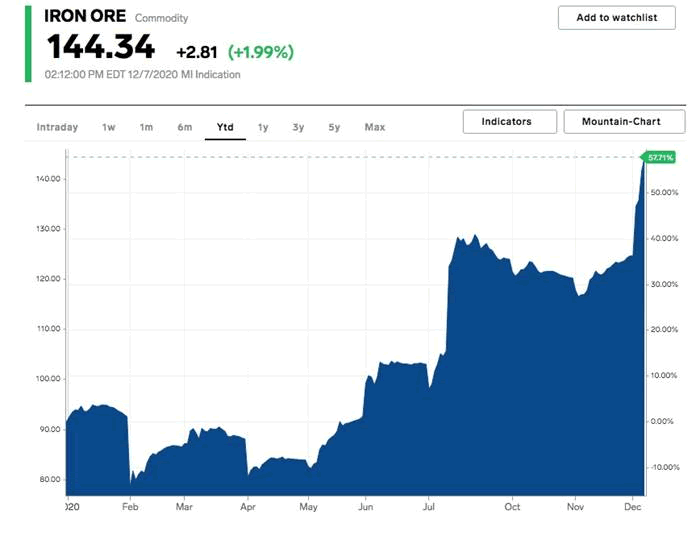
Iron orehas also been on a tear, last Friday hitting $146.93 a tonne, a seven-yearhigh.
Thenumbers are so good, some market observers are pulling up charts from the“mining supercycle”. Reuters quotes Goldman Sachs predicting a return to the “structural bullmarket” of the 2000s, when most mined commodity prices got a lift due to demand(especially in China) outstripping available supplies. In a report the investmentbank states:
“Covid is already ushering in a new era of policies aimed atsocial need instead of financial stability [which] will likely createcyclically stronger, more commodity-intensive economic growth, that shouldcreate the elusive cyclical upswing in demand.”
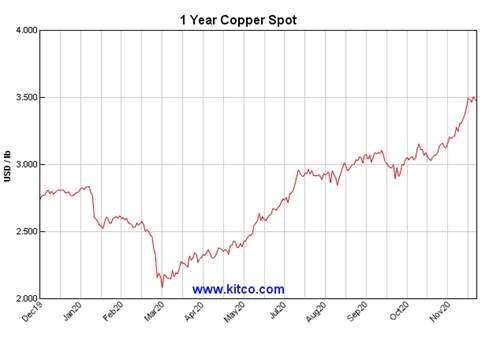
Metaltraders say copper is looking like it did at the start of the ’03 supercyclestart, having surged this year on a wave of bullish factors including a weakdollar, optimism over covid vaccines, a move toward low-carbon power sources,and virus-related supply disruptions in the key copper-producing countries ofChile, Peru and Mexico. Prices are up more than 70% from a mid-March low, andMorgan Stanley predicts a substantial increase next year, to an average $7,716a ton ($3.85/lb) in the fourth quarter.
However unlikethe previous supercycle, which depended on China, Goldman says the nextstructural bull market will be driven by spending on green energy, forwhich copper is a key ingredient:
“Spending on green infrastructure could be as significant as theBRIC (Brazil-Russia-India-China) investment boom of that decade while theredistributive push in developed markets “is likely to lead to a large boost toconsumer spending, comparable to the lending-fuelled consumption increase in the2000s.”
In a recent article we proved that copper is the most critical of all criticalmetals, because of its necessity in electrification, and the fact that there isan actual shortage of copper coming.
There is no shift from fossil fuels to green energy without the red metal, which has no substitutes for its uses in EVs (electric motors and wiring,batteries, inverters, charging stations) wind and solar energy, and 5G.
Even witha 30% penetration of EVs, a relatively conservative estimate, we need to findanother 20 million tonnes per year over 20 years.
Plus we,still need to cover all the copper demanded by electrical, construction, powergeneration, charging stations, renewable energy, 5G, high-speed rail, etc.,plus infrastructure maintenance/ buildout of new infrastructure.
That mightbe another 5-7Mt. So not only is there a 20Mt increase in copper usage requiredfor a 30% EV penetration, but another (we estimate) 5-7Mt increase to meetdemand for all of copper's other applications. To keep up, the industry willneed to find an additional two to three Kamoas a year [referring to the massivenew copper mine being built in the DRC], each producing 500,000t, for the next20 years!
Remember— over 200 copper mines are expected to run out of ore before 2035, with notenough new mines in the pipeline to take their place.It’s going to behard enough to keep up the current 20Mt per year, let alone add so much moreproduction.
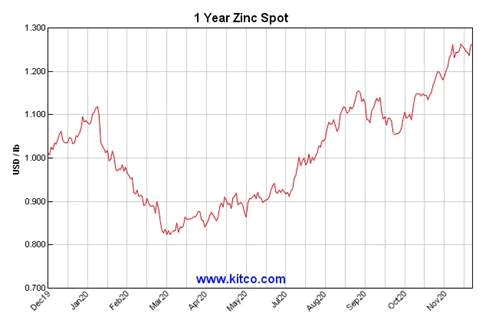
But whatif the impending copper shortage is a symptom of an even bigger problem, oropportunity, depending on whether a company is buying metals or selling them?That it isn’t just copper that is going to have trouble meeting demand, andwhose price will rise accordingly, but a host of other mined commodities? Forexample zinc, nickel and iron ore have all done quite well this year. Iron oreis up 57%, year to date, lead recently hit a one-year high on mine disruptions, zincis up 50% since its March low point,and in mid-October, nickel hit an 11-month high, according to Reuters, as expectationsof robust demand from stainless steel mills spurred fresh purchases, whileindustrial metals overall were supported by a lower dollar and healthy growthin top consumer China.
Source:Markets Insider
Currently the bulk of metals demand is coming from China, which has emergedfrom the pandemic and is doing a roaring trade. In September, the country reported a 13.2% surge in imports andexports rising 9.9% compared to the same period a year ago. Thatmonth’s combined imports and export reached a record amount in Chineseyuan-denominated terms.
Many Western countries are still in the grip of the pandemic, includingthe US and Canada, experiencing a brutal second wave of infections, but whathappens when vaccines start getting distributed? Assuming they work, curveswill flatten, hospitalization rates will decline, restrictions will ease,businesses will re-open, and a good percentage of unemployed workers willreturn to their jobs, or get new ones.
Change will be gradual, but eventually, optimistically by mid-2021,economies will come around. And that, we predict, could signal the beginning ofa new commodities supercycle, possibly even besting the 2000s commodities boom.
What will that mean for gold and silver prices?
Gold and supercycles
Studentsof previous commodity bull market cycles know that gold is usually the firstmetal to move, in a synchronized commodities upswing. That’s because gold isthe first commodity to react to an increase in the money supply. It is no coincidencethat gold soared 35% from mid-March lows, to a record $2,034 per ounce inAugust, due primarily to inflation expectations on the back of seeminglyunlimited monetary stimulus, and low interest rates worldwide.
Twoimportant catalysts for gold are a falling currency, and real or perceivedinflation. Inflation could result from an increase in the M2 money supply,which has climbed around 21% since March, although it hasn’t happened yet. Thecurrent US inflation rate sits at 1.2%.
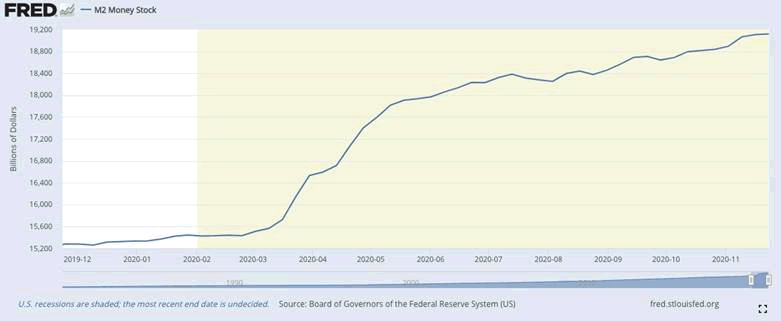
M2 money supply, December 2019-present. Source: Board ofGovernors of the Federal Reserve System
However, otheroverlooked scenarios for inflation to rear its ugly head are:
Supply constraints in the economy. When an industry, orindustries, fail to deliver enough goods for their market, the result is priceinflation.An over-reliance on imported goods can also cause priceinflation.The prices of goods can increase if labor disruptions occur.When countries fail to coordinate their internal/ externalemergency policies, and instead, act unilaterally.We areseeing all of this in our current coronavirus predicament. Currency debasementis also a very real phenomenon. From a mid-March high of 102.82, the US dollarindex, or DXY, has fallen 13%.
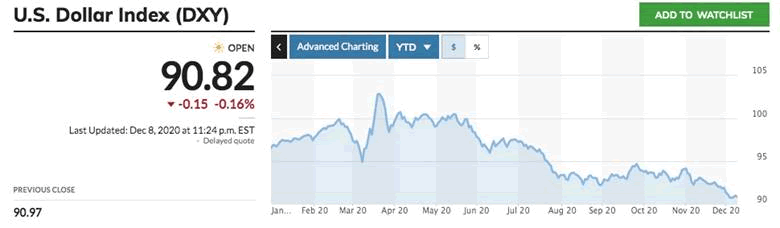
US Dollar Index, year to date. Source: MarketWatch
Thedovish response of the US Federal Reserve to the pandemic, in keeping interestrates near zero and blowing out its balance sheet beyond $7 trillion, not tomention the trillions in covid-19 rescue funds spent by the federal government,has a growing chorus of analysts suggesting that the greenback’s status asworld currency is in jeopardy.
Wecovered that topic in a previous article — suffice to say that the dollar is likely to be pressured, solong as the United States battles the coronavirus, with further depreciationlikely even if the economy starts to recover.
Accordingto a September article in International Banker,
[T]he US could lose all of those perks as a weak coronavirusresponse, long-term persistence in implementing quantitative easing (QE) andultra-low interest rates, and concerted drive to encourage higher inflation allconspire to threaten the dollar’s hegemonic influence around the world. GoldmanSachs, for instance, issued a stark warning that the dollar is in seriousdanger of losing its reserve-currency status. The US bank’s concerns areprimarily related to the massive monetary injections into the economy by theFederal Reserve, the balance sheet of which has now topped a staggering $7trillion thanks to the reintroduction of its quantitative-easing policy as wellas the fiscal stimulus provided by Congress.
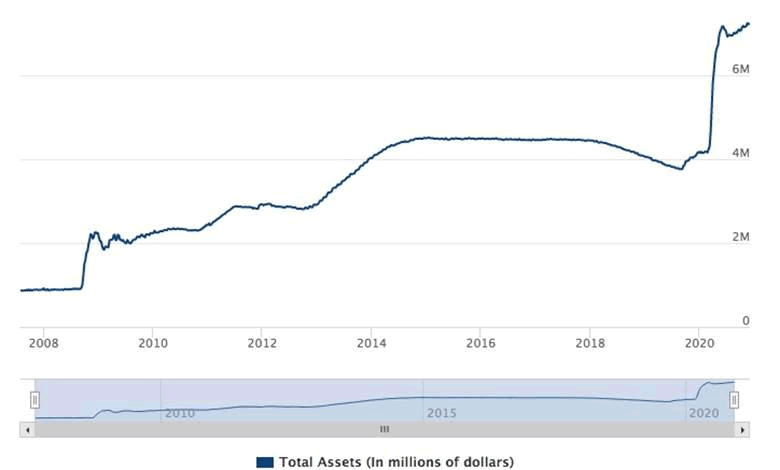
Source: Board of Governors of the Federal Reserve System
We cansay with confidence that gold has gained during most of the last severalrecessions, as the chart below shows, and that the yellow metal usuallyperforms best in contractions accompanied by uncertainty and a weak US dollar,high inflation or low interest rates. (which basically describes the currentenvironment, minus the high inflation)
Recessions and contractions are part of the regular business cycle,which on average, last about seven years.
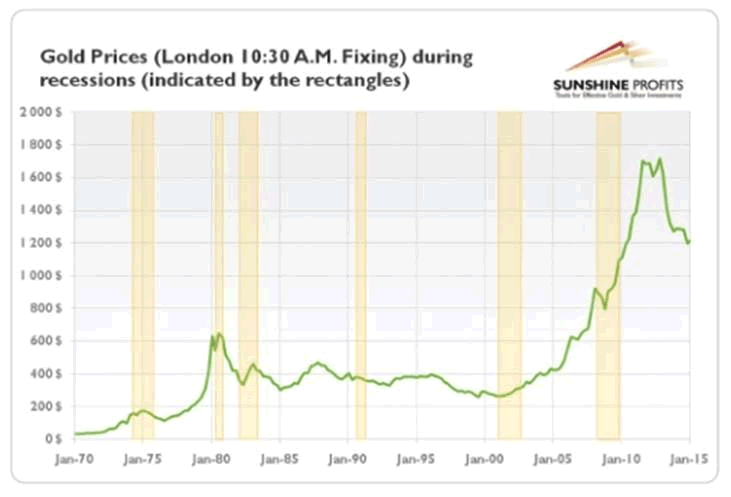
Historically, higher gold prices have tracked recessions.Source: Sunshine Profits
Anothermajor trend, identified by Sunshine Profits, is to envisage gold prices as two bull markets and two bearmarkets:
The first bull market occurred in the 1970sdue to the collapse of the Bretton Woods system and the inflationary oilcrisis. In the 1980s and the 1990s, the U.S. economy flourished, while thegreenback strengthened, so the yellow metal entered its first bear market. Inthe 2000s, the confidence in the American economy and its currency dropped, andgold reached [a record high of $1,900/oz] in 2011.
Gold then slipped into a bear market from2012 to 2016, the year it began rising again, due to a number of factors including a weakstock market, a slowdown in China and low oil prices. Few need reminding that,apart from a brief dip earlier this year, owing to virus-related market panic,gold prices have kept climbing, reaching an all-time high on Aug. 4 of$2,022.66/oz.
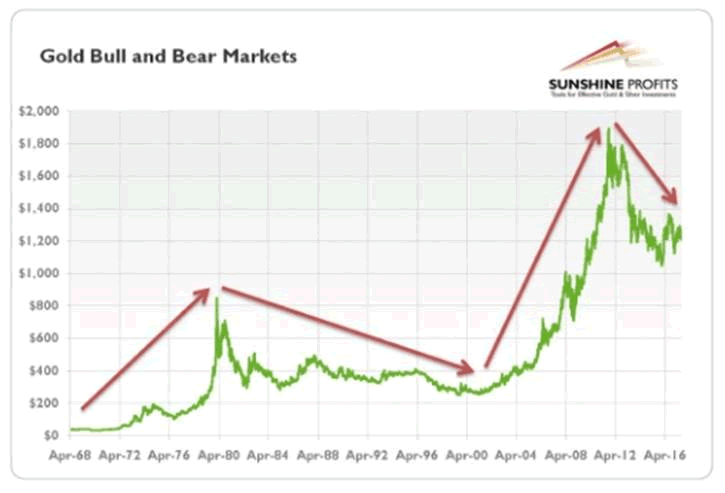
Gold slipped into a bear market from 2012 to 2016. Source: Sunshine Profits
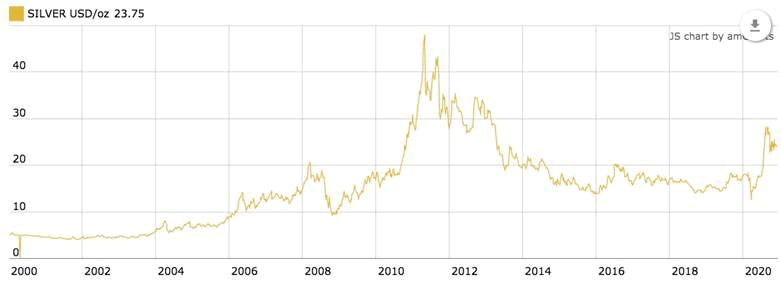
Silver, despite being as much an industrial as aninvestment metal, follows a similar pattern to gold, in that there are twosilver bulls and two silver bears.
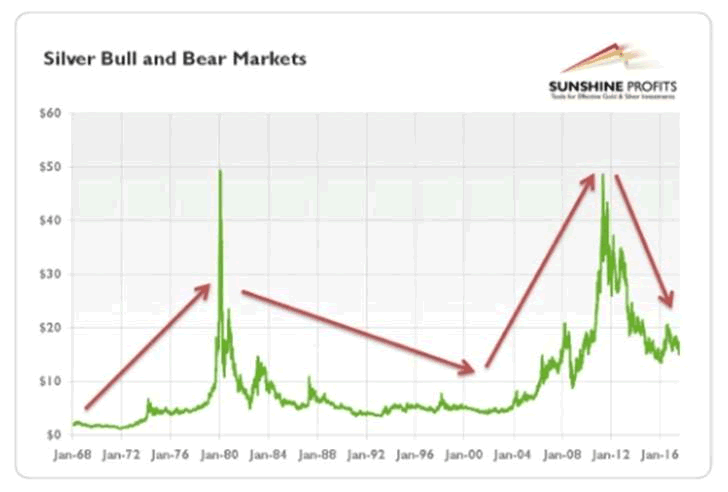
Silver approached $50/oz in April 2011, a level not seensince 1980. Source: Sunshine Profits
From this we can make an astute observation. Goldcorrelates less to swings in the economy than oil and industrial commodities,which makes sense. Demand for gold is almost purely investment-related, unlikesay, oil and copper, which are heavily influenced by economic growth. But whenthere is a correction in the gold price, either to the upside ordownside, it tends to be long-lasting.
For example, while gold crashed within two years, from$850/oz in 1980 to $300/oz in 1982, it took another 20 years for gold toclamber above $300/oz in 2002. For the next eight years gold was in a bullmarket, punching through $1,900 for the first time in 2011. The current goldbull market began in 2016 and has not stopped, nor is it expected to; we’ll getinto that in the last section.
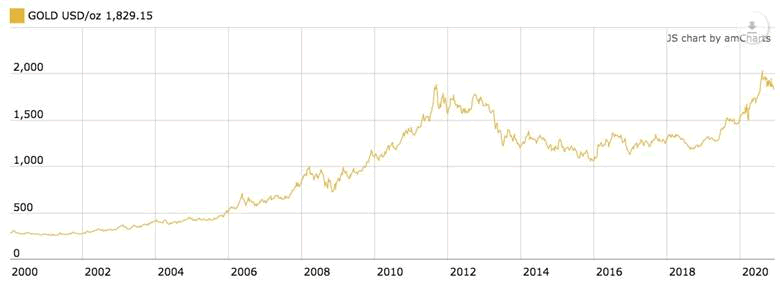
Gold bumped along around $400/oz for 20 years, beforerising sharply in 2003, the start of the last commodities supercycle. Source:Goldprice.org.
2000s commodities boom
Earlier in the article we suggested the global economy could be at thebeginning of a new commodities supercycle, possibly even besting the lastmining supercycle, the 2000s commodities boom, evidenced by surging prices of anumber of industrial metals, including iron ore, copper, lead and zinc, as wellas booming Chinese economic growth, post-pandemic.
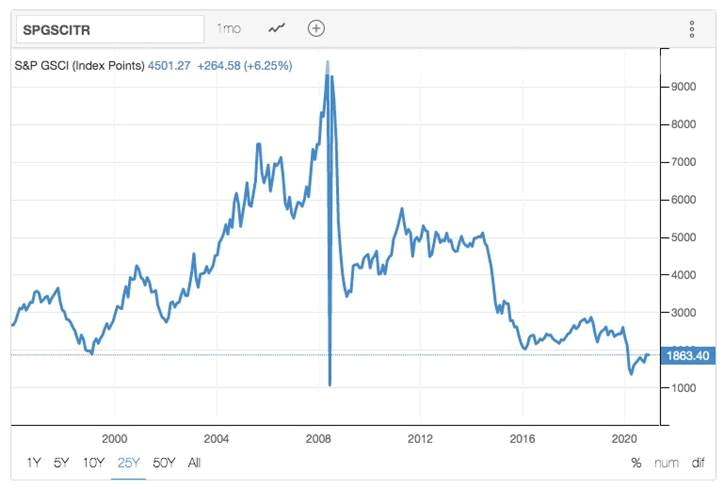
The supercycle is seen dramatically in the chart below of the S&PGSCI Commodity Index. Commodities in the index show a rapier-like spike fromDecember 2006 to January 2008, then take a 21-year tumble the same year, theplunge in demand due to the Great Recession. Over the next two years, however,from March 2009 to March 2011, GSCI surged 73%.
Source: Trading Economics
The 2000s were marked by the rise of many commodity prices includingfood, oil, metals, chemicals and fuels. Economic historians see this time as areaction to the “Great Commodities Depression” of the 1980s and 1980s.Comparable to the commodities supercycles that accompanied the post-World WarTwo economic expansion and the Second Industrial Revolution in the second halfof the 19th century and early 20th century, the boom waslargely the result of rising demand from emerging markets particularly China, from1992 to 2013, as well as concerns over long-term supply.
A number of commodity price bubbles formed during this period. Forexample a rising global population and a sharp decline in food crop production,were two factors behind a marked increase in the prices of basic food stocks.Strong demand in India and Egypt helped ramp up demand for American wheat in2007, and in 2008, wheat prices reached record highs after Kazakhstan limitedsupplies sold overseas and Russia banned exports due to a drought thatdestroyed its wheat and barley harvests. Food riots hit Egypt, after nationalbread prices rose rapidly in March and April of 2008.
Rice prices gained to US$0.24 a pound, more than doubling in just sevenmonths.
The most important commodity in the running of the global economy, crudeoil, famously climbed from $30 a barrel in 2003, to a July 2008 peak of$147.30, (gas prices across the US surpassed $4 a gallon) before the financialcrisis severely crimped energy demand, resulting in a dramatic tumble in oilprices, to a December 2008 low of $32.
How did gold and silverfare during this last commodities supercycle? Quite well as it turns out.Between 1999-2001, gold prices were near the end of a 20-year bear market thatbegan to correct in 2002 when prices climbed above $300/oz. This period hasbecome known as the “Brown Bottom”, during which time the UK governmentTreasury, on the orders of then-Chancellor of the Exchequer Gordon Brown,foolishly sold all of the British government’s gold reserves — which thenaccounted for around half of the UK’s $13 billion foreign currency netreserves.
Gold prices climbedsteadily since 2003, on the back of increased demand for bullion and a weak USdollar, reaching a 20-year high of $865.35/oz in January, 2008. Gold ralliedfurther in 2010, after the EU debt crisis prompted many investors to rotatefunds into gold as a safe-haven asset, hitting a then-record in December 2010of $1,429/oz, before continuing on to its 2000s supercycle peak of $1,900/oz inAugust, 2011.
Silver prices followeda similar trajectory. In 1992 silver cost $4 per ounce, but in 2004,corresponding to gold’s move up, the white metal caught a bid, and by late2007, had more than quadrupled to $18/oz. During the financial crisis silverprices were cut in half, however they started back up again in early 2009. ByFebruary 2011, silver was averaging $30 an ounce. Two months later, it neared arecord $50/oz, but like gold, the high was temporary. In June 2011 silverprices were again cut in half, before falling to a seven-year low of $13.91 inDecember 2015. Gold’s fall from grace came a bit later. After a dramaticsell-off in April, 2013, suffering its worst-ever one day loss of$125/oz, the yellow metal stagnated for a couple of years, reaching a bottom of$1.066.10 in December 2015.

Source: Kitco
Source: Kitco
Supercycle theories
What accounts forcommodity supercycles? There are a number of theories. Two of the most famousare the Kondratieff Wave, named after Russian economist NikolaiKondratieff, and the work of Joseph Schumpeter, writing in the 1930s.
As the most famoussupercycler, Schumpeter claimed to have found three commodity cycles, each withan upswing of 30-40 years, peak to trough. The first cycle, goes the theory,matched the Industrial Revolution in the United Kingdom that ran from 1786 to1842. The advent of “coal, iron, railways, steamships, textiles and clothing”ushered in the second cycle, during which prices peaked around 1873 thenstarted to fall, according to a UN study on supercycles quoted by iPolitics.Schumpeter's third cycle was linked to new technologies coming from “steelelectricity, organic chemicals, the internal combustion engine, automobiles,”says the UN study.
Nikolai Kondratieff noticedthat agricultural commodity and copper prices experienced long-term cycles. AKondratieff Wave is a long-term economic cycle believed to be born out oftechnological innovation, which results in a long period of prosperity.Economists have identified five Kondratieff Wave cycles since the 18thcentury: the invention of the steam engine (1780-1830); the steel industry andthe spread of railroads (1830-1880); electrification and innovations in thechemicals industry (1880-1930); automobiles and petrochemicals (1930-70); andinformation technology which started in the 1970s and runs to present.
Each of these cycles hasfour sub-cycles, named after seasons: spring when the cycle is experiencing aneconomic boom, including an increase in productivity and inflation; summer whenan increase in affluence leads to changing attitudes towards work that slowseconomic growth; autumn stagnation, giving rise to deflation and lower economicgrowth; and finally winter, when the economy falls into a deep depression thatwidens the gap between the haves and the have-nots.
According to Investopedia,Kondratieff Waves are part of a branch of economics called heterodox economics,that are not widely accepted by economists. In fact the theory got Kondratieffinto deep trouble in his home country. As Investopedia tells it, His viewswere anathema to communist officials, especially Josef Stalin, because theysuggested that capitalist nations were not on an inevitable path to destructionbut, rather, that they experienced ups and downs. As a result, he ended up in aconcentration camp in Siberia and was shot by a firing squad in 1938.
Research by RBC Wealth Management revealsthat over the past 100 years, there have been four great commodity booms —World War I, World War II, the industrialization of Japan and the OPEC embargo,and the industrialization of China. Each followed a long period of demand stagnation,and a lack of investment in new supply. RBC also point to a series of stagesthat unfold as new demand sources emerge. In the first stage, new demand, suchas China’s historic growth starting in the late 1990s, begins to put pressureon global supplies. But mining companies are slow to respond, because there wasa lack of investment in new mines/ exploration during the previous down cycle.Therefore in stage 2, new projects are greenlighted and access to capitalimproves.
Stage 3 begins whendemand starts being driven not only by the main event, like Japan’sindustrialization, but investment. Supplies begin to catch up, but because ittakes seven to ten years to develop a new mine, the catch-up is gradual. Thepeak of the cycle generally happens in this stage, when commodity pricesbenefit from high demand and lagging supply.
In stage 4, demandbegins to wane, as supply, initiated years prior, begins ramping up. Thecombination weighs on companies’ balance sheets, and prices begin to fall. Thelast stage, stage 5, is characterized by supply far exceeding demand, withprices for most commodities dropping below the cost of production. As RBC putsit, Capital flow ceases and companies shift intosurvival mode. Supply continues to grow for a time as projects started yearsbefore continue to reach completion. Investment in new projects all but ceasesand higher cost projects are shut down. The industry essentially goes intohibernation until the next demand driver emerges.
VisualCapitalist relies on a similar set of circumstances in crafting itsinfographic, ‘Visualizing the Commodity Super Cycle’. The text accompanying the infographic defines a commoditysupercycle as a recognizable pattern across major commodity groups. Economistsbelieve the upswing phase results from a lag between trends that supportcommodity demand, and slow-moving supply, such as building a new mine orplanting a new crop. The cycle enters a down phase when demand growth slows andadequate supply comes available.
VisualCapitalist’s research used data from the Bank of Canada to reproduce a chartindicating four commodity price supercycles since the turn of the 20thcentury: 1899-1932, coinciding with the industrialization of the United States;1933-61, a period beginning with the onset of global rearmament before theSecond World War, in the 1930s; 1962-95, corresponding to the reindustrializationof Europe and Japan in the late 1950s and early ‘60s; and the fourth cycle,which began in the mid-1990s with the rapid industrialization of China and runstill present.
Finally,two economists who set out to describe supercycles in a 2012 paper, found four cycles between 1884 and 2010, during which allcommodities except oil moved together. According to Bloomberg, via Livemint, The first one peaked in 1917 and endedin 1932, at the bottom of the Great Depression. The second one ran until the1971 oil shock, peaking in 1951. The third one peaked soon after it started, in1973, and ran until 1999. The current cycle, according to Erten and Ocampo,peaked in 2010 — though if they had data from the next several years, theymight have placed the peak in 2011 or 2012.
The article notesthat one potential driver of these supercycles is the interaction of large,unexpected demand shocks, and slow-moving supply responses, ie. similar to thereasons found in the Visual Capitalist infographic. The piece is interesting inthat it was written in 2015, after the 2000s commodities supercycle had ended.The author questioned what could be driving the (then-current) downtrend? Hisanswer? a slowdown in China:
All the demand prompted the construction ofnew production facilities and exploration of new deposits, creating theconditions for a glut. Now, with Chinese development slowing, the metals pricecycle may have peaked.
2021 commodities bull?
And now for thesection you’ve all been waiting for: what comes next?
As mentioned at the top,Goldman Sachs is forecasting a bull market for commodities in 2021, based on aweaker dollar, inflation and the prospect of additional monetary (US Fed) andfiscal (US government) stimulus. In October, CNBCquoted analysts at the bank predicting a 30%return over the next year for S&P GSCI. They recommend going long in gold, silver,copper, US gas, Brent crude and jet regrade.
The bank reportedlysees upside in non-energy commodities including agriculture and metals, citingtighter supply for the former due to adverse weather conditions, and greaterdemand from China for the latter — something we are already seeing, as theabove-cited stats on Chinese PMIs and trade figures indicate.
“Given that inventoriesare drawing this early in the cycle, we see a structural bull market forcommodities emerging in 2021,” the Goldman analysts said in a research note.
A key driver forcommodities prices going forward is the risk of inflation. According toGoldman, markets are increasingly worried about inflation due to record-highlevels of fiscal spending and low interest rates for the foreseeable future.President-elect Biden has promised nearly $5.4trillion in new spending over the next decade, according to the University of Pennsylvania’s Penn Wharton Budget Model,including $1.9 trillion on education and $1.6 trillion on new infrastructure —roads, bridges, highways and other public structures. That doesn’t include a $2trillion spend over four years to counter climate change.
“Accordingly, we expect an increased rotation into commodities as aninflation hedge,” the analysts wrote.
Gold naturally willbenefit from this shift, given that inflation hedgers have traditionally pickedgold as the best vehicle. Goldman Sachs predicts the metal to average $2,300per ounce in 2021, a considerable lift from the $1,836 per ounce averageforecasted for this year.
Conclusion
Looking longer term,it’s interesting to read comments stating that the next supercycle may be quitedifferent from the last one. Visual Capitalist asks: Is this the beginning of anew supercycle? The answer could prove to be prophetic:
[P]astgrowth was asymmetric around the world with different countries taking thelion’s share of commodities at different times.
Withmore and more parts of the world experiencing growth simultaneously, demand forcommodities is not isolated to a few nations.
Confinedto Earth, we could possibly be entering an era where commodities couldperpetually be scarce and valuable, breaking the cycles and giving power tonations with the greatest access to resources.
Indeed we live in aworld of finite resources. Without a way to replaceall the resources we consume — harvested food, fertilizers, energy, metals,etc. — we are gradually depleting nature’s bounty, at a rate that is unsustainable, long-term. If we keep going,and economies keep growing, we’re eventually going to run out. The problem ismade worse by the global population increasing, along with the continuing wantsof people in the developed world (“the West”) and in less-developed countries(who are demanding houses, cars, fridges, cell phones, etc.), putting morepressure on our finite resources.
As competitionfor scarce resources becomes more intense, access to a secure and sustainable supply of raw materials will become the number one priority for all countries. Increasinglywe are going to see countries ensuring their own industries have first rightsto internally produced commodities and they will look for such privilegedaccess from other countries, in return.
The last commoditiessupercycle which ended around 2010 was very focused on China. For close to adecade, Chinese growth subsided, as the country focused on shifting from anexport-driven economy, “the workshop of the world”, to one in which internalconsumption is more important than trade. Now, China appears stronger thanever, being the first major economy to emerge from the coronavirus, with anambitious Five Year Plan to build the nation into a technological powerhouse;its Belt and Road Initiative which according to Morgan Stanley could reachinvestments of up to $1.3 trillion by 2027; “Made in China2025,” a state-led industrial policy that seeks to make China dominant inglobal high-tech manufacturing; and the ongoing push to build up China’s Military.
But China isn’t the only country with bigplans for the “new economy” — one that pivots around clean energy, asgovernments around the world scramble to re-tool their factories and cities tomeet the challenge of decreased emissions necessary to fight the effects ofclimate change — and high technology including artificial intelligence,computer chips, 5G, etc.
TheEuropean Commission has released a €1.85 trillion recovery plan focusing on “EU Green Deal” initiatives aimed at reaching theeurozone’s net emissions by a 2050 target. The election of Joe Biden is extremely bullish for certain metals, including copper, zinc, nickel sulfides, silver and gold.
Webelieve global infrastructure plans will move forward, including President-elect Biden’s multi-trilliondollar electrification and 5G plans. Demand for copper will certainly increase. Along with nickel,zinc, silver, graphite, cobalt, etc., all the metals needed for “old schoolblack top” and “green electrification” infrastructure metals.
None ifit can be done without mining and metals. The age of electrification will soonreplace the oil age, setting up the next commodities supercycle.
By Richard (Rick) Mills
If you're interested in learning more about the junior resource and bio-med sectors please come and visit us at www.aheadoftheherd.com Site membership is free. No credit card or personal information is asked for.
Richard is host of Aheadoftheherd.com and invests in the junior resource sector. His articles have been published on over 400 websites, including: Wall Street Journal, Market Oracle,USAToday, National Post, Stockhouse, Lewrockwell, Pinnacledigest, Uranium Miner, Beforeitsnews, SeekingAlpha, MontrealGazette, Casey Research, 24hgold, Vancouver Sun, CBSnews, SilverBearCafe, Infomine, Huffington Post, Mineweb, 321Gold, Kitco, Gold-Eagle, The Gold/Energy Reports, Calgary Herald, Resource Investor, Mining.com, Forbes, FNArena, Uraniumseek, Financial Sense, Goldseek, Dallasnews, Vantagewire, Resourceclips and the Association of Mining Analysts.
Copyright © 2020 Richard (Rick) Mills - All Rights Reserved
Legal Notice / Disclaimer: This document is not and should not be construed as an offer to sell or the solicitation of an offer to purchase or subscribe for any investment. Richard Mills has based this document on information obtained from sources he believes to be reliable but which has not been independently verified; Richard Mills makes no guarantee, representation or warranty and accepts no responsibility or liability as to its accuracy or completeness. Expressions of opinion are those of Richard Mills only and are subject to change without notice. Richard Mills assumes no warranty, liability or guarantee for the current relevance, correctness or completeness of any information provided within this Report and will not be held liable for the consequence of reliance upon any opinion or statement contained herein or any omission. Furthermore, I, Richard Mills, assume no liability for any direct or indirect loss or damage or, in particular, for lost profit, which you may incur as a result of the use and existence of the information provided within this Report.
© 2005-2019 http://www.MarketOracle.co.uk - The Market Oracle is a FREE Daily Financial Markets Analysis & Forecasting online publication.