Gold & Silver Begin The Move To New All-Time Highs / Commodities / Gold & Silver 2020

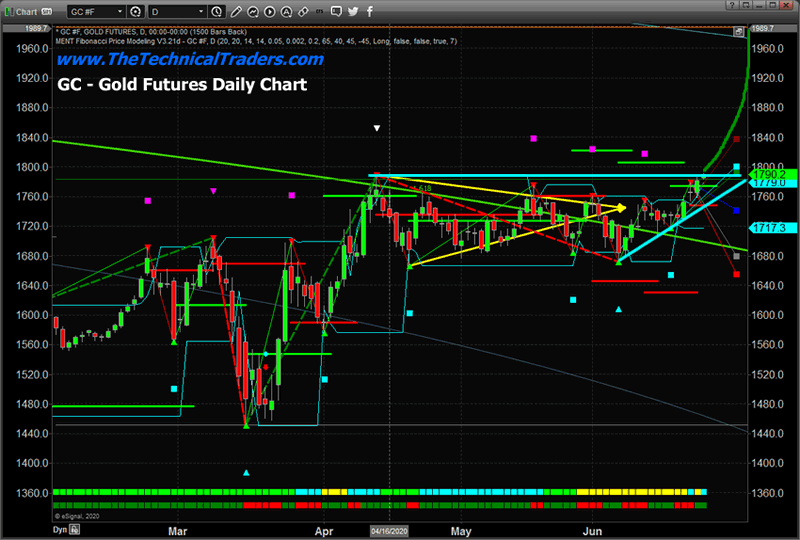
We warned about this move many months ago and just 6 days agowe issued a research post suggesting Gold had cleared major resistance andwould start a rally mode to push above $2000 – possibly above $2100. Well, guess what happened right after we madethat statement? Yup – Gold started to rally higher and is currently tradingnear $1790 – about to break $1800 for the first time in 2020.
You can read some of our most recent Gold articles below:
June 3, 2020: Gold & Silver “Washout” – Get Ready For A Big Move Higher
June 18, 2020: Gold Has Finally Cleared Major Resistance – Time For Liftoff
June 20, 2020: All That Glitters When The World Jitters Is Probably Gold
HOW WILL GOLD REACTIN THIS PARABOLIC RALLY?
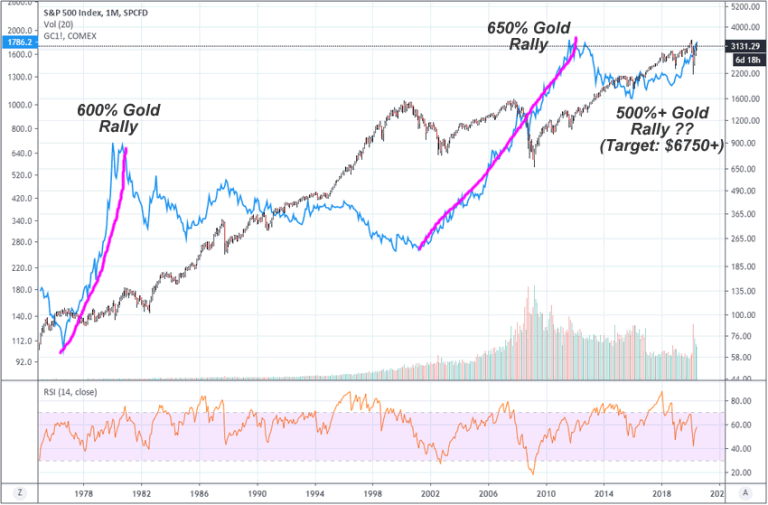
What we really want you to focus on is the fact that Gold is rallying to levels above $1800 (near all-time highs) while the US stock market has entered an upside parabolic price trend. What does it mean when metals are rallying and the stock market is rallying at the same time? The supply-side of precious metals has been restricted because of the COVID-19 virus event and central banks have been accumulating Gold and Silver over the past 7+ years by large amounts. This suggests central banks and precious metals traders believe metals prices will continue to skyrocket while the risks to the equities markets, credit markets, and global economy increases.
Gold prices climbed in the early 2000s after the DOT COMbubble burst (starting to rise in 2002). The US stock market eventually bottomed near April 2003 – yet Goldcontinued to rally from near the $281 level to $992 in early 2008 – a massive+665% over just 5 years.
Gold continued to rally after some wild rotation near the 2008 peak in the US stock market. Gold bottomed in November 2008 near $710 before rallying to $1924 in September 2011. This rally took place while the US stock market was also rallying because of the fear in the market from the 2008 (and 1999 DOT COM), market collapse events had not subsided. Traders and Investors were still very fearful of the truth of the economic recovery and stock market recovery at that time – so they continued to hedge in precious metals.
Before you continue, be sure to opt-in to our free-market trend before closing this page, so you don’t miss our next special report!
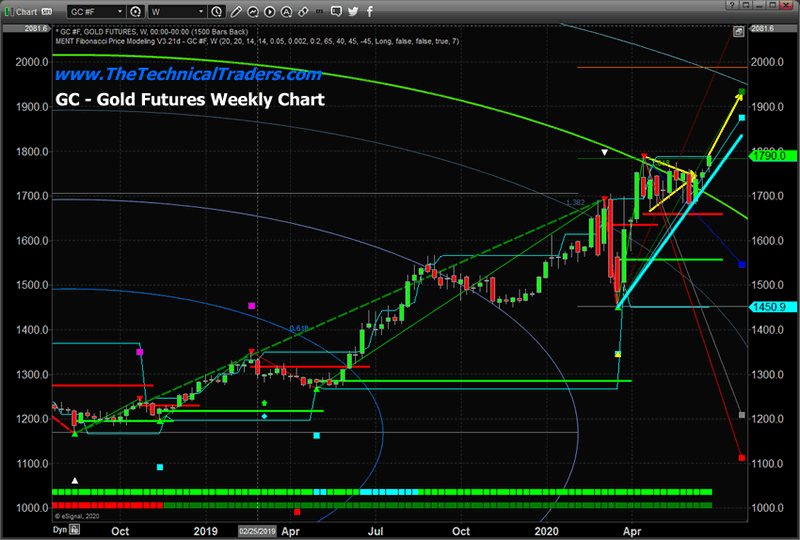
Right now, the US stock market has entered a massive parabolic upside price move while Gold is starting a breakout upside price move targeting the 2011 all-time high near $1924. What this is telling us is that global investors and traders are very fearful of this rally in the stock market and are actively hedging in Gold and Silver. Traders understand the risks to the credit and banking system and are playing the rally in the stock market cautiously while “loading up” on Gold as a means to protect against unknown risks.
Read the first part of our “Markets Go Parabolic” articlebelow:
June 23, 2020: US Stock Market Enters Parabolic Price Move – Be Prepared, Part I
HOW BIG COULD THERALLY IN GOLD REALLY BE?
We believe the upside price move in Gold, coinciding with a potential parabolic upside price move in the US stock market, could represent a very unique scenario where the US Federal Reserve and Global Central Banks have entered the ultimate battle to attempt to regain control of the global capital and credit markets after the 2008 credit crisis and the current COVID-19 economic crisis. The only reason Gold is climbing to near new all-time high levels is that global risk has become a major issue and the US Fed as well as central banks are doing everything possible to provide capital liquidity and support through what may become an extended global recession.
Right now, Gold is hedging global market risks and unknowns. Once Gold clears the $2000 price level, we believe Gold will enter a parabolic upside price trend that could accelerate well above $3250 very quickly – possibly before the end of 2020. This would indicate that global traders and investors have priced global market risk at likely 3x higher than most common risk-off market scenarios. The only other time when this extreme risk factoring took place in Gold was in early 1980 when interest rates were 15% or higher and the US economy had entered a period of stagflation (the late 1970s). At that time, the price of Gold reached nearly 7x the price of the SPX at that time before contracting after a peak in 1981.
If our research is correct, Gold has just begun an upsideprice rally that will attempt to hedge credit and global market risks resultingfrom the past 10+ years of US Federal Reserve and global central bankintervention. The attempts of the globalcentral banks to support the credit and capital markets have created a massivecredit/debt bubble that has pushed the US stock market into an incrediblebubble rally. We’ve seen nothing likethis in recent history.
Until fiscal responsibility returns to the global markets,expect Gold and Silver to continue to hedge global risks and while the worldcontinues to expand debt and credit in an attempt to support weaker economicdata/output – continue to expect hedging to continue. Until global investors perceive thedebt/credit risks have abated – Gold and Silver will continue to rally in anattempt to hedge the massive risks to the global credit and banking sectors.
At this point – it is like a game of “chicken”. Either the global central banks find some wayto prompt organic economic growth or the precious metals markets will continueto illustrate the fear in the markets related to credit risks. Should the credit markets or banking sectorcollapse or experience any real extended risks, Gold could rally tounbelievable levels (like in 1979~80; where the price of Gold was over $650 perounce and the price of the SPX was $110). If that were to happen at today’s levels, Gold would reach levels above$22,250 or higher. Think about it.
We continue to urge our clients to stay very cautious of thecurrent price rally in the US stock market as we continue to see risksshuffling just below the surface. WatchGold and Silver. Once these metals startto really breakout, you are going to see a big shift in how investors perceiverisk in the global markets. Read ourarticle about the US stock market going parabolic – it is important that youunderstand what is happening right now.
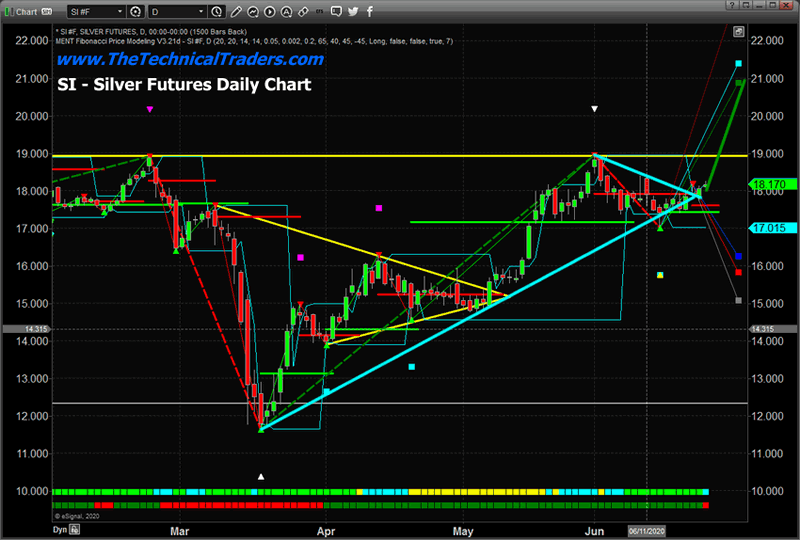
WHAT WOULD THATLOOK LIKE FOR SILVER?
Silver is likely one of the most incredible opportunities forskilled technical traders ever. Thissecondary precious metal is still trading below $19 per ounce – well below the$50 per ounce peak reached in 2011. Ifyou understand our logic and can appreciate how Gold could rally to levelsabove $5000 or $10,000 because of extreme risk factoring, then consider thatSilver could rally to levels above $250 per ounce given the same risk factors –that’s a 1300% price increase.
This is why we continue to urge our clients and followers tostay cautious – stay very cautious. We’ve been mostly in cash and have been executing very selective “lowallocation” trades over the past 5+ months. We called for a massive super-cycle event in August 2019 based on our600+ year super-cycle modeling. Whenthat longer-term super-cycle was delayed because of the US/China trade dealnews near the end of 2019, we knew the super-cycle event would happen at somepoint in the near future. Along comesthe COVID-19 event about 60 days later. It just took another 2 months for the world to understand how much riskwas involved in a global pandemic event. The process of the world reacting to the COVID-19 risks set off a seriesof events that leads us to right now.
Pay attention. There will be no Mulligans in this round of play. You’ll either be prepared for what is likely to happen or you’ll take far greater risks than you should throughout the next 5+ years. We’re here to help. Read our research and learn how we can help you protect and grow your wealth.
Get our Active ETF Swing Trade Signals or if you have any type of retirement account and are looking for signals when to own equities, bonds, or cash, be sure to become a member of my Passive Long-Term ETF Investing Signals which we are about to issue a new signal for subscribers.
Chris Vermeulen
www.TheTechnicalTraders.com
Chris Vermeulen has been involvedin the markets since 1997 and is the founder of Technical Traders Ltd. He is an internationally recognized technical analyst, trader,and is the author of the book: 7 Steps to Win With Logic
Through years ofresearch, trading and helping individual traders around the world. He learnedthat many traders have great trading ideas, but they lack one thing, theystruggle to execute trades in a systematic way for consistent results. Chrishelps educate traders with a three-hourvideo course that can change your trading results for the better.
His mission is to help hisclients boost their trading performance while reducing market exposure andportfolio volatility.
He is a regularspeaker on HoweStreet.com, and the FinancialSurvivorNetwork radio shows. Chriswas also featured on the cover of AmalgaTrader Magazine, and contributesarticles to several leading financial hubs like MarketOracle.co.uk
Disclaimer: Nothing in this report should be construed as a solicitation to buy or sell any securities mentioned. Technical Traders Ltd., its owners and the author of this report are not registered broker-dealers or financial advisors. Before investing in any securities, you should consult with your financial advisor and a registered broker-dealer. Never make an investment based solely on what you read in an online or printed report, including this report, especially if the investment involves a small, thinly-traded company that isn’t well known. Technical Traders Ltd. and the author of this report has been paid by Cardiff Energy Corp. In addition, the author owns shares of Cardiff Energy Corp. and would also benefit from volume and price appreciation of its stock. The information provided here within should not be construed as a financial analysis but rather as an advertisement. The author’s views and opinions regarding the companies featured in reports are his own views and are based on information that he has researched independently and has received, which the author assumes to be reliable. Technical Traders Ltd. and the author of this report do not guarantee the accuracy, completeness, or usefulness of any content of this report, nor its fitness for any particular purpose. Lastly, the author does not guarantee that any of the companies mentioned in the reports will perform as expected, and any comparisons made to other companies may not be valid or come into effect.
Chris Vermeulen Archive |
© 2005-2019 http://www.MarketOracle.co.uk - The Market Oracle is a FREE Daily Financial Markets Analysis & Forecasting online publication.