Gold & Silver Corrective Rally is Almost Over / Commodities / Gold and Silver 2018

 Strongwords, aren’t they? And yet, we are not afraid to put them right in the title.The number of factors (and their importance) that point to a nearby reversaland continuation of the major decline is too significant to believe in thebullish case, even though gold, silver, and mining stocks moved higher in thelast few days.
Weemphasized it many times and we will continue to do so, as it’s very easy toforget about it when things get volatile on a day-to-day basis. The long-termsignals are far more important than the short-term ones. In a fight, it’s notalways the bigger guy (or gal) that has the advantage, but in certain circumstances it’sobvious that weight matters (please keep this picture in mind while readingabout the possible counter-trend upswing in the short run – that’s the littleguy while the big guy are the powerful long-term factors). That’s exactly thecase with the weight and importance of long-term signals when comparing them tothe short-term ones. Surely, we could get a 1-2% upswing, but so what, if a 15%decline is just around the corner? And in particular, if it could take placeright away?
Themost recent rally in gold and the rest of the PMs was most likely triggered bymarket’s (most likely incorrect, but understandable) reaction to the increasedBrexit tensions. Quoting finance.yahoo.com:
BREXIT: On Thursday, discord overBritish Prime Minister Theresa May's plan for Britain's departure from theEuropean Union next year shook major European stock indexes and the pound. Shepersuaded a majority in her Cabinet to back an agreement that would allowBritain to stay in a customs union while a trade treaty is negotiated, but thedeal faces an uncertain fate in Parliament and two of her Cabinet ministers,including the Brexit minister, resigned in protest.
Goldsoared on the Brexit vote, and now when it’s becoming less certain that theBrexit would have a major impact on the UK and if it takes place at all… Goldand the rest of the PMs rallies again? Pointless, right? Indeed, but on a veryshort-term note, markets viewed this as the increase in global uncertainty andthe PMs reacted to it. It is not logical, but emotional and that’s exactly whatone can expect from the market in the short run.
It’simportant to keep in mind that geopolitical events tend to haveonly a temporary impact on the gold prices. This will most likely be thecase also this time. Investors will realize that nothing really changed, andwhat changed was actually bearish for gold as the “status quo” option in whichthe UK stays in the EU became a bit more probable.
Havingsaid that let’s take a look at the charts to check how much changed from thetechnical point of view.
The USDIndex Changes
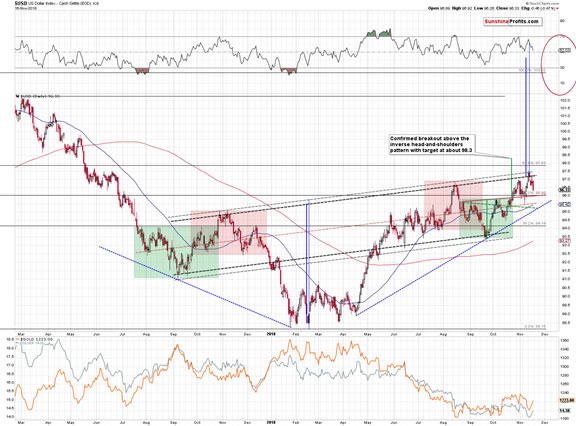
Werecently saw an invalidation of the tiny breakout above the medium-term inversehead-and-shoulders pattern, which could trigger some short-term weakness. But,such weakness is not likely to be very significant.
TheUSD Index is following the reflective pattern, in which the 2018 rally is areflection of the 2017-2018 decline. The current situation seems to be similarto what happened in early August 2017. Back then we saw a zigzag, so perhapswe’ll see some king of zigzag here as well. Back then the zigzag had higherhighs and higher lows, which suggests that it now should have lower highs andlower lows. Then again, the symmetry is not direct as the medium-term highs areand lows are now higher (August 2018 high is higher than the November 2017high), which could distort the direct zigzag analogy.
All in all, it seems that the USDIndex could decline to the November low at most and quite likely not lower thanto the 96 level. That’s where we have the neckline of the local inverse head-and-shoulderspattern and the 50% Fibonacci retracement level based on the previousmedium-term decline. The downside seems quite limited. This means that theupside for the precious metals sector is likely limited as well.
Gold’sImportant Signals
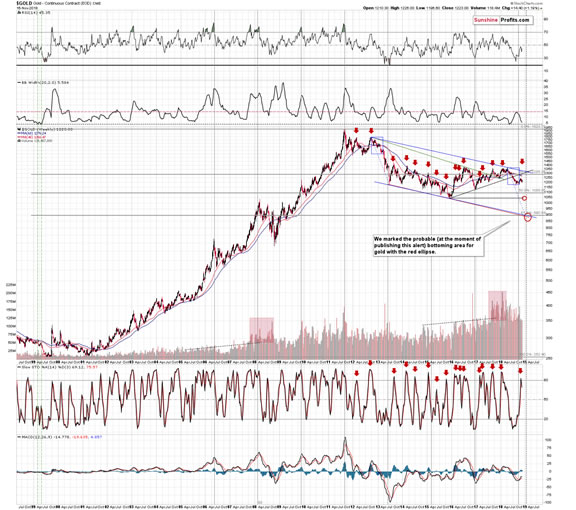
Fromthe long-term point of, we see that the sell signal from the weekly Stochasticindicator remain in place even though gold moved almost $15 higher last week.
Wealso see that gold’s very long-term cyclical turning point (marked withvertical lines) worked once again as it triggered a short-term rally in theyellow metal. This rally may already be over as the recent move is similar insize to the follow-up of the turning point from the first half of 2015. Therewere also cases when gold moved much higher after the turning point, but the thing thatwe would like to emphasize is that a move higher doesn’t have to happen basedon this factor. The recent upswing is already in tune with what we sawpreviously, so what was likely to happen based on this factor, seems to havealready happened.
However,the key thing to keep in mind is gold’s similarity to what happened in 2013. Ifit’s not apparent at the first sight, please note the rectangle that covers the2012 top and the 2013 decline. This rectangle was copied into the currentsituation (it’s exactly the same rectangle in terms of both: price and time).The size of the decline, it’s shape and time when the final corrective upswingtook place are remarkably similar. The corrective upswing took gold higher by asimilar amount (percentage-wise) and it seems that we are only days (not weeks)away from the start of the goldencarnage.
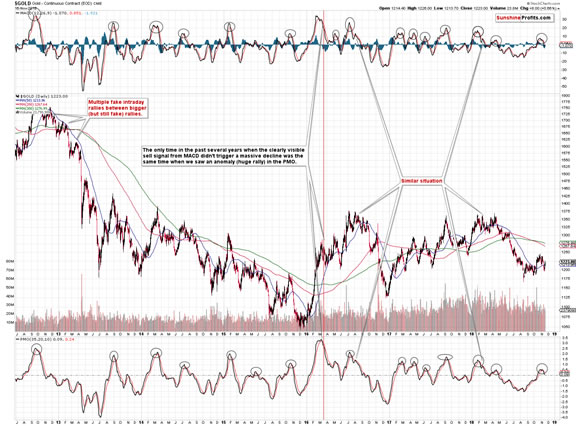
Both: MACD and PMO indicators for gold clearly confirm its bearishoutlook. Even though gold moved higher in the last few days, these indicatorscontinue to point to much lower prices in the upcoming days and weeks.
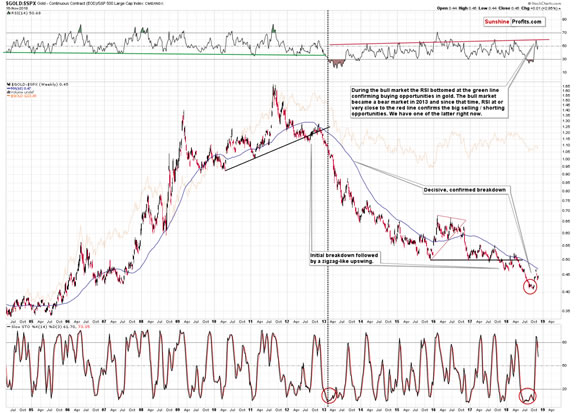
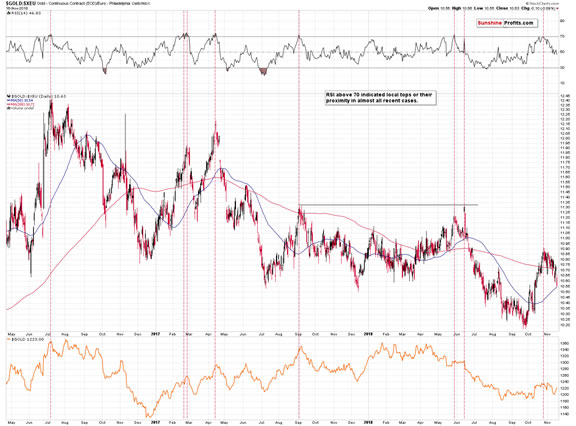
Weget the same confirmation from the gold to S&P 500 ratio chart. Theratio moved back to its 60-week moving average, which served as strongresistance several times in the past. The RSI indicator based on the ratiomoved to its own resistance as well. Both: ratio and the RSI declined, and itseems that local tops are already in. The Stochastic indicator flashed a clearsell signal confirming the above, which further confirms the bearish outlookfor the yellow metal.
Speakingof gold’s recent price increase, let’s not forget that it was not visible interms of all currencies. For instance, looking at gold in terms of the euro we see a decisivemove lower that followed a clearly confirmed (by the RSI) top.
Thebearish indications don’t end with gold.
Silver’sUpcoming Reversal
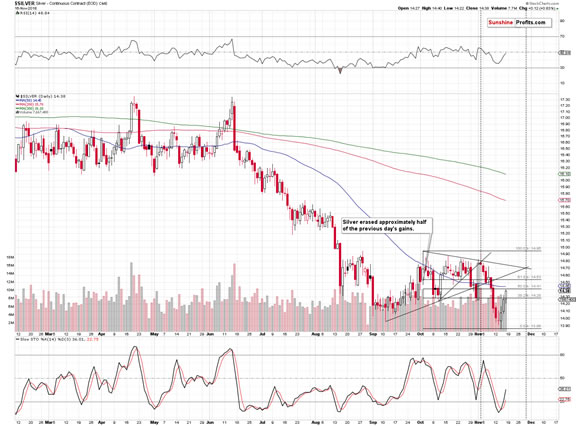
Let’sstart the silver section with white metal’s long-term chart.
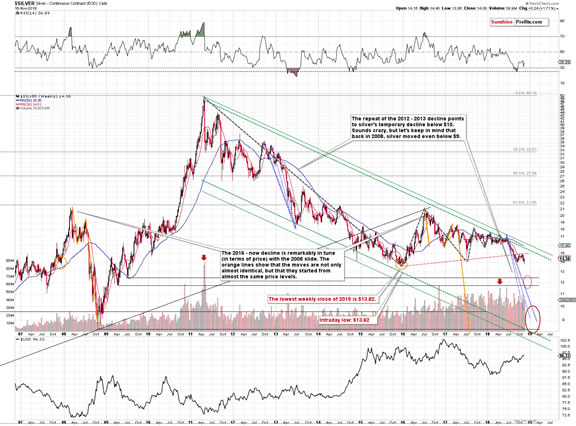
Thewhite metal just reversed after invalidating the breakdown below the previous2018 bottom, but that’s not the most important thing that we see on this chart.The key thing has been present for months. Namely, silver is after a breakdownbelow the rising red support line and this breakdown has been more thanverified. It was verified by weeks of trading below it and through a temporarymoved back to it that didn’t manage to push silver above. That’s exactly howbreakdowns should be verified if they are to be followed by a major decline.
Now,if we had just seen an invalidation of the move below the 2015 bottom, it wouldbe an important bullish indication. However, silver didn’t move below the 2015recently. It only moved below the local 2018 bottom and it was this move thatwas invalidated. This is a visible, but not extremely strong bullish signal andthe fact that the breakdown below the rising medium-term red line was confirmedso clearly is more important.
Besides,perhaps it was actually a good thing (speaking from the perspective of someone,who benefits from declining silver prices) that silver moved somewhat higherrecently. Silver’s triangle-vertex-based reversal is today. If it wasn’t forthe relatively small (didn’t erase the preceding decline) upswing in silver’sprice, this reversal would have bearish implications.
Takingthe pace at which silver declined recently into account, it seems that it mighthave coincided with silver’s breakdown below the 2015 bottom and the reversalcould have triggered its invalidation. This, in turn, might have led to apowerful weekly or monthly corrective upswing. Since we saw a correctiveupswing earlier and the triangle-vertex-based reversal has bearishimplications, the outlook is actually more bearish than it would have been ifthe rally hadn’t taken place.
Moreover,the previous underperformance of silver and its decisive decline (gold and goldstocks didn’t break below its 2018 lows, but silver did) is something that isvery much in tune with what happened in 2013 right before the big plunge.
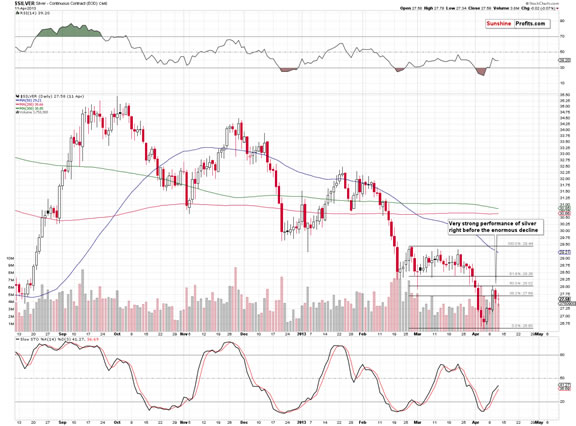
Backthen (early April 2013) gold also moved to new lows, but silver’s decline wasbigger anyway.
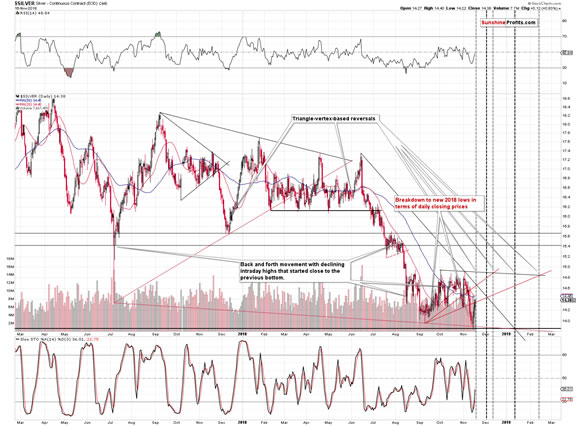
Butlet’s move a bit further into the past. In February 2013 silver declinedsignificantly, then formed a local bottom, corrected slightly, and declinedonce again forming a new intraday bottom, but there was no significant move interms of the closing prices. Then silver moved higher again, but overall we sawa quite boring back-and-forth trading that ended in the final part of March.Silver declined (underperforming gold) and bottomed in early April. It thencorrected 50% of the preceding downswing. This correction was the final chanceto prepare for the upcoming plunge.
Fastforward – it’s 2018.
Andwe can describe the situation on the above chart using the preceding paragraph,while only making tiny adjustments:
InAugust 2018 (plus the first session of September) silver declinedsignificantly, then formed a local bottom, corrected slightly, and declinedonce again forming a new intraday bottom (the first half of September), butthere was no significant move in terms of the closing prices. Then silver movedhigher again, but overall, we saw a quite boring back-and-forth trading thatended in November. Silver declined (underperforming gold) and bottomed in mid-November.It then corrected 50% of the preceding downswing (that was the previous tradingsession). Back in 2013, this pattern was the final chance to prepare for theupcoming plunge. The same is likely the case today. This is likely the finalcall.
Miners’Strong Rally and Its Implications
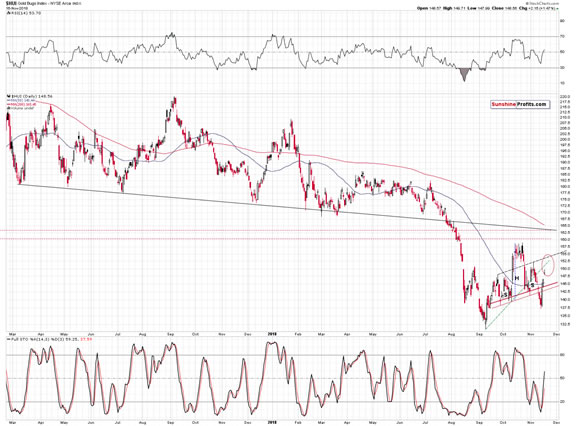
Thesituation in the mining stocks is not developing inperfect tune with their major downtrend, but within the borders of what onemight call reasonable for a downtrend. A local head-and-shoulders formation wasinvalidated, which was a bullish development for the short term (and only for theshort term) and it was followed by higher mining stock prices. What does itimply for the future? It suggests that the rally that was likely to happenbased on the invalidation, may have already happened. Moreover, since theminers are approaching their resistance levels, it seems that the upsidepotential is quite limited.
Thegold miners are already in the lower part of their target area. This means thatthey might have already topped, or that the top will be formed at slightlyhigher levels. The HUI Index is already at the height of the left shoulder ofthe previous head-and-shoulders pattern. It might reverse right away, but itmight move also to the right shoulder (at about 152.5) or to the rising dashedline that’s based on both above-mentioned shoulders (at about 154).
Goldminers are naturally connected with the price of gold and if gold declinedsignificantly from here, it would be normal to expect the mining stocks todecline. And indeed, we expect both to decline. But does it mean that the bearishoutlook for the mining stocks is based only on the outlook for gold? Of coursenot. One of the things that should be considered is mining stocks’ relativeperformance to gold.
Theyjust jumped relative to gold, so that’s definitely bullish? No.
Inall areas of life, things in excess can easily turn into their opposite. Andthat seems to be the case here.
MiningStocks’ Outperformance: The Brightest Flame Burns Quickest
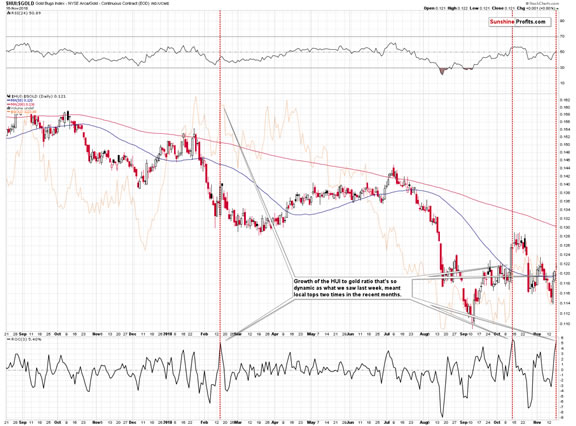
Theabove chart features the gold stock to gold ratio. It rallied recently and therally was sharp. Too sharp. The ROC (Rate of Change) indicator in the bottompart of the above chart shows the rapidness of the recent growth in the ratio.In other words, it gives a numerical and comparable value of how fast minersoutperformed.
Thisvalue moved to its previous extreme and this was the case only two times in therecent past. Once about a month ago, and once in February. What happened next?The orange line in the background of the above chart shows what happened ingold. It moved back and forth for several days and then it declined. The mostimportant thing is that the rally didn’t continue in any significant way.Whether it was the top or not wasn’t that critical. It was critical to closeany remaining long positions at that time and at least consider opening shortpositions. In the absence of other bearish factors, one might have preferred towait for more bearish confirmations, but at this time we have multiple sellsignals in place, many of which are very strong.
InMetallica’s Mama Said song, one ofthe verses starts with the statement that “the brightest flame burns quickest”and it’s likely that we just saw an example thereof in case of the gold stocks togold ratio. The rally was too sharp to be sustainable and thus it’s quitelikely to end rather sooner than later.
Can GoldReally Drop Despite Its Fundamental Situation?
Yes. The fundamental situation doesn’t determine whether the price will move higher or lower in the short- (definitely) or medium- (mostly) term. One could simultaneously see a decrease in gold prices along with a decline in gold supply, decline in gold inventory, a decrease in gold production cost, and even a temporary boost from a positive safe-haven role of gold in light of new trade war announcements. The very foundation of our gold investment philosophy is to focus on the fundamental factors in order to determine the very long-term outlook for gold (that’s what it is useful for) and then to determine the likely scenarios for the medium and short term using the tools that are useful for it. At this time, the latter provide us with a very bearish gold forecast for the following weeks.
Summary
Summingup, the small corrective upswing that was likely to take place based on the fewshort-term bullish signals seems to have already taken place – either entirely,or mostly. It seems that we will not have to wait long before the bigdownswings resumes. And if the likely outcome takes place and the decline isindeed similar to the one from 2013, all this waiting will be extremely wellworth it. We may see somewhat higher PM prices in the next few days, but thismove is not likely to change anything. The key word here is “may” – the big plunge could take place any day,so we are not adjusting our positions based on the above possibility. The risk to reward ratio continues to favorshort positions in gold, silver, and mining stocks because of all the long-termfactors that remain in place and that we discussed recently.
Naturally,the above is up-to-date at the moment of publishing it and the situation may –and is likely to – change in the future. If you’d like to receive follow-ups tothe above analysis (including the intraday ones, when things get hot), weinvite you subscribe to our Gold &Silver Trading Alerts today.
Thank you.
Przemyslaw Radomski, CFA
Founder, Editor-in-chief
Toolsfor Effective Gold & Silver Investments - SunshineProfits.com
Tools für EffektivesGold- und Silber-Investment - SunshineProfits.DE
* * * * *
About Sunshine Profits
SunshineProfits enables anyone to forecast market changes with a level of accuracy thatwas once only available to closed-door institutions. It provides free trialaccess to its best investment tools (including lists of best gold stocks and best silver stocks),proprietary gold & silver indicators, buy & sell signals, weekly newsletter, and more. Seeing is believing.
Disclaimer
All essays, research and information found aboverepresent analyses and opinions of Przemyslaw Radomski, CFA and SunshineProfits' associates only. As such, it may prove wrong and be a subject tochange without notice. Opinions and analyses were based on data available toauthors of respective essays at the time of writing. Although the informationprovided above is based on careful research and sources that are believed to beaccurate, Przemyslaw Radomski, CFA and his associates do not guarantee theaccuracy or thoroughness of the data or information reported. The opinionspublished above are neither an offer nor a recommendation to purchase or sell anysecurities. Mr. Radomski is not a Registered Securities Advisor. By readingPrzemyslaw Radomski's, CFA reports you fully agree that he will not be heldresponsible or liable for any decisions you make regarding any informationprovided in these reports. Investing, trading and speculation in any financialmarkets may involve high risk of loss. Przemyslaw Radomski, CFA, SunshineProfits' employees and affiliates as well as members of their families may havea short or long position in any securities, including those mentioned in any ofthe reports or essays, and may make additional purchases and/or sales of thosesecurities without notice.
Przemyslaw Radomski Archive |
© 2005-2018 http://www.MarketOracle.co.uk - The Market Oracle is a FREE Daily Financial Markets Analysis & Forecasting online publication.