Gold Sits Just Under $1,300 - The Trend Is Your Friend
The rise from the mid-August low continues.
Consolidation at just under $1,300 per ounce.
Rising open interest is a bullish sign.
Three reasons for higher gold and a challenge of the 2016 peak.
GDX and GDXJ could outperform gold and NUGT and JNUG are not for the faint of heart, but they could be explosive.
The gold futures market has settled into a narrowing trading band that near the highest price for the yellow metal since June 2018.
Gold put in a double top trading pattern on the weekly and monthly charts last year as the price rose to a high at $1365.40 which was $12.10 below the 2016 post-Brexit referendum high at $1377.50 and the level of critical technical resistance in the gold futures market. The failure at that level the second time up sent the price to a low at $1161.40 in mid-August which was a new low for 2018 and the lowest price for gold since early 2017. Gold declined on the back of a strong dollar, a disappointment over the lack of follow through and the inability to rise to a higher peak.
Now that the precious metal has worked its way back to just under the $1300 per ounce level, it is in position to mount a challenge to the double-top technical formation and perhaps the 2016 peak which was the highest price since 2014 when gold as on its way down from the all-time high at $1920.70 in 2011.
Gold tends to take the stairs to the upside which it has been doing since the mid-August low. To turbocharge trading or investing results in the gold market if it is going to continue its ascent, gold mining stocks tend to move more on a percentage basis on both the up and the downside. Therefore, the current bullish sentiment at under the $1300 level could be a reason to consider three products that offer different levels of exposure to the gold market. The VanEck Vectors Gold Miners ETF product (GDX) often returns more than gold when a move gets underway as gold mining shares exacerbate the price action in the yellow metal. The VanEck Vectors Junior Gold Miners ETF (GDXJ) tends to provide more volatility than GDX since the junior gold miners move more than the majors on a percentage basis. Finally, the Direxion Daily Gold Miners Bull 3X Bull 3X ETF (NUGT) and the Direction Daily Junior Gold Miners Bull 3X EFT (JNUG) turbocharge the results from GDX and GDXJ, but they are only appropriate for short-term positions in the shares.
The rise from the mid-August low continues
Appreciation in the gold futures market has been slow and steady since the mid-August bottom. 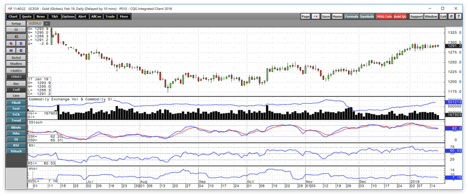
Source: CQG
As the daily chart of February COMEX gold futures highlights, the price of gold moved steadily higher over the past five months. Open interest, the total number of open long and short positions in the futures market has been rising with the price which is typically a bullish sign in a futures market. Both price momentum and relative strength metrics on the daily chart are at the upper end of neutral territory but are not pointing to any significant trend. Daily historical volatility at 7.16% reflects a market that moves more like a currency than a commodity which is not out of the ordinary for gold which has a dual role as a metal and means of exchange in the world. Gold rose from a low at $1161.40 in August to its most recent high at $1300.40 on January 4, a rebound of 12% and it is now positioned much closer to the 2016 peak than the August low.
Consolidation at just under $1300 per ounce
The daily chart also exhibits a period of consolidation in the gold market so far in 2019. While February futures have traded in a range from $1278.10 to the $1300.40, a range of $22.30 as of Thursday, January 17. Moreover, the range has been narrowing, and since January 10 the range between the high and low has only been from $1286.50 and $1298.00, or $11.50. Gold reminds me of a rubber band that is slowly being pulled in opposite directions. When the tension gets too intense, it will snap, and the break will likely lead to a significant move on the up or the downside. Given the trend over the past five months, the odds currently favor an eventual move to a new and higher high.
Rising open interest is a bullish sign
While supply and demand factors tend to guide the path of least resistance of most commodities prices, markets like gold and silver are different. When I first started in the trading business one of my mentors told me always to remember that gold only moved higher when there are more buyers than sellers and that when selling is greater than buying, it falls. At the time, I did not think much of the lesson that I thought was nothing more than a joke and a truism for all markets, but as I matured, I realized that what he was referring to was that the primary determinate of the path of least resistance for the two precious metals was sentiment. Supply and demand in the gold market tend to take a backseat to the power of investment demand when it comes to analyzing the market's potential direction. One guide I use for sentiment is the open interest metric in the COMEX futures market. The measure fell to a low at 388,910 contracts on November 30 when the price of the yellow metal traded to a low at $1221.80 on the February contract. On January 16, it had increased to 501,213 contracts with gold at over $1290. The price of the metal had risen by under 6% with the open interest metric almost 29% higher. The rise in open interest tells us a lot about the current sentiment in the gold market which is bullish. In late November, the metric fell to its lowest level since early 2016, at the current level it is approaching the mid-November high at 528,149 contracts which led to liquidation in gold as silver fell to a new and lower low at $13.86 and the dollar index hit a new high. The open interest reflects that market participants bailed out of the gold market for fear it would follow silver to the downside and that they have returned over recent weeks as the price has been moving higher. The one risk when it comes to this metric is that a continuation of a rise in the total number of open positions could lead to an imbalance where the market becomes overly long which tends to lead to a corrective move to clean out weaker longs in the market. The all-time high in gold open interest came in early July 2016 following the shock of the Brexit referendum at just under 656,000 contracts. At that level, the overenthusiastic positions in the gold market led to a corrective move to the downside.
Three reasons for higher gold and a challenge of the 2016 peak
There are currently three reasons why I believe the path of least resistance for gold is higher. The first is that it has not reacted to a rising dollar since August. A rising dollar tends to be bearish for the price of gold, but the yellow metal has ignored strength in the greenback which is currently sitting a lot closer to the highs than the lows compared to its price level over the past year. When a market ignores input that should send the price lower, it is often a sign of underlying strength.
The second reason is that the political and economic landscapes in the US and around the world remain highly uncertain which is likely to foster periods of fear and uncertainty in markets across all asset classes. Times of rising concerns tend to support the price of gold which serves as both a barometer and safe haven asset during troubled times.
Finally, after a year where the Fed hiked the short-term interest rate by 25 basis points four times, 2019 is likely to be a year where the central bank takes a less aggressive and hawkish approach to monetary policy given the current economic conditions and recent volatility in the stock and bond markets. Over the past years, a less hawkish Fed has been supportive of the price of the yellow metal. At the same time, other central banks around the world continue to be net buyers of gold which is likely to continue in 2019 as China and Russia are increasing reserves by capturing domestic production. Official sector buying and bullish sentiment are a combination that could take the price of gold significantly higher than its current price at just under $1300 per ounce as of January 17.
GDX and GDXJ could outperform gold and NUGT and JNUG are not for the faint of heart, but they could be explosive
The most direct route for a long position in the gold market is to buy the yellow metal in the form of coins or bars or to take a long position in the COMEX futures and futures options market. However, an investment in gold mining shares can increase value on the long side of the market as these companies are leveraged. The higher the price of gold moves, the more money they make, and the more gold they can produce. Consolidation in the gold mining industry has led to two monster producers in the world, Barrick Gold Corporation (GOLD) with a market cap of $20.745 billion and Newmont Mining (NEM) with a market cap of $16.628 billion. An investment in any one gold miner assumes the additional risk of their management, specific properties, and other individual factors that could impact the price of their shares regardless of the price of gold. Gold rose from $1161.40 on mid-August to a high at $1300.40 in early January, a rise of 12%.
The VanEck Vectors Gold Miners ETF product (GDX) is a diversified product, and the top holdings include Barrick and Newmont as well as other leading gold producing companies. 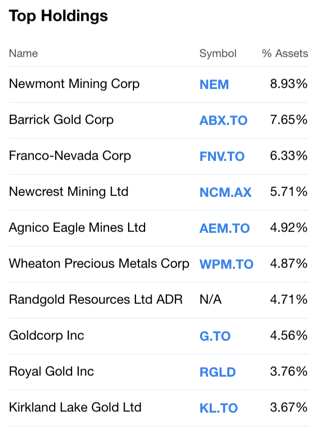
Source: Yahoo Finance
As the chart shows, as of January 17, Newmont and Barrick only accounted for under 20% of the holdings of GDX which diversifies the risk of individual gold miners. 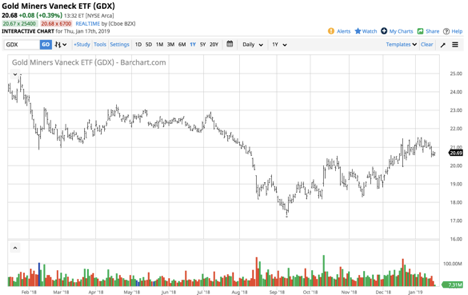
Source: Barchart
As the chart shows, GDX moved from lows at $17.28 per share to highs of $21.54 during the same period, a rise of 24.7% as the GDX slightly outperformed gold depending on timing factors.
The VanEck Vectors Junior Gold Miners ETF (GDXJ) is more volatile than GDX because junior miners involved in exploration is a riskier business. However, when sentiment in the gold market turns bullish junior gold miners tend to attract lots of investment interest and prices of the stocks can become explosive. GDXJ is an instrument that offers diversification when it comes to exposure to the more leveraged sector of the gold-producing arena. The most recent top holdings of GDXJ include:
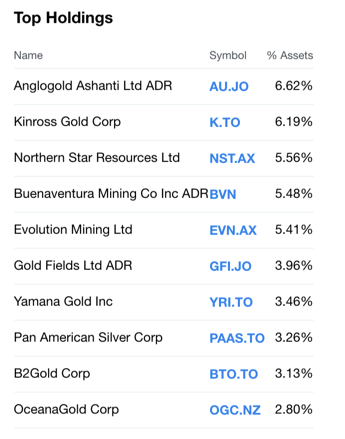
Source: Yahoo Finance
The chart of the GDXJ shows how this instrument provides more leverage than a long position in gold. 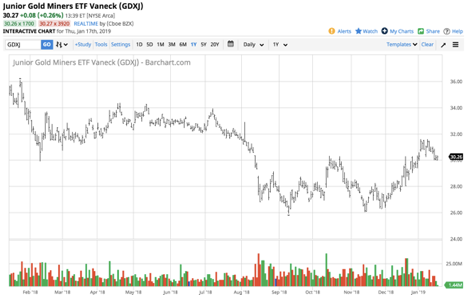
Source: Barchart
The move from $25.91 to $31.59 per share or 22% was more on a percentage basis than gold but slightly under the return of GDX. However, during runaway bull markets, GDXJ is likely to attract more speculative interest than GDX and outperform the more conservative ETF product on a percentage basis.
Volatility junkies in the gold arena often turn to the
Direxion Daily Gold Miners Bull 3X Bull 3X ETF (NUGT) and the Direction Daily Junior Gold Miners Bull 3X EFT (JNUG) for short-term positions on the long side of the market. The leverage provided by these products comes at a price which is time decay. Therefore, they are only appropriate for positions lasting a few days or at the longest weeks. GDX and GDXJ can remain in portfolios for longer periods. However, NUGT and JNUG can turbocharge short-term results on a percentage basis. A recent example is a rally in the price of February gold futures from lows at $1192 on October 8 to a high at $1235.70 on October 11, a rise of 3.7% over the short period. GDX moved from $18.14 to $19.98 over the period, an increase of 10% and GDXJ appreciated from $26.92 to $29.50 or 9.5% over the period. Meanwhile, NUGT and JNUG had more dramatic returns over the period in October.
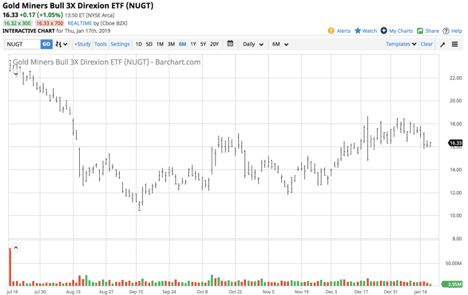
Source: Barchart
As the chart shows, NUGT moved from $12.12 to $15.98 or 31.8% higher.
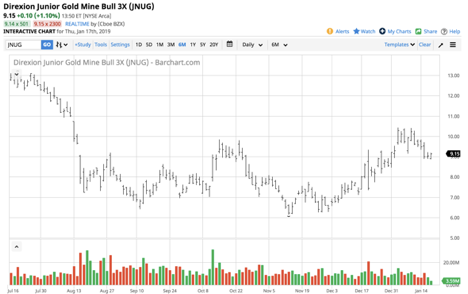
Source: Barchart
JNUG rallied from $7.02 to $9.10 on October 11, a rise of just under 30%.
There are many options when it comes to approaching gold on the long side these days. The price of the yellow metal is sitting at just under $1300, and it will not be long before buyers and sellers decide if the bullish trend will continue to take the price higher. I continue to be bullish on the prospects for gold these days. I would stop out of any long positions if the price were to drop below the level of support at $1236.50 per ounce.
The Hecht Commodity Report is one of the most comprehensive commodities reports available today from the #2 ranked author in both commodities and precious metals. My weekly report covers the market movements of 20 different commodities and provides bullish, bearish and neutral calls; directional trading recommendations, and actionable ideas for traders.
Disclosure: I/we have no positions in any stocks mentioned, and no plans to initiate any positions within the next 72 hours. I wrote this article myself, and it expresses my own opinions. I am not receiving compensation for it (other than from Seeking Alpha). I have no business relationship with any company whose stock is mentioned in this article.
Additional disclosure: The author always has positions in commodities markets in futures, options, ETF/ETN products, and commodity equities. These long and short positions tend to change on an intraday basis.
Follow Andrew Hecht and get email alerts