Gold/SPX Ratio and the Gold Stock Case / Commodities / Gold and Silver 2021
Gold/SPX indicated the excess and the gold miners are correcting that excess
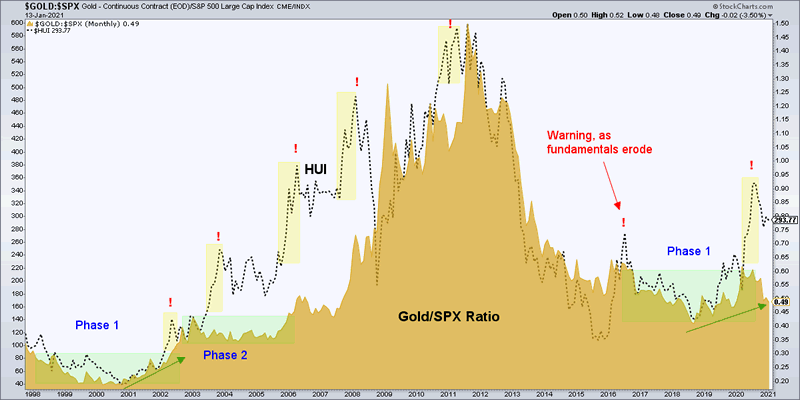
In and around the August time frame we noted (in NFTRH) high risk to the gold miners because the price of HUI had gotten a million miles ahead of gold’s ratio to the stock market. That was typical bit in the mouth enthusiasm by the gold “community”, as even Warren Buffett bought a gold stock (and signaled a top).
This chart (and another I have like it) revealed to us in real time the excessive condition. Could the miners have just kept going, into a bubble of their own? Sure, but very unlikely. Amid the bubble making elsewhere gold, silver and the miners are doing the right thing… and they are doing nothing that they did not do several times in the bull market circa 2001-2007. Those bull market grinds were interminable, but ultimately gave way to grand new highs when the healthy corrective work was complete.
As for the 2016 case, by May we were forced to acknowledge the degrading fundamentals and the sector topped that summer into an extended new decline, bear market bottom (in the ratio) and eventual bull call in 2019.

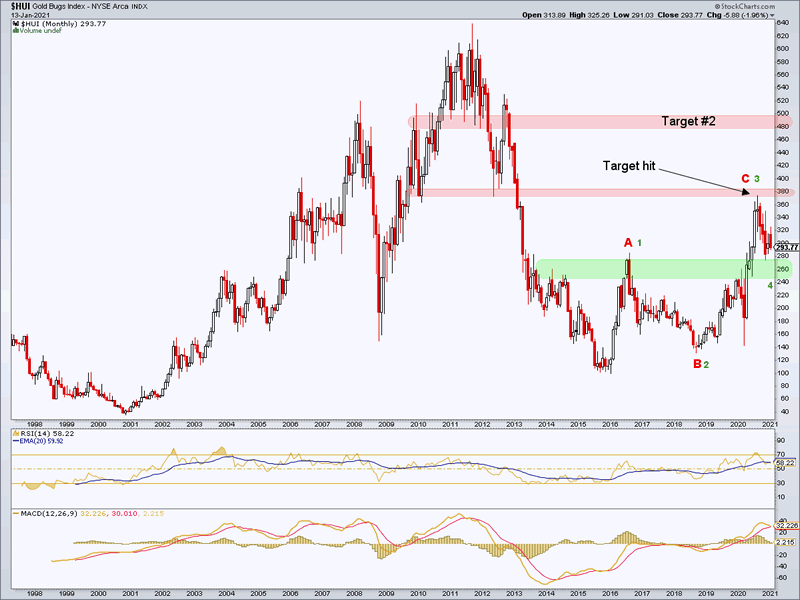
From there we targeted HUI 375, which was put in the books in hysterical fashion and so folks, here we are. It’s all normal. Unfortunately, we do not yet have the technical answer as to whether normal means an A-B-C bear market correction (already in the books) or a future 5th wave to HUI 500.
And do you know what? Indicators like the Gold/SPX ratio (along with Au/CRB, Au/Oil, Au/Cu, Yield Curve, inflation/deflation and the economic backdrop itself) will determine.
To my eye, the monthly chart of HUI still looks excellent as it grinds out the pretenders and true believers alike. This corrective consolidation ain’t got nothin’ on the ones that took place in the 2001-2007 bull.

It’s a time for patience, perspective and a willingness to accept what lays ahead. Right now Wayne, Garth and a world full of relieved party-goers are celebrating the new US administration, the incremental return of political order and well, their Tesla stock and Bitcoins. This party is no place for gold. But it remains in doubt whether it is sustainable as well.
Hence why HUI will probably hold support (it hit our #1 downside target of 280 back in November, but an increasingly likely downside target #2 is still out there) after shaking ’em all out and prepare for upside target #2 per the chart above.
The above are big picture charts and shorter-term technical noise will continue to be managed on daily charts. But this is not a broken sector by any means. If the world is not going promptly back to its happy place socially, politically and economically, this will be opportunity.
Watch for Gold/SPX, as noted here, to bottom. That will be among the first keys.
For “best of breed” top down analysis of all major markets, subscribe to NFTRH Premium, which includes an in-depth weekly market report, detailed interim market updates and NFTRH+ dynamic updates and chart/trade setup ideas. You can also keep up to date with actionable public content at NFTRH.com by using the email form on the right sidebar. Follow via Twitter ;@NFTRHgt.
By Gary Tanashian
© 2021 Copyright Gary Tanashian - All Rights Reserved
Disclaimer: The above is a matter of opinion provided for general information purposes only and is not intended as investment advice. Information and analysis above are derived from sources and utilising methods believed to be reliable, but we cannot accept responsibility for any losses you may incur as a result of this analysis. Individuals should consult with their personal financial advisors.
Gary Tanashian Archive |
© 2005-2019 http://www.MarketOracle.co.uk - The Market Oracle is a FREE Daily Financial Markets Analysis & Forecasting online publication.
